Free Statistics

of Irreproducible Research!

Author's title

Author*The author of this computation has been verified*
R Software Modulerwasp_autocorrelation.wasp
Title produced by software(Partial) Autocorrelation Function
Date of computationSun, 14 Dec 2008 13:40:55 -0700
Cite this page as followsStatistical Computations at FreeStatistics.org, Office for Research Development and Education, URL https://freestatistics.org/blog/index.php?v=date/2008/Dec/14/t1229287310pax8k5pp4l3cglc.htm/, Retrieved Wed, 15 May 2024 15:35:48 +0000
Statistical Computations at FreeStatistics.org, Office for Research Development and Education, URL https://freestatistics.org/blog/index.php?pk=33563, Retrieved Wed, 15 May 2024 15:35:48 +0000
QR Codes:

Original text written by user:
IsPrivate?No (this computation is public)
User-defined keywordsgdm
Estimated Impact142
Family? (F = Feedback message, R = changed R code, M = changed R Module, P = changed Parameters, D = changed Data)
-       [(Partial) Autocorrelation Function] [Werkloosheid bij ...] [2008-12-14 20:40:55] [99f79d508deef838ee89a56fb32f134e] [Current]
Feedback Forum

Post a new message
Dataseries X:
88900
87280
85519
83647
81616
80100
94027
102327
104296
101593
94816
93535
93618
92330
90751
88576
86102
85494
103432
108870
109713
106960
103195
102348
102158
100431
97649
95611
93035
93579
111777
116065
116609
112934
107660
107965
107772
106201
102288
99217
96511
96456
113021
117836
118492
113922
109317
107496
105524
103824
101833
99436
96915
96072
111941
116008
117557
113445
108762
106661
102824
101912
99005
97894
96256
95606
108948
111223
113142
106078
100992
97413


Summary of computational transaction
Raw Inputview raw input (R code)
Raw Outputview raw output of R engine
Computing time1 seconds
R Server'Gwilym Jenkins' @ 72.249.127.135

\begin{tabular}{lllllllll}
\hline
Summary of computational transaction \tabularnewline
Raw Input & view raw input (R code)  \tabularnewline
Raw Output & view raw output of R engine  \tabularnewline
Computing time & 1 seconds \tabularnewline
R Server & 'Gwilym Jenkins' @ 72.249.127.135 \tabularnewline
\hline
\end{tabular}
%Source: https://freestatistics.org/blog/index.php?pk=33563&T=0

[TABLE]
[ROW][C]Summary of computational transaction[/C][/ROW]
[ROW][C]Raw Input[/C][C]view raw input (R code) [/C][/ROW]
[ROW][C]Raw Output[/C][C]view raw output of R engine [/C][/ROW]
[ROW][C]Computing time[/C][C]1 seconds[/C][/ROW]
[ROW][C]R Server[/C][C]'Gwilym Jenkins' @ 72.249.127.135[/C][/ROW]
[/TABLE]
Source: https://freestatistics.org/blog/index.php?pk=33563&T=0

Globally Unique Identifier (entire table): ba.freestatistics.org/blog/index.php?pk=33563&T=0

As an alternative you can also use a QR Code:  

The GUIDs for individual cells are displayed in the table below:

Summary of computational transaction
Raw Inputview raw input (R code)
Raw Outputview raw output of R engine
Computing time1 seconds
R Server'Gwilym Jenkins' @ 72.249.127.135


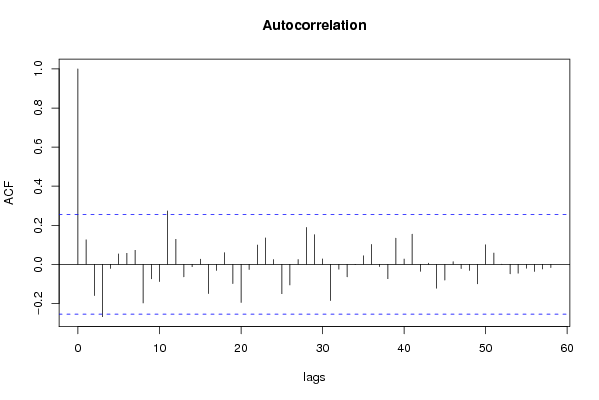
Autocorrelation Function
Time lag kACF(k)T-STATP-value
10.12530.96240.169876
2-0.160038-1.22930.111924
3-0.26779-2.05690.022061
4-0.021048-0.16170.436058
50.0534960.41090.341315
60.0564410.43350.333104
70.0720210.55320.291106
8-0.197673-1.51840.067132
9-0.07426-0.57040.285287
10-0.088212-0.67760.250347
110.2734432.10040.019991
120.1280370.98350.164696
13-0.063626-0.48870.313427
14-0.012246-0.09410.462689
150.0261180.20060.420843
16-0.149322-1.1470.128014
17-0.031319-0.24060.405364
180.0596980.45850.324123
19-0.09826-0.75470.226702
20-0.195352-1.50050.069405
21-0.026459-0.20320.419825
220.0984440.75620.22628
230.1349091.03630.152155
240.0247390.190.424972
25-0.150134-1.15320.126739
26-0.105413-0.80970.210684
270.0241950.18580.426602
280.1890171.45190.075918
290.1520251.16770.123807
300.0273640.21020.417122
31-0.185729-1.42660.079482
32-0.024742-0.190.424964
33-0.063689-0.48920.313255
34-0.001286-0.00990.496075
350.0434360.33360.369918
360.1019210.78290.218417
37-0.011696-0.08980.464359
38-0.073567-0.56510.287082
390.1335371.02570.154606
400.0268540.20630.418645
410.154111.18370.120631
42-0.036002-0.27650.39155
430.0061170.0470.481341
44-0.121873-0.93610.176512
45-0.080237-0.61630.270029
460.0136470.10480.458434
47-0.021791-0.16740.433822
48-0.031291-0.24040.405446
49-0.099508-0.76430.223857
500.099710.76590.223399
510.0578460.44430.329216
520.0008720.00670.497338
53-0.048835-0.37510.354462
54-0.045414-0.34880.364229
55-0.020046-0.1540.439076
56-0.036423-0.27980.390315
57-0.023588-0.18120.428423
58-0.01643-0.12620.45
59NANANA
60NANANA

\begin{tabular}{lllllllll}
\hline
Autocorrelation Function \tabularnewline
Time lag k & ACF(k) & T-STAT & P-value \tabularnewline
1 & 0.1253 & 0.9624 & 0.169876 \tabularnewline
2 & -0.160038 & -1.2293 & 0.111924 \tabularnewline
3 & -0.26779 & -2.0569 & 0.022061 \tabularnewline
4 & -0.021048 & -0.1617 & 0.436058 \tabularnewline
5 & 0.053496 & 0.4109 & 0.341315 \tabularnewline
6 & 0.056441 & 0.4335 & 0.333104 \tabularnewline
7 & 0.072021 & 0.5532 & 0.291106 \tabularnewline
8 & -0.197673 & -1.5184 & 0.067132 \tabularnewline
9 & -0.07426 & -0.5704 & 0.285287 \tabularnewline
10 & -0.088212 & -0.6776 & 0.250347 \tabularnewline
11 & 0.273443 & 2.1004 & 0.019991 \tabularnewline
12 & 0.128037 & 0.9835 & 0.164696 \tabularnewline
13 & -0.063626 & -0.4887 & 0.313427 \tabularnewline
14 & -0.012246 & -0.0941 & 0.462689 \tabularnewline
15 & 0.026118 & 0.2006 & 0.420843 \tabularnewline
16 & -0.149322 & -1.147 & 0.128014 \tabularnewline
17 & -0.031319 & -0.2406 & 0.405364 \tabularnewline
18 & 0.059698 & 0.4585 & 0.324123 \tabularnewline
19 & -0.09826 & -0.7547 & 0.226702 \tabularnewline
20 & -0.195352 & -1.5005 & 0.069405 \tabularnewline
21 & -0.026459 & -0.2032 & 0.419825 \tabularnewline
22 & 0.098444 & 0.7562 & 0.22628 \tabularnewline
23 & 0.134909 & 1.0363 & 0.152155 \tabularnewline
24 & 0.024739 & 0.19 & 0.424972 \tabularnewline
25 & -0.150134 & -1.1532 & 0.126739 \tabularnewline
26 & -0.105413 & -0.8097 & 0.210684 \tabularnewline
27 & 0.024195 & 0.1858 & 0.426602 \tabularnewline
28 & 0.189017 & 1.4519 & 0.075918 \tabularnewline
29 & 0.152025 & 1.1677 & 0.123807 \tabularnewline
30 & 0.027364 & 0.2102 & 0.417122 \tabularnewline
31 & -0.185729 & -1.4266 & 0.079482 \tabularnewline
32 & -0.024742 & -0.19 & 0.424964 \tabularnewline
33 & -0.063689 & -0.4892 & 0.313255 \tabularnewline
34 & -0.001286 & -0.0099 & 0.496075 \tabularnewline
35 & 0.043436 & 0.3336 & 0.369918 \tabularnewline
36 & 0.101921 & 0.7829 & 0.218417 \tabularnewline
37 & -0.011696 & -0.0898 & 0.464359 \tabularnewline
38 & -0.073567 & -0.5651 & 0.287082 \tabularnewline
39 & 0.133537 & 1.0257 & 0.154606 \tabularnewline
40 & 0.026854 & 0.2063 & 0.418645 \tabularnewline
41 & 0.15411 & 1.1837 & 0.120631 \tabularnewline
42 & -0.036002 & -0.2765 & 0.39155 \tabularnewline
43 & 0.006117 & 0.047 & 0.481341 \tabularnewline
44 & -0.121873 & -0.9361 & 0.176512 \tabularnewline
45 & -0.080237 & -0.6163 & 0.270029 \tabularnewline
46 & 0.013647 & 0.1048 & 0.458434 \tabularnewline
47 & -0.021791 & -0.1674 & 0.433822 \tabularnewline
48 & -0.031291 & -0.2404 & 0.405446 \tabularnewline
49 & -0.099508 & -0.7643 & 0.223857 \tabularnewline
50 & 0.09971 & 0.7659 & 0.223399 \tabularnewline
51 & 0.057846 & 0.4443 & 0.329216 \tabularnewline
52 & 0.000872 & 0.0067 & 0.497338 \tabularnewline
53 & -0.048835 & -0.3751 & 0.354462 \tabularnewline
54 & -0.045414 & -0.3488 & 0.364229 \tabularnewline
55 & -0.020046 & -0.154 & 0.439076 \tabularnewline
56 & -0.036423 & -0.2798 & 0.390315 \tabularnewline
57 & -0.023588 & -0.1812 & 0.428423 \tabularnewline
58 & -0.01643 & -0.1262 & 0.45 \tabularnewline
59 & NA & NA & NA \tabularnewline
60 & NA & NA & NA \tabularnewline
\hline
\end{tabular}
%Source: https://freestatistics.org/blog/index.php?pk=33563&T=1

[TABLE]
[ROW][C]Autocorrelation Function[/C][/ROW]
[ROW][C]Time lag k[/C][C]ACF(k)[/C][C]T-STAT[/C][C]P-value[/C][/ROW]
[ROW][C]1[/C][C]0.1253[/C][C]0.9624[/C][C]0.169876[/C][/ROW]
[ROW][C]2[/C][C]-0.160038[/C][C]-1.2293[/C][C]0.111924[/C][/ROW]
[ROW][C]3[/C][C]-0.26779[/C][C]-2.0569[/C][C]0.022061[/C][/ROW]
[ROW][C]4[/C][C]-0.021048[/C][C]-0.1617[/C][C]0.436058[/C][/ROW]
[ROW][C]5[/C][C]0.053496[/C][C]0.4109[/C][C]0.341315[/C][/ROW]
[ROW][C]6[/C][C]0.056441[/C][C]0.4335[/C][C]0.333104[/C][/ROW]
[ROW][C]7[/C][C]0.072021[/C][C]0.5532[/C][C]0.291106[/C][/ROW]
[ROW][C]8[/C][C]-0.197673[/C][C]-1.5184[/C][C]0.067132[/C][/ROW]
[ROW][C]9[/C][C]-0.07426[/C][C]-0.5704[/C][C]0.285287[/C][/ROW]
[ROW][C]10[/C][C]-0.088212[/C][C]-0.6776[/C][C]0.250347[/C][/ROW]
[ROW][C]11[/C][C]0.273443[/C][C]2.1004[/C][C]0.019991[/C][/ROW]
[ROW][C]12[/C][C]0.128037[/C][C]0.9835[/C][C]0.164696[/C][/ROW]
[ROW][C]13[/C][C]-0.063626[/C][C]-0.4887[/C][C]0.313427[/C][/ROW]
[ROW][C]14[/C][C]-0.012246[/C][C]-0.0941[/C][C]0.462689[/C][/ROW]
[ROW][C]15[/C][C]0.026118[/C][C]0.2006[/C][C]0.420843[/C][/ROW]
[ROW][C]16[/C][C]-0.149322[/C][C]-1.147[/C][C]0.128014[/C][/ROW]
[ROW][C]17[/C][C]-0.031319[/C][C]-0.2406[/C][C]0.405364[/C][/ROW]
[ROW][C]18[/C][C]0.059698[/C][C]0.4585[/C][C]0.324123[/C][/ROW]
[ROW][C]19[/C][C]-0.09826[/C][C]-0.7547[/C][C]0.226702[/C][/ROW]
[ROW][C]20[/C][C]-0.195352[/C][C]-1.5005[/C][C]0.069405[/C][/ROW]
[ROW][C]21[/C][C]-0.026459[/C][C]-0.2032[/C][C]0.419825[/C][/ROW]
[ROW][C]22[/C][C]0.098444[/C][C]0.7562[/C][C]0.22628[/C][/ROW]
[ROW][C]23[/C][C]0.134909[/C][C]1.0363[/C][C]0.152155[/C][/ROW]
[ROW][C]24[/C][C]0.024739[/C][C]0.19[/C][C]0.424972[/C][/ROW]
[ROW][C]25[/C][C]-0.150134[/C][C]-1.1532[/C][C]0.126739[/C][/ROW]
[ROW][C]26[/C][C]-0.105413[/C][C]-0.8097[/C][C]0.210684[/C][/ROW]
[ROW][C]27[/C][C]0.024195[/C][C]0.1858[/C][C]0.426602[/C][/ROW]
[ROW][C]28[/C][C]0.189017[/C][C]1.4519[/C][C]0.075918[/C][/ROW]
[ROW][C]29[/C][C]0.152025[/C][C]1.1677[/C][C]0.123807[/C][/ROW]
[ROW][C]30[/C][C]0.027364[/C][C]0.2102[/C][C]0.417122[/C][/ROW]
[ROW][C]31[/C][C]-0.185729[/C][C]-1.4266[/C][C]0.079482[/C][/ROW]
[ROW][C]32[/C][C]-0.024742[/C][C]-0.19[/C][C]0.424964[/C][/ROW]
[ROW][C]33[/C][C]-0.063689[/C][C]-0.4892[/C][C]0.313255[/C][/ROW]
[ROW][C]34[/C][C]-0.001286[/C][C]-0.0099[/C][C]0.496075[/C][/ROW]
[ROW][C]35[/C][C]0.043436[/C][C]0.3336[/C][C]0.369918[/C][/ROW]
[ROW][C]36[/C][C]0.101921[/C][C]0.7829[/C][C]0.218417[/C][/ROW]
[ROW][C]37[/C][C]-0.011696[/C][C]-0.0898[/C][C]0.464359[/C][/ROW]
[ROW][C]38[/C][C]-0.073567[/C][C]-0.5651[/C][C]0.287082[/C][/ROW]
[ROW][C]39[/C][C]0.133537[/C][C]1.0257[/C][C]0.154606[/C][/ROW]
[ROW][C]40[/C][C]0.026854[/C][C]0.2063[/C][C]0.418645[/C][/ROW]
[ROW][C]41[/C][C]0.15411[/C][C]1.1837[/C][C]0.120631[/C][/ROW]
[ROW][C]42[/C][C]-0.036002[/C][C]-0.2765[/C][C]0.39155[/C][/ROW]
[ROW][C]43[/C][C]0.006117[/C][C]0.047[/C][C]0.481341[/C][/ROW]
[ROW][C]44[/C][C]-0.121873[/C][C]-0.9361[/C][C]0.176512[/C][/ROW]
[ROW][C]45[/C][C]-0.080237[/C][C]-0.6163[/C][C]0.270029[/C][/ROW]
[ROW][C]46[/C][C]0.013647[/C][C]0.1048[/C][C]0.458434[/C][/ROW]
[ROW][C]47[/C][C]-0.021791[/C][C]-0.1674[/C][C]0.433822[/C][/ROW]
[ROW][C]48[/C][C]-0.031291[/C][C]-0.2404[/C][C]0.405446[/C][/ROW]
[ROW][C]49[/C][C]-0.099508[/C][C]-0.7643[/C][C]0.223857[/C][/ROW]
[ROW][C]50[/C][C]0.09971[/C][C]0.7659[/C][C]0.223399[/C][/ROW]
[ROW][C]51[/C][C]0.057846[/C][C]0.4443[/C][C]0.329216[/C][/ROW]
[ROW][C]52[/C][C]0.000872[/C][C]0.0067[/C][C]0.497338[/C][/ROW]
[ROW][C]53[/C][C]-0.048835[/C][C]-0.3751[/C][C]0.354462[/C][/ROW]
[ROW][C]54[/C][C]-0.045414[/C][C]-0.3488[/C][C]0.364229[/C][/ROW]
[ROW][C]55[/C][C]-0.020046[/C][C]-0.154[/C][C]0.439076[/C][/ROW]
[ROW][C]56[/C][C]-0.036423[/C][C]-0.2798[/C][C]0.390315[/C][/ROW]
[ROW][C]57[/C][C]-0.023588[/C][C]-0.1812[/C][C]0.428423[/C][/ROW]
[ROW][C]58[/C][C]-0.01643[/C][C]-0.1262[/C][C]0.45[/C][/ROW]
[ROW][C]59[/C][C]NA[/C][C]NA[/C][C]NA[/C][/ROW]
[ROW][C]60[/C][C]NA[/C][C]NA[/C][C]NA[/C][/ROW]
[/TABLE]
Source: https://freestatistics.org/blog/index.php?pk=33563&T=1

Globally Unique Identifier (entire table): ba.freestatistics.org/blog/index.php?pk=33563&T=1

As an alternative you can also use a QR Code:  

The GUIDs for individual cells are displayed in the table below:

Autocorrelation Function
Time lag kACF(k)T-STATP-value
10.12530.96240.169876
2-0.160038-1.22930.111924
3-0.26779-2.05690.022061
4-0.021048-0.16170.436058
50.0534960.41090.341315
60.0564410.43350.333104
70.0720210.55320.291106
8-0.197673-1.51840.067132
9-0.07426-0.57040.285287
10-0.088212-0.67760.250347
110.2734432.10040.019991
120.1280370.98350.164696
13-0.063626-0.48870.313427
14-0.012246-0.09410.462689
150.0261180.20060.420843
16-0.149322-1.1470.128014
17-0.031319-0.24060.405364
180.0596980.45850.324123
19-0.09826-0.75470.226702
20-0.195352-1.50050.069405
21-0.026459-0.20320.419825
220.0984440.75620.22628
230.1349091.03630.152155
240.0247390.190.424972
25-0.150134-1.15320.126739
26-0.105413-0.80970.210684
270.0241950.18580.426602
280.1890171.45190.075918
290.1520251.16770.123807
300.0273640.21020.417122
31-0.185729-1.42660.079482
32-0.024742-0.190.424964
33-0.063689-0.48920.313255
34-0.001286-0.00990.496075
350.0434360.33360.369918
360.1019210.78290.218417
37-0.011696-0.08980.464359
38-0.073567-0.56510.287082
390.1335371.02570.154606
400.0268540.20630.418645
410.154111.18370.120631
42-0.036002-0.27650.39155
430.0061170.0470.481341
44-0.121873-0.93610.176512
45-0.080237-0.61630.270029
460.0136470.10480.458434
47-0.021791-0.16740.433822
48-0.031291-0.24040.405446
49-0.099508-0.76430.223857
500.099710.76590.223399
510.0578460.44430.329216
520.0008720.00670.497338
53-0.048835-0.37510.354462
54-0.045414-0.34880.364229
55-0.020046-0.1540.439076
56-0.036423-0.27980.390315
57-0.023588-0.18120.428423
58-0.01643-0.12620.45
59NANANA
60NANANA


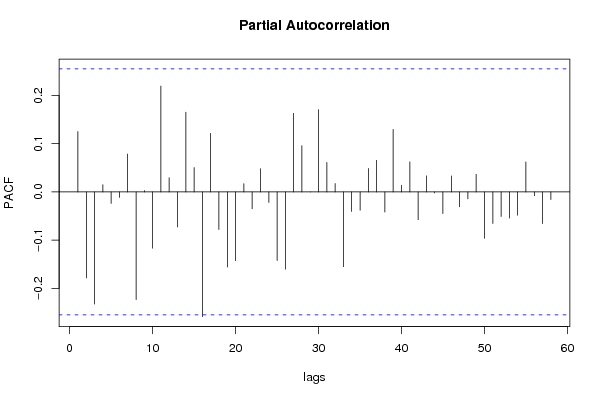
Partial Autocorrelation Function
Time lag kPACF(k)T-STATP-value
10.12530.96240.169876
2-0.178542-1.37140.087721
3-0.232742-1.78770.039478
40.0149320.11470.454537
5-0.023972-0.18410.42727
6-0.011544-0.08870.464823
70.0785320.60320.274338
8-0.223262-1.71490.045806
90.0028310.02170.491362
10-0.116683-0.89630.186878
110.2197731.68810.048335
120.0295280.22680.410678
13-0.072839-0.55950.288975
140.1655231.27140.104287
150.0506360.38890.34936
16-0.258771-1.98770.025749
170.1215120.93340.177221
18-0.077731-0.59710.276374
19-0.156011-1.19830.117788
20-0.142785-1.09680.138602
210.0172140.13220.447629
22-0.034788-0.26720.395118
230.0481160.36960.356507
24-0.021811-0.16750.433762
25-0.142473-1.09440.139123
26-0.160258-1.2310.111611
270.1630321.25230.107706
280.0960410.73770.231808
292.9e-052e-040.499912
300.170551.310.097634
310.0612790.47070.319797
320.017340.13320.447248
33-0.155163-1.19180.119049
34-0.040371-0.31010.378789
35-0.037972-0.29170.385783
360.0486720.37390.354925
370.0656420.50420.307996
38-0.041738-0.32060.374825
390.1296390.99580.161713
400.0139840.10740.457413
410.0623650.4790.316843
42-0.057582-0.44230.329945
430.0333220.2560.399439
44-0.001988-0.01530.493935
45-0.044894-0.34480.365721
460.0331120.25430.40006
47-0.030966-0.23790.406408
48-0.014405-0.11070.456135
490.0364830.28020.39014
50-0.096356-0.74010.23108
51-0.065431-0.50260.308562
52-0.050974-0.39150.348406
53-0.054252-0.41670.339199
54-0.048165-0.370.356369
550.0621580.47740.317405
56-0.007866-0.06040.476011
57-0.065706-0.50470.307825
58-0.015916-0.12230.451558
59NANANA
60NANANA

\begin{tabular}{lllllllll}
\hline
Partial Autocorrelation Function \tabularnewline
Time lag k & PACF(k) & T-STAT & P-value \tabularnewline
1 & 0.1253 & 0.9624 & 0.169876 \tabularnewline
2 & -0.178542 & -1.3714 & 0.087721 \tabularnewline
3 & -0.232742 & -1.7877 & 0.039478 \tabularnewline
4 & 0.014932 & 0.1147 & 0.454537 \tabularnewline
5 & -0.023972 & -0.1841 & 0.42727 \tabularnewline
6 & -0.011544 & -0.0887 & 0.464823 \tabularnewline
7 & 0.078532 & 0.6032 & 0.274338 \tabularnewline
8 & -0.223262 & -1.7149 & 0.045806 \tabularnewline
9 & 0.002831 & 0.0217 & 0.491362 \tabularnewline
10 & -0.116683 & -0.8963 & 0.186878 \tabularnewline
11 & 0.219773 & 1.6881 & 0.048335 \tabularnewline
12 & 0.029528 & 0.2268 & 0.410678 \tabularnewline
13 & -0.072839 & -0.5595 & 0.288975 \tabularnewline
14 & 0.165523 & 1.2714 & 0.104287 \tabularnewline
15 & 0.050636 & 0.3889 & 0.34936 \tabularnewline
16 & -0.258771 & -1.9877 & 0.025749 \tabularnewline
17 & 0.121512 & 0.9334 & 0.177221 \tabularnewline
18 & -0.077731 & -0.5971 & 0.276374 \tabularnewline
19 & -0.156011 & -1.1983 & 0.117788 \tabularnewline
20 & -0.142785 & -1.0968 & 0.138602 \tabularnewline
21 & 0.017214 & 0.1322 & 0.447629 \tabularnewline
22 & -0.034788 & -0.2672 & 0.395118 \tabularnewline
23 & 0.048116 & 0.3696 & 0.356507 \tabularnewline
24 & -0.021811 & -0.1675 & 0.433762 \tabularnewline
25 & -0.142473 & -1.0944 & 0.139123 \tabularnewline
26 & -0.160258 & -1.231 & 0.111611 \tabularnewline
27 & 0.163032 & 1.2523 & 0.107706 \tabularnewline
28 & 0.096041 & 0.7377 & 0.231808 \tabularnewline
29 & 2.9e-05 & 2e-04 & 0.499912 \tabularnewline
30 & 0.17055 & 1.31 & 0.097634 \tabularnewline
31 & 0.061279 & 0.4707 & 0.319797 \tabularnewline
32 & 0.01734 & 0.1332 & 0.447248 \tabularnewline
33 & -0.155163 & -1.1918 & 0.119049 \tabularnewline
34 & -0.040371 & -0.3101 & 0.378789 \tabularnewline
35 & -0.037972 & -0.2917 & 0.385783 \tabularnewline
36 & 0.048672 & 0.3739 & 0.354925 \tabularnewline
37 & 0.065642 & 0.5042 & 0.307996 \tabularnewline
38 & -0.041738 & -0.3206 & 0.374825 \tabularnewline
39 & 0.129639 & 0.9958 & 0.161713 \tabularnewline
40 & 0.013984 & 0.1074 & 0.457413 \tabularnewline
41 & 0.062365 & 0.479 & 0.316843 \tabularnewline
42 & -0.057582 & -0.4423 & 0.329945 \tabularnewline
43 & 0.033322 & 0.256 & 0.399439 \tabularnewline
44 & -0.001988 & -0.0153 & 0.493935 \tabularnewline
45 & -0.044894 & -0.3448 & 0.365721 \tabularnewline
46 & 0.033112 & 0.2543 & 0.40006 \tabularnewline
47 & -0.030966 & -0.2379 & 0.406408 \tabularnewline
48 & -0.014405 & -0.1107 & 0.456135 \tabularnewline
49 & 0.036483 & 0.2802 & 0.39014 \tabularnewline
50 & -0.096356 & -0.7401 & 0.23108 \tabularnewline
51 & -0.065431 & -0.5026 & 0.308562 \tabularnewline
52 & -0.050974 & -0.3915 & 0.348406 \tabularnewline
53 & -0.054252 & -0.4167 & 0.339199 \tabularnewline
54 & -0.048165 & -0.37 & 0.356369 \tabularnewline
55 & 0.062158 & 0.4774 & 0.317405 \tabularnewline
56 & -0.007866 & -0.0604 & 0.476011 \tabularnewline
57 & -0.065706 & -0.5047 & 0.307825 \tabularnewline
58 & -0.015916 & -0.1223 & 0.451558 \tabularnewline
59 & NA & NA & NA \tabularnewline
60 & NA & NA & NA \tabularnewline
\hline
\end{tabular}
%Source: https://freestatistics.org/blog/index.php?pk=33563&T=2

[TABLE]
[ROW][C]Partial Autocorrelation Function[/C][/ROW]
[ROW][C]Time lag k[/C][C]PACF(k)[/C][C]T-STAT[/C][C]P-value[/C][/ROW]
[ROW][C]1[/C][C]0.1253[/C][C]0.9624[/C][C]0.169876[/C][/ROW]
[ROW][C]2[/C][C]-0.178542[/C][C]-1.3714[/C][C]0.087721[/C][/ROW]
[ROW][C]3[/C][C]-0.232742[/C][C]-1.7877[/C][C]0.039478[/C][/ROW]
[ROW][C]4[/C][C]0.014932[/C][C]0.1147[/C][C]0.454537[/C][/ROW]
[ROW][C]5[/C][C]-0.023972[/C][C]-0.1841[/C][C]0.42727[/C][/ROW]
[ROW][C]6[/C][C]-0.011544[/C][C]-0.0887[/C][C]0.464823[/C][/ROW]
[ROW][C]7[/C][C]0.078532[/C][C]0.6032[/C][C]0.274338[/C][/ROW]
[ROW][C]8[/C][C]-0.223262[/C][C]-1.7149[/C][C]0.045806[/C][/ROW]
[ROW][C]9[/C][C]0.002831[/C][C]0.0217[/C][C]0.491362[/C][/ROW]
[ROW][C]10[/C][C]-0.116683[/C][C]-0.8963[/C][C]0.186878[/C][/ROW]
[ROW][C]11[/C][C]0.219773[/C][C]1.6881[/C][C]0.048335[/C][/ROW]
[ROW][C]12[/C][C]0.029528[/C][C]0.2268[/C][C]0.410678[/C][/ROW]
[ROW][C]13[/C][C]-0.072839[/C][C]-0.5595[/C][C]0.288975[/C][/ROW]
[ROW][C]14[/C][C]0.165523[/C][C]1.2714[/C][C]0.104287[/C][/ROW]
[ROW][C]15[/C][C]0.050636[/C][C]0.3889[/C][C]0.34936[/C][/ROW]
[ROW][C]16[/C][C]-0.258771[/C][C]-1.9877[/C][C]0.025749[/C][/ROW]
[ROW][C]17[/C][C]0.121512[/C][C]0.9334[/C][C]0.177221[/C][/ROW]
[ROW][C]18[/C][C]-0.077731[/C][C]-0.5971[/C][C]0.276374[/C][/ROW]
[ROW][C]19[/C][C]-0.156011[/C][C]-1.1983[/C][C]0.117788[/C][/ROW]
[ROW][C]20[/C][C]-0.142785[/C][C]-1.0968[/C][C]0.138602[/C][/ROW]
[ROW][C]21[/C][C]0.017214[/C][C]0.1322[/C][C]0.447629[/C][/ROW]
[ROW][C]22[/C][C]-0.034788[/C][C]-0.2672[/C][C]0.395118[/C][/ROW]
[ROW][C]23[/C][C]0.048116[/C][C]0.3696[/C][C]0.356507[/C][/ROW]
[ROW][C]24[/C][C]-0.021811[/C][C]-0.1675[/C][C]0.433762[/C][/ROW]
[ROW][C]25[/C][C]-0.142473[/C][C]-1.0944[/C][C]0.139123[/C][/ROW]
[ROW][C]26[/C][C]-0.160258[/C][C]-1.231[/C][C]0.111611[/C][/ROW]
[ROW][C]27[/C][C]0.163032[/C][C]1.2523[/C][C]0.107706[/C][/ROW]
[ROW][C]28[/C][C]0.096041[/C][C]0.7377[/C][C]0.231808[/C][/ROW]
[ROW][C]29[/C][C]2.9e-05[/C][C]2e-04[/C][C]0.499912[/C][/ROW]
[ROW][C]30[/C][C]0.17055[/C][C]1.31[/C][C]0.097634[/C][/ROW]
[ROW][C]31[/C][C]0.061279[/C][C]0.4707[/C][C]0.319797[/C][/ROW]
[ROW][C]32[/C][C]0.01734[/C][C]0.1332[/C][C]0.447248[/C][/ROW]
[ROW][C]33[/C][C]-0.155163[/C][C]-1.1918[/C][C]0.119049[/C][/ROW]
[ROW][C]34[/C][C]-0.040371[/C][C]-0.3101[/C][C]0.378789[/C][/ROW]
[ROW][C]35[/C][C]-0.037972[/C][C]-0.2917[/C][C]0.385783[/C][/ROW]
[ROW][C]36[/C][C]0.048672[/C][C]0.3739[/C][C]0.354925[/C][/ROW]
[ROW][C]37[/C][C]0.065642[/C][C]0.5042[/C][C]0.307996[/C][/ROW]
[ROW][C]38[/C][C]-0.041738[/C][C]-0.3206[/C][C]0.374825[/C][/ROW]
[ROW][C]39[/C][C]0.129639[/C][C]0.9958[/C][C]0.161713[/C][/ROW]
[ROW][C]40[/C][C]0.013984[/C][C]0.1074[/C][C]0.457413[/C][/ROW]
[ROW][C]41[/C][C]0.062365[/C][C]0.479[/C][C]0.316843[/C][/ROW]
[ROW][C]42[/C][C]-0.057582[/C][C]-0.4423[/C][C]0.329945[/C][/ROW]
[ROW][C]43[/C][C]0.033322[/C][C]0.256[/C][C]0.399439[/C][/ROW]
[ROW][C]44[/C][C]-0.001988[/C][C]-0.0153[/C][C]0.493935[/C][/ROW]
[ROW][C]45[/C][C]-0.044894[/C][C]-0.3448[/C][C]0.365721[/C][/ROW]
[ROW][C]46[/C][C]0.033112[/C][C]0.2543[/C][C]0.40006[/C][/ROW]
[ROW][C]47[/C][C]-0.030966[/C][C]-0.2379[/C][C]0.406408[/C][/ROW]
[ROW][C]48[/C][C]-0.014405[/C][C]-0.1107[/C][C]0.456135[/C][/ROW]
[ROW][C]49[/C][C]0.036483[/C][C]0.2802[/C][C]0.39014[/C][/ROW]
[ROW][C]50[/C][C]-0.096356[/C][C]-0.7401[/C][C]0.23108[/C][/ROW]
[ROW][C]51[/C][C]-0.065431[/C][C]-0.5026[/C][C]0.308562[/C][/ROW]
[ROW][C]52[/C][C]-0.050974[/C][C]-0.3915[/C][C]0.348406[/C][/ROW]
[ROW][C]53[/C][C]-0.054252[/C][C]-0.4167[/C][C]0.339199[/C][/ROW]
[ROW][C]54[/C][C]-0.048165[/C][C]-0.37[/C][C]0.356369[/C][/ROW]
[ROW][C]55[/C][C]0.062158[/C][C]0.4774[/C][C]0.317405[/C][/ROW]
[ROW][C]56[/C][C]-0.007866[/C][C]-0.0604[/C][C]0.476011[/C][/ROW]
[ROW][C]57[/C][C]-0.065706[/C][C]-0.5047[/C][C]0.307825[/C][/ROW]
[ROW][C]58[/C][C]-0.015916[/C][C]-0.1223[/C][C]0.451558[/C][/ROW]
[ROW][C]59[/C][C]NA[/C][C]NA[/C][C]NA[/C][/ROW]
[ROW][C]60[/C][C]NA[/C][C]NA[/C][C]NA[/C][/ROW]
[/TABLE]
Source: https://freestatistics.org/blog/index.php?pk=33563&T=2

Globally Unique Identifier (entire table): ba.freestatistics.org/blog/index.php?pk=33563&T=2

As an alternative you can also use a QR Code:  

The GUIDs for individual cells are displayed in the table below:

Partial Autocorrelation Function
Time lag kPACF(k)T-STATP-value
10.12530.96240.169876
2-0.178542-1.37140.087721
3-0.232742-1.78770.039478
40.0149320.11470.454537
5-0.023972-0.18410.42727
6-0.011544-0.08870.464823
70.0785320.60320.274338
8-0.223262-1.71490.045806
90.0028310.02170.491362
10-0.116683-0.89630.186878
110.2197731.68810.048335
120.0295280.22680.410678
13-0.072839-0.55950.288975
140.1655231.27140.104287
150.0506360.38890.34936
16-0.258771-1.98770.025749
170.1215120.93340.177221
18-0.077731-0.59710.276374
19-0.156011-1.19830.117788
20-0.142785-1.09680.138602
210.0172140.13220.447629
22-0.034788-0.26720.395118
230.0481160.36960.356507
24-0.021811-0.16750.433762
25-0.142473-1.09440.139123
26-0.160258-1.2310.111611
270.1630321.25230.107706
280.0960410.73770.231808
292.9e-052e-040.499912
300.170551.310.097634
310.0612790.47070.319797
320.017340.13320.447248
33-0.155163-1.19180.119049
34-0.040371-0.31010.378789
35-0.037972-0.29170.385783
360.0486720.37390.354925
370.0656420.50420.307996
38-0.041738-0.32060.374825
390.1296390.99580.161713
400.0139840.10740.457413
410.0623650.4790.316843
42-0.057582-0.44230.329945
430.0333220.2560.399439
44-0.001988-0.01530.493935
45-0.044894-0.34480.365721
460.0331120.25430.40006
47-0.030966-0.23790.406408
48-0.014405-0.11070.456135
490.0364830.28020.39014
50-0.096356-0.74010.23108
51-0.065431-0.50260.308562
52-0.050974-0.39150.348406
53-0.054252-0.41670.339199
54-0.048165-0.370.356369
550.0621580.47740.317405
56-0.007866-0.06040.476011
57-0.065706-0.50470.307825
58-0.015916-0.12230.451558
59NANANA
60NANANA


Parameters (Session):
par1 = 60 ; par2 = -2.0 ; par3 = 1 ; par4 = 1 ; par5 = 12 ;
Parameters (R input):
par1 = 60 ; par2 = -2.0 ; par3 = 1 ; par4 = 1 ; par5 = 12 ;
R code (references can be found in the software module):
if (par1 == 'Default') {
par1 = 10*log10(length(x))
} else {
par1 <- as.numeric(par1)
}
par2 <- as.numeric(par2)
par3 <- as.numeric(par3)
par4 <- as.numeric(par4)
par5 <- as.numeric(par5)
if (par2 == 0) {
x <- log(x)
} else {
x <- (x ^ par2 - 1) / par2
}
if (par3 > 0) x <- diff(x,lag=1,difference=par3)
if (par4 > 0) x <- diff(x,lag=par5,difference=par4)
bitmap(file='pic1.png')
racf <- acf(x,par1,main='Autocorrelation',xlab='lags',ylab='ACF')
dev.off()
bitmap(file='pic2.png')
rpacf <- pacf(x,par1,main='Partial Autocorrelation',xlab='lags',ylab='PACF')
dev.off()
(myacf <- c(racf$acf))
(mypacf <- c(rpacf$acf))
lengthx <- length(x)
sqrtn <- sqrt(lengthx)
load(file='createtable')
a<-table.start()
a<-table.row.start(a)
a<-table.element(a,'Autocorrelation Function',4,TRUE)
a<-table.row.end(a)
a<-table.row.start(a)
a<-table.element(a,'Time lag k',header=TRUE)
a<-table.element(a,hyperlink('basics.htm','ACF(k)','click here for more information about the Autocorrelation Function'),header=TRUE)
a<-table.element(a,'T-STAT',header=TRUE)
a<-table.element(a,'P-value',header=TRUE)
a<-table.row.end(a)
for (i in 2:(par1+1)) {
a<-table.row.start(a)
a<-table.element(a,i-1,header=TRUE)
a<-table.element(a,round(myacf[i],6))
mytstat <- myacf[i]*sqrtn
a<-table.element(a,round(mytstat,4))
a<-table.element(a,round(1-pt(abs(mytstat),lengthx),6))
a<-table.row.end(a)
}
a<-table.end(a)
table.save(a,file='mytable.tab')
a<-table.start()
a<-table.row.start(a)
a<-table.element(a,'Partial Autocorrelation Function',4,TRUE)
a<-table.row.end(a)
a<-table.row.start(a)
a<-table.element(a,'Time lag k',header=TRUE)
a<-table.element(a,hyperlink('basics.htm','PACF(k)','click here for more information about the Partial Autocorrelation Function'),header=TRUE)
a<-table.element(a,'T-STAT',header=TRUE)
a<-table.element(a,'P-value',header=TRUE)
a<-table.row.end(a)
for (i in 1:par1) {
a<-table.row.start(a)
a<-table.element(a,i,header=TRUE)
a<-table.element(a,round(mypacf[i],6))
mytstat <- mypacf[i]*sqrtn
a<-table.element(a,round(mytstat,4))
a<-table.element(a,round(1-pt(abs(mytstat),lengthx),6))
a<-table.row.end(a)
}
a<-table.end(a)
table.save(a,file='mytable1.tab')