Free Statistics

of Irreproducible Research!

Author's title

Author*The author of this computation has been verified*
R Software Modulerwasp_autocorrelation.wasp
Title produced by software(Partial) Autocorrelation Function
Date of computationSun, 14 Dec 2008 13:34:04 -0700
Cite this page as followsStatistical Computations at FreeStatistics.org, Office for Research Development and Education, URL https://freestatistics.org/blog/index.php?v=date/2008/Dec/14/t12292870293jj6p0xzi2xuxjv.htm/, Retrieved Wed, 15 May 2024 07:58:02 +0000
Statistical Computations at FreeStatistics.org, Office for Research Development and Education, URL https://freestatistics.org/blog/index.php?pk=33560, Retrieved Wed, 15 May 2024 07:58:02 +0000
QR Codes:

Original text written by user:
IsPrivate?No (this computation is public)
User-defined keywordsgdm
Estimated Impact150
Family? (F = Feedback message, R = changed R code, M = changed R Module, P = changed Parameters, D = changed Data)
-       [(Partial) Autocorrelation Function] [Werkloosheid bij ...] [2008-12-14 20:34:04] [99f79d508deef838ee89a56fb32f134e] [Current]
Feedback Forum

Post a new message
Dataseries X:
88900
87280
85519
83647
81616
80100
94027
102327
104296
101593
94816
93535
93618
92330
90751
88576
86102
85494
103432
108870
109713
106960
103195
102348
102158
100431
97649
95611
93035
93579
111777
116065
116609
112934
107660
107965
107772
106201
102288
99217
96511
96456
113021
117836
118492
113922
109317
107496
105524
103824
101833
99436
96915
96072
111941
116008
117557
113445
108762
106661
102824
101912
99005
97894
96256
95606
108948
111223
113142
106078
100992
97413


Summary of computational transaction
Raw Inputview raw input (R code)
Raw Outputview raw output of R engine
Computing time1 seconds
R Server'Gwilym Jenkins' @ 72.249.127.135

\begin{tabular}{lllllllll}
\hline
Summary of computational transaction \tabularnewline
Raw Input & view raw input (R code)  \tabularnewline
Raw Output & view raw output of R engine  \tabularnewline
Computing time & 1 seconds \tabularnewline
R Server & 'Gwilym Jenkins' @ 72.249.127.135 \tabularnewline
\hline
\end{tabular}
%Source: https://freestatistics.org/blog/index.php?pk=33560&T=0

[TABLE]
[ROW][C]Summary of computational transaction[/C][/ROW]
[ROW][C]Raw Input[/C][C]view raw input (R code) [/C][/ROW]
[ROW][C]Raw Output[/C][C]view raw output of R engine [/C][/ROW]
[ROW][C]Computing time[/C][C]1 seconds[/C][/ROW]
[ROW][C]R Server[/C][C]'Gwilym Jenkins' @ 72.249.127.135[/C][/ROW]
[/TABLE]
Source: https://freestatistics.org/blog/index.php?pk=33560&T=0

Globally Unique Identifier (entire table): ba.freestatistics.org/blog/index.php?pk=33560&T=0

As an alternative you can also use a QR Code:  

The GUIDs for individual cells are displayed in the table below:

Summary of computational transaction
Raw Inputview raw input (R code)
Raw Outputview raw output of R engine
Computing time1 seconds
R Server'Gwilym Jenkins' @ 72.249.127.135


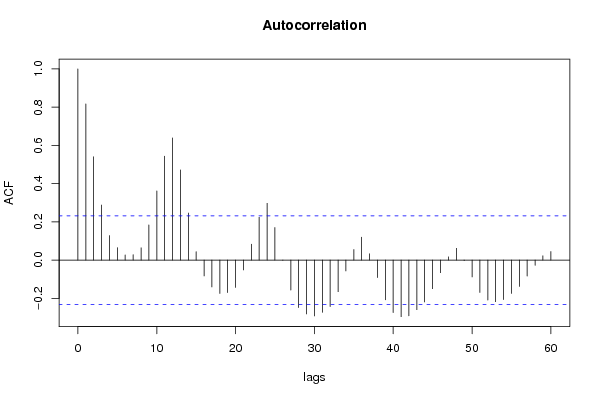
Autocorrelation Function
Time lag kACF(k)T-STATP-value
10.8166726.92970
20.5404134.58569e-06
30.2879922.44370.008495
40.1282651.08840.140031
50.064910.55080.291744
60.026780.22720.410442
70.0285930.24260.404494
80.064430.54670.293134
90.1839911.56120.061429
100.3618933.07080.001506
110.5437944.61428e-06
120.6391715.42350
130.4716144.00187.5e-05
140.2459652.08710.020211
150.0440930.37410.3547
16-0.083036-0.70460.241672
17-0.140537-1.19250.118491
18-0.174103-1.47730.071977
19-0.16983-1.44110.076952
20-0.143101-1.21430.11431
21-0.051395-0.43610.332034
220.0835370.70880.240357
230.224181.90220.030571
240.2973412.5230.006922
250.1703111.44510.076378
26-0.001292-0.0110.495641
27-0.156902-1.33140.093636
28-0.248188-2.10590.019348
29-0.281544-2.3890.009759
30-0.292242-2.47980.007744
31-0.273258-2.31870.011628
32-0.2429-2.06110.021454
33-0.165274-1.40240.082547
34-0.057005-0.48370.315033
350.0551060.46760.320744
360.1201721.01970.155644
370.0328710.27890.390554
38-0.091206-0.77390.22076
39-0.207668-1.76210.041146
40-0.274629-2.33030.011298
41-0.295823-2.51010.007158
42-0.291542-2.47380.007863
43-0.25912-2.19870.015556
44-0.219171-1.85970.033504
45-0.149573-1.26920.104235
46-0.065953-0.55960.288734
470.0168920.14330.443214
480.0617510.5240.300952
49-0.002191-0.01860.49261
50-0.088387-0.750.227854
51-0.16891-1.43320.078058
52-0.209158-1.77480.040082
53-0.217437-1.8450.034574
54-0.206681-1.75370.041865
55-0.174416-1.480.071622
56-0.138098-1.17180.12257
57-0.083374-0.70750.240784
58-0.026952-0.22870.409878
590.0225790.19160.424303
600.0448170.38030.352427

\begin{tabular}{lllllllll}
\hline
Autocorrelation Function \tabularnewline
Time lag k & ACF(k) & T-STAT & P-value \tabularnewline
1 & 0.816672 & 6.9297 & 0 \tabularnewline
2 & 0.540413 & 4.5856 & 9e-06 \tabularnewline
3 & 0.287992 & 2.4437 & 0.008495 \tabularnewline
4 & 0.128265 & 1.0884 & 0.140031 \tabularnewline
5 & 0.06491 & 0.5508 & 0.291744 \tabularnewline
6 & 0.02678 & 0.2272 & 0.410442 \tabularnewline
7 & 0.028593 & 0.2426 & 0.404494 \tabularnewline
8 & 0.06443 & 0.5467 & 0.293134 \tabularnewline
9 & 0.183991 & 1.5612 & 0.061429 \tabularnewline
10 & 0.361893 & 3.0708 & 0.001506 \tabularnewline
11 & 0.543794 & 4.6142 & 8e-06 \tabularnewline
12 & 0.639171 & 5.4235 & 0 \tabularnewline
13 & 0.471614 & 4.0018 & 7.5e-05 \tabularnewline
14 & 0.245965 & 2.0871 & 0.020211 \tabularnewline
15 & 0.044093 & 0.3741 & 0.3547 \tabularnewline
16 & -0.083036 & -0.7046 & 0.241672 \tabularnewline
17 & -0.140537 & -1.1925 & 0.118491 \tabularnewline
18 & -0.174103 & -1.4773 & 0.071977 \tabularnewline
19 & -0.16983 & -1.4411 & 0.076952 \tabularnewline
20 & -0.143101 & -1.2143 & 0.11431 \tabularnewline
21 & -0.051395 & -0.4361 & 0.332034 \tabularnewline
22 & 0.083537 & 0.7088 & 0.240357 \tabularnewline
23 & 0.22418 & 1.9022 & 0.030571 \tabularnewline
24 & 0.297341 & 2.523 & 0.006922 \tabularnewline
25 & 0.170311 & 1.4451 & 0.076378 \tabularnewline
26 & -0.001292 & -0.011 & 0.495641 \tabularnewline
27 & -0.156902 & -1.3314 & 0.093636 \tabularnewline
28 & -0.248188 & -2.1059 & 0.019348 \tabularnewline
29 & -0.281544 & -2.389 & 0.009759 \tabularnewline
30 & -0.292242 & -2.4798 & 0.007744 \tabularnewline
31 & -0.273258 & -2.3187 & 0.011628 \tabularnewline
32 & -0.2429 & -2.0611 & 0.021454 \tabularnewline
33 & -0.165274 & -1.4024 & 0.082547 \tabularnewline
34 & -0.057005 & -0.4837 & 0.315033 \tabularnewline
35 & 0.055106 & 0.4676 & 0.320744 \tabularnewline
36 & 0.120172 & 1.0197 & 0.155644 \tabularnewline
37 & 0.032871 & 0.2789 & 0.390554 \tabularnewline
38 & -0.091206 & -0.7739 & 0.22076 \tabularnewline
39 & -0.207668 & -1.7621 & 0.041146 \tabularnewline
40 & -0.274629 & -2.3303 & 0.011298 \tabularnewline
41 & -0.295823 & -2.5101 & 0.007158 \tabularnewline
42 & -0.291542 & -2.4738 & 0.007863 \tabularnewline
43 & -0.25912 & -2.1987 & 0.015556 \tabularnewline
44 & -0.219171 & -1.8597 & 0.033504 \tabularnewline
45 & -0.149573 & -1.2692 & 0.104235 \tabularnewline
46 & -0.065953 & -0.5596 & 0.288734 \tabularnewline
47 & 0.016892 & 0.1433 & 0.443214 \tabularnewline
48 & 0.061751 & 0.524 & 0.300952 \tabularnewline
49 & -0.002191 & -0.0186 & 0.49261 \tabularnewline
50 & -0.088387 & -0.75 & 0.227854 \tabularnewline
51 & -0.16891 & -1.4332 & 0.078058 \tabularnewline
52 & -0.209158 & -1.7748 & 0.040082 \tabularnewline
53 & -0.217437 & -1.845 & 0.034574 \tabularnewline
54 & -0.206681 & -1.7537 & 0.041865 \tabularnewline
55 & -0.174416 & -1.48 & 0.071622 \tabularnewline
56 & -0.138098 & -1.1718 & 0.12257 \tabularnewline
57 & -0.083374 & -0.7075 & 0.240784 \tabularnewline
58 & -0.026952 & -0.2287 & 0.409878 \tabularnewline
59 & 0.022579 & 0.1916 & 0.424303 \tabularnewline
60 & 0.044817 & 0.3803 & 0.352427 \tabularnewline
\hline
\end{tabular}
%Source: https://freestatistics.org/blog/index.php?pk=33560&T=1

[TABLE]
[ROW][C]Autocorrelation Function[/C][/ROW]
[ROW][C]Time lag k[/C][C]ACF(k)[/C][C]T-STAT[/C][C]P-value[/C][/ROW]
[ROW][C]1[/C][C]0.816672[/C][C]6.9297[/C][C]0[/C][/ROW]
[ROW][C]2[/C][C]0.540413[/C][C]4.5856[/C][C]9e-06[/C][/ROW]
[ROW][C]3[/C][C]0.287992[/C][C]2.4437[/C][C]0.008495[/C][/ROW]
[ROW][C]4[/C][C]0.128265[/C][C]1.0884[/C][C]0.140031[/C][/ROW]
[ROW][C]5[/C][C]0.06491[/C][C]0.5508[/C][C]0.291744[/C][/ROW]
[ROW][C]6[/C][C]0.02678[/C][C]0.2272[/C][C]0.410442[/C][/ROW]
[ROW][C]7[/C][C]0.028593[/C][C]0.2426[/C][C]0.404494[/C][/ROW]
[ROW][C]8[/C][C]0.06443[/C][C]0.5467[/C][C]0.293134[/C][/ROW]
[ROW][C]9[/C][C]0.183991[/C][C]1.5612[/C][C]0.061429[/C][/ROW]
[ROW][C]10[/C][C]0.361893[/C][C]3.0708[/C][C]0.001506[/C][/ROW]
[ROW][C]11[/C][C]0.543794[/C][C]4.6142[/C][C]8e-06[/C][/ROW]
[ROW][C]12[/C][C]0.639171[/C][C]5.4235[/C][C]0[/C][/ROW]
[ROW][C]13[/C][C]0.471614[/C][C]4.0018[/C][C]7.5e-05[/C][/ROW]
[ROW][C]14[/C][C]0.245965[/C][C]2.0871[/C][C]0.020211[/C][/ROW]
[ROW][C]15[/C][C]0.044093[/C][C]0.3741[/C][C]0.3547[/C][/ROW]
[ROW][C]16[/C][C]-0.083036[/C][C]-0.7046[/C][C]0.241672[/C][/ROW]
[ROW][C]17[/C][C]-0.140537[/C][C]-1.1925[/C][C]0.118491[/C][/ROW]
[ROW][C]18[/C][C]-0.174103[/C][C]-1.4773[/C][C]0.071977[/C][/ROW]
[ROW][C]19[/C][C]-0.16983[/C][C]-1.4411[/C][C]0.076952[/C][/ROW]
[ROW][C]20[/C][C]-0.143101[/C][C]-1.2143[/C][C]0.11431[/C][/ROW]
[ROW][C]21[/C][C]-0.051395[/C][C]-0.4361[/C][C]0.332034[/C][/ROW]
[ROW][C]22[/C][C]0.083537[/C][C]0.7088[/C][C]0.240357[/C][/ROW]
[ROW][C]23[/C][C]0.22418[/C][C]1.9022[/C][C]0.030571[/C][/ROW]
[ROW][C]24[/C][C]0.297341[/C][C]2.523[/C][C]0.006922[/C][/ROW]
[ROW][C]25[/C][C]0.170311[/C][C]1.4451[/C][C]0.076378[/C][/ROW]
[ROW][C]26[/C][C]-0.001292[/C][C]-0.011[/C][C]0.495641[/C][/ROW]
[ROW][C]27[/C][C]-0.156902[/C][C]-1.3314[/C][C]0.093636[/C][/ROW]
[ROW][C]28[/C][C]-0.248188[/C][C]-2.1059[/C][C]0.019348[/C][/ROW]
[ROW][C]29[/C][C]-0.281544[/C][C]-2.389[/C][C]0.009759[/C][/ROW]
[ROW][C]30[/C][C]-0.292242[/C][C]-2.4798[/C][C]0.007744[/C][/ROW]
[ROW][C]31[/C][C]-0.273258[/C][C]-2.3187[/C][C]0.011628[/C][/ROW]
[ROW][C]32[/C][C]-0.2429[/C][C]-2.0611[/C][C]0.021454[/C][/ROW]
[ROW][C]33[/C][C]-0.165274[/C][C]-1.4024[/C][C]0.082547[/C][/ROW]
[ROW][C]34[/C][C]-0.057005[/C][C]-0.4837[/C][C]0.315033[/C][/ROW]
[ROW][C]35[/C][C]0.055106[/C][C]0.4676[/C][C]0.320744[/C][/ROW]
[ROW][C]36[/C][C]0.120172[/C][C]1.0197[/C][C]0.155644[/C][/ROW]
[ROW][C]37[/C][C]0.032871[/C][C]0.2789[/C][C]0.390554[/C][/ROW]
[ROW][C]38[/C][C]-0.091206[/C][C]-0.7739[/C][C]0.22076[/C][/ROW]
[ROW][C]39[/C][C]-0.207668[/C][C]-1.7621[/C][C]0.041146[/C][/ROW]
[ROW][C]40[/C][C]-0.274629[/C][C]-2.3303[/C][C]0.011298[/C][/ROW]
[ROW][C]41[/C][C]-0.295823[/C][C]-2.5101[/C][C]0.007158[/C][/ROW]
[ROW][C]42[/C][C]-0.291542[/C][C]-2.4738[/C][C]0.007863[/C][/ROW]
[ROW][C]43[/C][C]-0.25912[/C][C]-2.1987[/C][C]0.015556[/C][/ROW]
[ROW][C]44[/C][C]-0.219171[/C][C]-1.8597[/C][C]0.033504[/C][/ROW]
[ROW][C]45[/C][C]-0.149573[/C][C]-1.2692[/C][C]0.104235[/C][/ROW]
[ROW][C]46[/C][C]-0.065953[/C][C]-0.5596[/C][C]0.288734[/C][/ROW]
[ROW][C]47[/C][C]0.016892[/C][C]0.1433[/C][C]0.443214[/C][/ROW]
[ROW][C]48[/C][C]0.061751[/C][C]0.524[/C][C]0.300952[/C][/ROW]
[ROW][C]49[/C][C]-0.002191[/C][C]-0.0186[/C][C]0.49261[/C][/ROW]
[ROW][C]50[/C][C]-0.088387[/C][C]-0.75[/C][C]0.227854[/C][/ROW]
[ROW][C]51[/C][C]-0.16891[/C][C]-1.4332[/C][C]0.078058[/C][/ROW]
[ROW][C]52[/C][C]-0.209158[/C][C]-1.7748[/C][C]0.040082[/C][/ROW]
[ROW][C]53[/C][C]-0.217437[/C][C]-1.845[/C][C]0.034574[/C][/ROW]
[ROW][C]54[/C][C]-0.206681[/C][C]-1.7537[/C][C]0.041865[/C][/ROW]
[ROW][C]55[/C][C]-0.174416[/C][C]-1.48[/C][C]0.071622[/C][/ROW]
[ROW][C]56[/C][C]-0.138098[/C][C]-1.1718[/C][C]0.12257[/C][/ROW]
[ROW][C]57[/C][C]-0.083374[/C][C]-0.7075[/C][C]0.240784[/C][/ROW]
[ROW][C]58[/C][C]-0.026952[/C][C]-0.2287[/C][C]0.409878[/C][/ROW]
[ROW][C]59[/C][C]0.022579[/C][C]0.1916[/C][C]0.424303[/C][/ROW]
[ROW][C]60[/C][C]0.044817[/C][C]0.3803[/C][C]0.352427[/C][/ROW]
[/TABLE]
Source: https://freestatistics.org/blog/index.php?pk=33560&T=1

Globally Unique Identifier (entire table): ba.freestatistics.org/blog/index.php?pk=33560&T=1

As an alternative you can also use a QR Code:  

The GUIDs for individual cells are displayed in the table below:

Autocorrelation Function
Time lag kACF(k)T-STATP-value
10.8166726.92970
20.5404134.58569e-06
30.2879922.44370.008495
40.1282651.08840.140031
50.064910.55080.291744
60.026780.22720.410442
70.0285930.24260.404494
80.064430.54670.293134
90.1839911.56120.061429
100.3618933.07080.001506
110.5437944.61428e-06
120.6391715.42350
130.4716144.00187.5e-05
140.2459652.08710.020211
150.0440930.37410.3547
16-0.083036-0.70460.241672
17-0.140537-1.19250.118491
18-0.174103-1.47730.071977
19-0.16983-1.44110.076952
20-0.143101-1.21430.11431
21-0.051395-0.43610.332034
220.0835370.70880.240357
230.224181.90220.030571
240.2973412.5230.006922
250.1703111.44510.076378
26-0.001292-0.0110.495641
27-0.156902-1.33140.093636
28-0.248188-2.10590.019348
29-0.281544-2.3890.009759
30-0.292242-2.47980.007744
31-0.273258-2.31870.011628
32-0.2429-2.06110.021454
33-0.165274-1.40240.082547
34-0.057005-0.48370.315033
350.0551060.46760.320744
360.1201721.01970.155644
370.0328710.27890.390554
38-0.091206-0.77390.22076
39-0.207668-1.76210.041146
40-0.274629-2.33030.011298
41-0.295823-2.51010.007158
42-0.291542-2.47380.007863
43-0.25912-2.19870.015556
44-0.219171-1.85970.033504
45-0.149573-1.26920.104235
46-0.065953-0.55960.288734
470.0168920.14330.443214
480.0617510.5240.300952
49-0.002191-0.01860.49261
50-0.088387-0.750.227854
51-0.16891-1.43320.078058
52-0.209158-1.77480.040082
53-0.217437-1.8450.034574
54-0.206681-1.75370.041865
55-0.174416-1.480.071622
56-0.138098-1.17180.12257
57-0.083374-0.70750.240784
58-0.026952-0.22870.409878
590.0225790.19160.424303
600.0448170.38030.352427


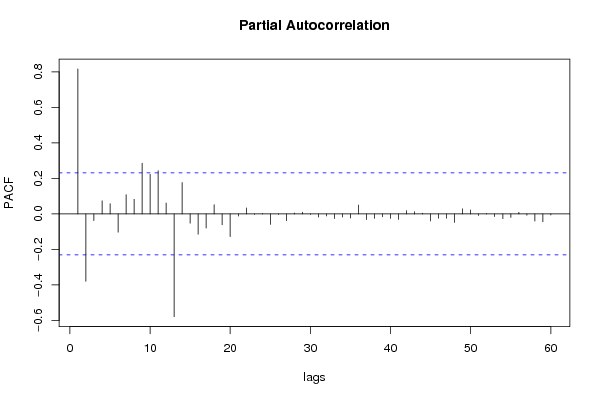
Partial Autocorrelation Function
Time lag kPACF(k)T-STATP-value
10.8166726.92970
2-0.379946-3.22390.000951
3-0.037694-0.31980.375005
40.0737550.62580.266701
50.0577520.490.312798
6-0.103025-0.87420.19246
70.1085250.92090.180097
80.0822150.69760.243831
90.2860332.42710.008862
100.2229091.89140.031294
110.2436312.06730.021152
120.0609170.51690.303407
13-0.578833-4.91163e-06
140.1766691.49910.069112
15-0.052261-0.44340.329386
16-0.114163-0.96870.167967
17-0.079538-0.67490.25095
180.0516260.43810.331326
19-0.061709-0.52360.301076
20-0.127928-1.08550.14066
21-0.011829-0.10040.460165
220.0334580.28390.388651
23-0.003255-0.02760.489021
240.001780.01510.493996
25-0.059407-0.50410.30787
26-0.003068-0.0260.489651
27-0.038357-0.32550.372884
280.0045180.03830.484764
290.0097210.08250.467243
30-0.002665-0.02260.49101
31-0.017795-0.1510.4402
32-0.011287-0.09580.461982
33-0.02631-0.22320.411988
34-0.018046-0.15310.439363
35-0.023159-0.19650.422381
360.0497840.42240.336986
37-0.031667-0.26870.394464
38-0.02454-0.20820.41782
39-0.016502-0.140.444514
40-0.025833-0.21920.413557
41-0.031501-0.26730.395003
420.0188970.16030.43653
430.0127710.10840.457002
440.0043020.03650.48549
45-0.03943-0.33460.36946
46-0.024222-0.20550.418867
47-0.024202-0.20540.418936
48-0.048172-0.40880.341966
490.0287450.24390.403996
500.0225870.19170.424274
51-0.008354-0.07090.471841
520.0023110.01960.492206
53-0.015154-0.12860.449021
54-0.027112-0.23010.409351
55-0.019633-0.16660.434078
560.0087940.07460.470361
57-0.007023-0.05960.476321
58-0.040057-0.33990.367463
59-0.043711-0.37090.355901
60-0.00575-0.04880.480612

\begin{tabular}{lllllllll}
\hline
Partial Autocorrelation Function \tabularnewline
Time lag k & PACF(k) & T-STAT & P-value \tabularnewline
1 & 0.816672 & 6.9297 & 0 \tabularnewline
2 & -0.379946 & -3.2239 & 0.000951 \tabularnewline
3 & -0.037694 & -0.3198 & 0.375005 \tabularnewline
4 & 0.073755 & 0.6258 & 0.266701 \tabularnewline
5 & 0.057752 & 0.49 & 0.312798 \tabularnewline
6 & -0.103025 & -0.8742 & 0.19246 \tabularnewline
7 & 0.108525 & 0.9209 & 0.180097 \tabularnewline
8 & 0.082215 & 0.6976 & 0.243831 \tabularnewline
9 & 0.286033 & 2.4271 & 0.008862 \tabularnewline
10 & 0.222909 & 1.8914 & 0.031294 \tabularnewline
11 & 0.243631 & 2.0673 & 0.021152 \tabularnewline
12 & 0.060917 & 0.5169 & 0.303407 \tabularnewline
13 & -0.578833 & -4.9116 & 3e-06 \tabularnewline
14 & 0.176669 & 1.4991 & 0.069112 \tabularnewline
15 & -0.052261 & -0.4434 & 0.329386 \tabularnewline
16 & -0.114163 & -0.9687 & 0.167967 \tabularnewline
17 & -0.079538 & -0.6749 & 0.25095 \tabularnewline
18 & 0.051626 & 0.4381 & 0.331326 \tabularnewline
19 & -0.061709 & -0.5236 & 0.301076 \tabularnewline
20 & -0.127928 & -1.0855 & 0.14066 \tabularnewline
21 & -0.011829 & -0.1004 & 0.460165 \tabularnewline
22 & 0.033458 & 0.2839 & 0.388651 \tabularnewline
23 & -0.003255 & -0.0276 & 0.489021 \tabularnewline
24 & 0.00178 & 0.0151 & 0.493996 \tabularnewline
25 & -0.059407 & -0.5041 & 0.30787 \tabularnewline
26 & -0.003068 & -0.026 & 0.489651 \tabularnewline
27 & -0.038357 & -0.3255 & 0.372884 \tabularnewline
28 & 0.004518 & 0.0383 & 0.484764 \tabularnewline
29 & 0.009721 & 0.0825 & 0.467243 \tabularnewline
30 & -0.002665 & -0.0226 & 0.49101 \tabularnewline
31 & -0.017795 & -0.151 & 0.4402 \tabularnewline
32 & -0.011287 & -0.0958 & 0.461982 \tabularnewline
33 & -0.02631 & -0.2232 & 0.411988 \tabularnewline
34 & -0.018046 & -0.1531 & 0.439363 \tabularnewline
35 & -0.023159 & -0.1965 & 0.422381 \tabularnewline
36 & 0.049784 & 0.4224 & 0.336986 \tabularnewline
37 & -0.031667 & -0.2687 & 0.394464 \tabularnewline
38 & -0.02454 & -0.2082 & 0.41782 \tabularnewline
39 & -0.016502 & -0.14 & 0.444514 \tabularnewline
40 & -0.025833 & -0.2192 & 0.413557 \tabularnewline
41 & -0.031501 & -0.2673 & 0.395003 \tabularnewline
42 & 0.018897 & 0.1603 & 0.43653 \tabularnewline
43 & 0.012771 & 0.1084 & 0.457002 \tabularnewline
44 & 0.004302 & 0.0365 & 0.48549 \tabularnewline
45 & -0.03943 & -0.3346 & 0.36946 \tabularnewline
46 & -0.024222 & -0.2055 & 0.418867 \tabularnewline
47 & -0.024202 & -0.2054 & 0.418936 \tabularnewline
48 & -0.048172 & -0.4088 & 0.341966 \tabularnewline
49 & 0.028745 & 0.2439 & 0.403996 \tabularnewline
50 & 0.022587 & 0.1917 & 0.424274 \tabularnewline
51 & -0.008354 & -0.0709 & 0.471841 \tabularnewline
52 & 0.002311 & 0.0196 & 0.492206 \tabularnewline
53 & -0.015154 & -0.1286 & 0.449021 \tabularnewline
54 & -0.027112 & -0.2301 & 0.409351 \tabularnewline
55 & -0.019633 & -0.1666 & 0.434078 \tabularnewline
56 & 0.008794 & 0.0746 & 0.470361 \tabularnewline
57 & -0.007023 & -0.0596 & 0.476321 \tabularnewline
58 & -0.040057 & -0.3399 & 0.367463 \tabularnewline
59 & -0.043711 & -0.3709 & 0.355901 \tabularnewline
60 & -0.00575 & -0.0488 & 0.480612 \tabularnewline
\hline
\end{tabular}
%Source: https://freestatistics.org/blog/index.php?pk=33560&T=2

[TABLE]
[ROW][C]Partial Autocorrelation Function[/C][/ROW]
[ROW][C]Time lag k[/C][C]PACF(k)[/C][C]T-STAT[/C][C]P-value[/C][/ROW]
[ROW][C]1[/C][C]0.816672[/C][C]6.9297[/C][C]0[/C][/ROW]
[ROW][C]2[/C][C]-0.379946[/C][C]-3.2239[/C][C]0.000951[/C][/ROW]
[ROW][C]3[/C][C]-0.037694[/C][C]-0.3198[/C][C]0.375005[/C][/ROW]
[ROW][C]4[/C][C]0.073755[/C][C]0.6258[/C][C]0.266701[/C][/ROW]
[ROW][C]5[/C][C]0.057752[/C][C]0.49[/C][C]0.312798[/C][/ROW]
[ROW][C]6[/C][C]-0.103025[/C][C]-0.8742[/C][C]0.19246[/C][/ROW]
[ROW][C]7[/C][C]0.108525[/C][C]0.9209[/C][C]0.180097[/C][/ROW]
[ROW][C]8[/C][C]0.082215[/C][C]0.6976[/C][C]0.243831[/C][/ROW]
[ROW][C]9[/C][C]0.286033[/C][C]2.4271[/C][C]0.008862[/C][/ROW]
[ROW][C]10[/C][C]0.222909[/C][C]1.8914[/C][C]0.031294[/C][/ROW]
[ROW][C]11[/C][C]0.243631[/C][C]2.0673[/C][C]0.021152[/C][/ROW]
[ROW][C]12[/C][C]0.060917[/C][C]0.5169[/C][C]0.303407[/C][/ROW]
[ROW][C]13[/C][C]-0.578833[/C][C]-4.9116[/C][C]3e-06[/C][/ROW]
[ROW][C]14[/C][C]0.176669[/C][C]1.4991[/C][C]0.069112[/C][/ROW]
[ROW][C]15[/C][C]-0.052261[/C][C]-0.4434[/C][C]0.329386[/C][/ROW]
[ROW][C]16[/C][C]-0.114163[/C][C]-0.9687[/C][C]0.167967[/C][/ROW]
[ROW][C]17[/C][C]-0.079538[/C][C]-0.6749[/C][C]0.25095[/C][/ROW]
[ROW][C]18[/C][C]0.051626[/C][C]0.4381[/C][C]0.331326[/C][/ROW]
[ROW][C]19[/C][C]-0.061709[/C][C]-0.5236[/C][C]0.301076[/C][/ROW]
[ROW][C]20[/C][C]-0.127928[/C][C]-1.0855[/C][C]0.14066[/C][/ROW]
[ROW][C]21[/C][C]-0.011829[/C][C]-0.1004[/C][C]0.460165[/C][/ROW]
[ROW][C]22[/C][C]0.033458[/C][C]0.2839[/C][C]0.388651[/C][/ROW]
[ROW][C]23[/C][C]-0.003255[/C][C]-0.0276[/C][C]0.489021[/C][/ROW]
[ROW][C]24[/C][C]0.00178[/C][C]0.0151[/C][C]0.493996[/C][/ROW]
[ROW][C]25[/C][C]-0.059407[/C][C]-0.5041[/C][C]0.30787[/C][/ROW]
[ROW][C]26[/C][C]-0.003068[/C][C]-0.026[/C][C]0.489651[/C][/ROW]
[ROW][C]27[/C][C]-0.038357[/C][C]-0.3255[/C][C]0.372884[/C][/ROW]
[ROW][C]28[/C][C]0.004518[/C][C]0.0383[/C][C]0.484764[/C][/ROW]
[ROW][C]29[/C][C]0.009721[/C][C]0.0825[/C][C]0.467243[/C][/ROW]
[ROW][C]30[/C][C]-0.002665[/C][C]-0.0226[/C][C]0.49101[/C][/ROW]
[ROW][C]31[/C][C]-0.017795[/C][C]-0.151[/C][C]0.4402[/C][/ROW]
[ROW][C]32[/C][C]-0.011287[/C][C]-0.0958[/C][C]0.461982[/C][/ROW]
[ROW][C]33[/C][C]-0.02631[/C][C]-0.2232[/C][C]0.411988[/C][/ROW]
[ROW][C]34[/C][C]-0.018046[/C][C]-0.1531[/C][C]0.439363[/C][/ROW]
[ROW][C]35[/C][C]-0.023159[/C][C]-0.1965[/C][C]0.422381[/C][/ROW]
[ROW][C]36[/C][C]0.049784[/C][C]0.4224[/C][C]0.336986[/C][/ROW]
[ROW][C]37[/C][C]-0.031667[/C][C]-0.2687[/C][C]0.394464[/C][/ROW]
[ROW][C]38[/C][C]-0.02454[/C][C]-0.2082[/C][C]0.41782[/C][/ROW]
[ROW][C]39[/C][C]-0.016502[/C][C]-0.14[/C][C]0.444514[/C][/ROW]
[ROW][C]40[/C][C]-0.025833[/C][C]-0.2192[/C][C]0.413557[/C][/ROW]
[ROW][C]41[/C][C]-0.031501[/C][C]-0.2673[/C][C]0.395003[/C][/ROW]
[ROW][C]42[/C][C]0.018897[/C][C]0.1603[/C][C]0.43653[/C][/ROW]
[ROW][C]43[/C][C]0.012771[/C][C]0.1084[/C][C]0.457002[/C][/ROW]
[ROW][C]44[/C][C]0.004302[/C][C]0.0365[/C][C]0.48549[/C][/ROW]
[ROW][C]45[/C][C]-0.03943[/C][C]-0.3346[/C][C]0.36946[/C][/ROW]
[ROW][C]46[/C][C]-0.024222[/C][C]-0.2055[/C][C]0.418867[/C][/ROW]
[ROW][C]47[/C][C]-0.024202[/C][C]-0.2054[/C][C]0.418936[/C][/ROW]
[ROW][C]48[/C][C]-0.048172[/C][C]-0.4088[/C][C]0.341966[/C][/ROW]
[ROW][C]49[/C][C]0.028745[/C][C]0.2439[/C][C]0.403996[/C][/ROW]
[ROW][C]50[/C][C]0.022587[/C][C]0.1917[/C][C]0.424274[/C][/ROW]
[ROW][C]51[/C][C]-0.008354[/C][C]-0.0709[/C][C]0.471841[/C][/ROW]
[ROW][C]52[/C][C]0.002311[/C][C]0.0196[/C][C]0.492206[/C][/ROW]
[ROW][C]53[/C][C]-0.015154[/C][C]-0.1286[/C][C]0.449021[/C][/ROW]
[ROW][C]54[/C][C]-0.027112[/C][C]-0.2301[/C][C]0.409351[/C][/ROW]
[ROW][C]55[/C][C]-0.019633[/C][C]-0.1666[/C][C]0.434078[/C][/ROW]
[ROW][C]56[/C][C]0.008794[/C][C]0.0746[/C][C]0.470361[/C][/ROW]
[ROW][C]57[/C][C]-0.007023[/C][C]-0.0596[/C][C]0.476321[/C][/ROW]
[ROW][C]58[/C][C]-0.040057[/C][C]-0.3399[/C][C]0.367463[/C][/ROW]
[ROW][C]59[/C][C]-0.043711[/C][C]-0.3709[/C][C]0.355901[/C][/ROW]
[ROW][C]60[/C][C]-0.00575[/C][C]-0.0488[/C][C]0.480612[/C][/ROW]
[/TABLE]
Source: https://freestatistics.org/blog/index.php?pk=33560&T=2

Globally Unique Identifier (entire table): ba.freestatistics.org/blog/index.php?pk=33560&T=2

As an alternative you can also use a QR Code:  

The GUIDs for individual cells are displayed in the table below:

Partial Autocorrelation Function
Time lag kPACF(k)T-STATP-value
10.8166726.92970
2-0.379946-3.22390.000951
3-0.037694-0.31980.375005
40.0737550.62580.266701
50.0577520.490.312798
6-0.103025-0.87420.19246
70.1085250.92090.180097
80.0822150.69760.243831
90.2860332.42710.008862
100.2229091.89140.031294
110.2436312.06730.021152
120.0609170.51690.303407
13-0.578833-4.91163e-06
140.1766691.49910.069112
15-0.052261-0.44340.329386
16-0.114163-0.96870.167967
17-0.079538-0.67490.25095
180.0516260.43810.331326
19-0.061709-0.52360.301076
20-0.127928-1.08550.14066
21-0.011829-0.10040.460165
220.0334580.28390.388651
23-0.003255-0.02760.489021
240.001780.01510.493996
25-0.059407-0.50410.30787
26-0.003068-0.0260.489651
27-0.038357-0.32550.372884
280.0045180.03830.484764
290.0097210.08250.467243
30-0.002665-0.02260.49101
31-0.017795-0.1510.4402
32-0.011287-0.09580.461982
33-0.02631-0.22320.411988
34-0.018046-0.15310.439363
35-0.023159-0.19650.422381
360.0497840.42240.336986
37-0.031667-0.26870.394464
38-0.02454-0.20820.41782
39-0.016502-0.140.444514
40-0.025833-0.21920.413557
41-0.031501-0.26730.395003
420.0188970.16030.43653
430.0127710.10840.457002
440.0043020.03650.48549
45-0.03943-0.33460.36946
46-0.024222-0.20550.418867
47-0.024202-0.20540.418936
48-0.048172-0.40880.341966
490.0287450.24390.403996
500.0225870.19170.424274
51-0.008354-0.07090.471841
520.0023110.01960.492206
53-0.015154-0.12860.449021
54-0.027112-0.23010.409351
55-0.019633-0.16660.434078
560.0087940.07460.470361
57-0.007023-0.05960.476321
58-0.040057-0.33990.367463
59-0.043711-0.37090.355901
60-0.00575-0.04880.480612


Parameters (Session):
par1 = 60 ; par2 = -2.0 ; par3 = 0 ; par4 = 0 ; par5 = 12 ;
Parameters (R input):
par1 = 60 ; par2 = -2.0 ; par3 = 0 ; par4 = 0 ; par5 = 12 ;
R code (references can be found in the software module):
if (par1 == 'Default') {
par1 = 10*log10(length(x))
} else {
par1 <- as.numeric(par1)
}
par2 <- as.numeric(par2)
par3 <- as.numeric(par3)
par4 <- as.numeric(par4)
par5 <- as.numeric(par5)
if (par2 == 0) {
x <- log(x)
} else {
x <- (x ^ par2 - 1) / par2
}
if (par3 > 0) x <- diff(x,lag=1,difference=par3)
if (par4 > 0) x <- diff(x,lag=par5,difference=par4)
bitmap(file='pic1.png')
racf <- acf(x,par1,main='Autocorrelation',xlab='lags',ylab='ACF')
dev.off()
bitmap(file='pic2.png')
rpacf <- pacf(x,par1,main='Partial Autocorrelation',xlab='lags',ylab='PACF')
dev.off()
(myacf <- c(racf$acf))
(mypacf <- c(rpacf$acf))
lengthx <- length(x)
sqrtn <- sqrt(lengthx)
load(file='createtable')
a<-table.start()
a<-table.row.start(a)
a<-table.element(a,'Autocorrelation Function',4,TRUE)
a<-table.row.end(a)
a<-table.row.start(a)
a<-table.element(a,'Time lag k',header=TRUE)
a<-table.element(a,hyperlink('basics.htm','ACF(k)','click here for more information about the Autocorrelation Function'),header=TRUE)
a<-table.element(a,'T-STAT',header=TRUE)
a<-table.element(a,'P-value',header=TRUE)
a<-table.row.end(a)
for (i in 2:(par1+1)) {
a<-table.row.start(a)
a<-table.element(a,i-1,header=TRUE)
a<-table.element(a,round(myacf[i],6))
mytstat <- myacf[i]*sqrtn
a<-table.element(a,round(mytstat,4))
a<-table.element(a,round(1-pt(abs(mytstat),lengthx),6))
a<-table.row.end(a)
}
a<-table.end(a)
table.save(a,file='mytable.tab')
a<-table.start()
a<-table.row.start(a)
a<-table.element(a,'Partial Autocorrelation Function',4,TRUE)
a<-table.row.end(a)
a<-table.row.start(a)
a<-table.element(a,'Time lag k',header=TRUE)
a<-table.element(a,hyperlink('basics.htm','PACF(k)','click here for more information about the Partial Autocorrelation Function'),header=TRUE)
a<-table.element(a,'T-STAT',header=TRUE)
a<-table.element(a,'P-value',header=TRUE)
a<-table.row.end(a)
for (i in 1:par1) {
a<-table.row.start(a)
a<-table.element(a,i,header=TRUE)
a<-table.element(a,round(mypacf[i],6))
mytstat <- mypacf[i]*sqrtn
a<-table.element(a,round(mytstat,4))
a<-table.element(a,round(1-pt(abs(mytstat),lengthx),6))
a<-table.row.end(a)
}
a<-table.end(a)
table.save(a,file='mytable1.tab')