Free Statistics

of Irreproducible Research!

Author's title

Author*Unverified author*
R Software Modulerwasp_arimaforecasting.wasp
Title produced by softwareARIMA Forecasting
Date of computationSun, 14 Dec 2008 12:17:18 -0700
Cite this page as followsStatistical Computations at FreeStatistics.org, Office for Research Development and Education, URL https://freestatistics.org/blog/index.php?v=date/2008/Dec/14/t122928228278ghysqnrz0cl75.htm/, Retrieved Wed, 15 May 2024 07:13:10 +0000
Statistical Computations at FreeStatistics.org, Office for Research Development and Education, URL https://freestatistics.org/blog/index.php?pk=33541, Retrieved Wed, 15 May 2024 07:13:10 +0000
QR Codes:

Original text written by user:
IsPrivate?No (this computation is public)
User-defined keywords
Estimated Impact195
Family? (F = Feedback message, R = changed R code, M = changed R Module, P = changed Parameters, D = changed Data)
F       [ARIMA Forecasting] [paper arima forec...] [2008-12-14 19:17:18] [4940af498c7c54f3992f17142bd40069] [Current]
-   P     [ARIMA Forecasting] [Hercomputatie fee...] [2008-12-18 21:12:18] [deb3c14ac9e4607a6d84fc9d0e0e6cc2]
-   P     [ARIMA Forecasting] [paper arima forec...] [2008-12-21 19:00:35] [85134b6edb9973b9193450dd2306c65b]
Feedback Forum
2008-12-18 22:19:55 [Kim Wester] [reply
De student heeft de seasonal period ingesteld op 2, dit moet 12 zijn. Daarnaast is niet bekend of de gevonden waarden uit de ARIMA Backward Selection ook hier gebruikt zijn? Er is een herberekening gemaakt met de volgende parameters: L=1, d=1, D=1, seasonal period=12, AR/MA/SAR/SMA =0.

Herberekening:
http://www.freestatistics.org/blog/index.php?v=date/2008/Dec/18/t1229635131my4xjqj6zf017l0.htm

STAP 1
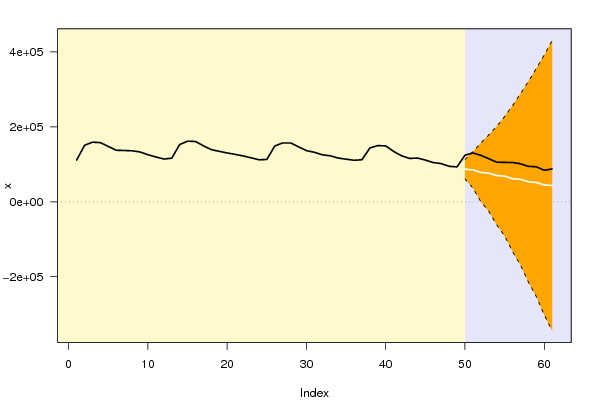
De witte lijn (voorspelling) loopt redelijk gelijk met de zwarte lijn (werkelijke waarden). Echter, het is niet duidelijk of de volledige lijn binnen het betrouwbaarheidsinterval van 95% valt. Dit kan worden gecontroleerd in de Univariate ARIMA Extrapolation Forecast tabel waarbij de Y(t) binnen de 95% LB en 95% UB moet vallen. Dit is hier wel het geval, dus in orde.
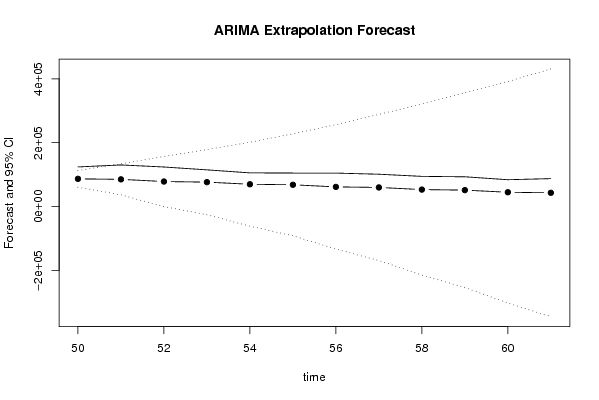
Ook in de Extrapolation Forecast lopen de lijnen redelijk gelijk en binnen het betrouwbaarheidsinterval van 95%.

STAP 2
De forecast laat een dalende trend zien, beginnend bij 124523 en eindigend met 74009. De reeks vertoond wel een sterk terugkerend patroon.

STAP 3
De standaardfout wordt steeds groter. Dit is logisch omdat de waarschijnlijkheid dat de voorspelling juist is afneemt.
Wanneer de standaardfout op 5% wordt vastgesteld kan er t/m periode 53 vooruit worden voorspeld om binnen deze 5% te vallen (0.0431).

STAP 4
Y(t-1) P(F[t]>Y[t-1]) = kans op stijging in volgende maand.
De kans dat de forecast groter is dan de vorige maand is 100%

Y(t-s) P(F[t]>Y[t-s]) = kans op stijging in zelfde maand, een jaar terug.
De kans dat de forecast groter is dan de zelfde maand een jaar terug is 1,3%

Y(51) P(F[t]>Y[51]) = kans op stijging ten opzichte van laatst gekende waarde (periode 49).
De kans dat de forecast groter is dan de laatst gekende waarde is 100%

STAP 5
Hier kan niets over gezegd worden omdat niet bekend is of de AR/MA/SAR/SMA parameters (uit ARIMA Backward Selection) juist zijn ingesteld.
2008-12-23 08:31:40 [Nathalie Boden] [reply
Hier heb ik het foute model gebruikt. Bij de arima backward selection kwamen we op een seizonaal AR1 proces uit. Dit heb ik dan ook aangepast. Het resultaat vinden we terug in deze link:
] http://www.freestatistics.org/blog/index.php?v=date/2008/Dec/21/t1229886092dkewm44dvr9umjj.htm

Daaruit kunnen we het volgende bespreken:
[19] Via deze manier gaan we een voorspelling maken van onze tijdreeks. We vullen in onze module een testing period van 12 in. Dit wil zeggen dat we de laatste 12 observaties van onze tijreeks “Niet-werkende werkzoekenden jonger dan 25 jaar” gaan afknippen

In onze tabel zien we dat F(t) staat voor de forecast. We kunnen dit gaan vergelijken met onze Yt. Bijvoorbeeld bij het tijdstip 50 zien we een gemiddeld verwacht niveau van het aantal niet-werkende werkzoekenden dat gelijk is aan 125824.1838.

LB staat voor lowerbound ( een waarschijnlijkheid van 95%). Dit is een ondergrens 121125.1472 voor het tijdstip 50. UB staat voor upperbound (een waarschijnlijkheid van 95%). Dit is een 130523.2203 voor het tijdstip 50. We zien hier dat 125824.1838 mooi tussen de lowerbound en de upperbound valt.
Deze module geldt enkel indien de omstandigheden blijven zoals ze waren. We noemen dit in economische termen “ceteris paribus”. Dit wil zeggen dat er geen sprake mag zijn van nieuwe aanslagen, oorlogen,…

De p-value (H0: Y[t] = F[t]). Dit wil zeggen dat null hypothese van de voorspelde en de werkelijke waarde niet significant afwijkend zijn van elkaar. We zien hier een waarde van 0.2398. Er bestaat een kans van 23,98% dat we ons vergissen bij het verwerpen van de hypothese. Als we een waarde hebben onder de 5% bestaat er wel een significant verschil want zo bevindt de werkelijke waarde zich dicht bij de ondergrens. In deze tijdreeks is dit niet het geval.

P(F[t]>Y[t-1]) is hier gelijk aan 1. We hebben hier 100% kans dat we een stijging gaan hebben van Y[t] 49 naar F[t] 50. Daarbij geeft P(F[t]>Y[t-s]) de stijgingskans weer van het aantal niet-werkende werkzoekenden in dezelfde maand van het jaar ervoor. De laatste kolom is een berekening van de stijgingskans ten opzichte van de laatst gekende waarde. Hoe meer we naar de toekomst kijken hoe groter de verwachte fout zal zijn.

Op de bovenstaande grafiek zien we een terugkerend patroon in onze voorspelling. De werkloosheid stijgt en daalt nadien ook terug. De waarden vallen mooi binnen het betrouwbaarheidsinterval.

In de allerlaatste grafiek van deze paper geven de stippellijnen de betrouwbaarheidsintervallen weer. De bovenste lijn stelt het voorspelde aantal niet-werkende werkzoekenden voor.
De onderste lijn stelt het werkelijke aantal niet-werkende werkzoekenden voor. We zien hier dat lag 53 net niet buiten het betrouwbaarheidsinterval ligt. We zien dat de voorspelde werkloosheid in het begin hoger ligt dan de werkelijke werkloosheid. Het valt ook op dat vanaf lag 54 de voorspelde waarde lager komt te liggen dan het werkelijke aantal niet-werkende werkzoekenden.  

Post a new message
Dataseries X:
111078
150739
159129
157928
147768
137507
136919
136151
133001
125554
119647
114158
116193
152803
161761
160942
149470
139208
134588
130322
126611
122401
117352
112135
112879
148729
157230
157221
146681
136524
132111
125326
122716
116615
113719
110737
112093
143565
149946
149147
134339
122683
115614
116566
111272
104609
101802
94542
93051
124129
130374
123946
114971
105531
104919
104782
101281
94545
93248
84031
87486


Summary of computational transaction
Raw Inputview raw input (R code)
Raw Outputview raw output of R engine
Computing time1 seconds
R Server'Gwilym Jenkins' @ 72.249.127.135

\begin{tabular}{lllllllll}
\hline
Summary of computational transaction \tabularnewline
Raw Input & view raw input (R code)  \tabularnewline
Raw Output & view raw output of R engine  \tabularnewline
Computing time & 1 seconds \tabularnewline
R Server & 'Gwilym Jenkins' @ 72.249.127.135 \tabularnewline
\hline
\end{tabular}
%Source: https://freestatistics.org/blog/index.php?pk=33541&T=0

[TABLE]
[ROW][C]Summary of computational transaction[/C][/ROW]
[ROW][C]Raw Input[/C][C]view raw input (R code) [/C][/ROW]
[ROW][C]Raw Output[/C][C]view raw output of R engine [/C][/ROW]
[ROW][C]Computing time[/C][C]1 seconds[/C][/ROW]
[ROW][C]R Server[/C][C]'Gwilym Jenkins' @ 72.249.127.135[/C][/ROW]
[/TABLE]
Source: https://freestatistics.org/blog/index.php?pk=33541&T=0

Globally Unique Identifier (entire table): ba.freestatistics.org/blog/index.php?pk=33541&T=0

As an alternative you can also use a QR Code:  

The GUIDs for individual cells are displayed in the table below:

Summary of computational transaction
Raw Inputview raw input (R code)
Raw Outputview raw output of R engine
Computing time1 seconds
R Server'Gwilym Jenkins' @ 72.249.127.135


Univariate ARIMA Extrapolation Forecast
timeY[t]F[t]95% LB95% UBp-value(H0: Y[t] = F[t])P(F[t]>Y[t-1])P(F[t]>Y[t-s])P(F[t]>Y[49])
47101802-------
4894542-------
4993051-------
5012412986850.349460714.4622112986.23660.00260.3210.2820.321
5113037485261.18936724.3708133798.00720.03420.05830.37650.3765
5212394678444.385166.5794156822.19090.12760.0970.12660.3575
5311497176559.1372-25511.6786178629.9530.23040.18140.15070.3757
5410553169901.2095-61510.9783201313.39730.29760.25070.21010.3649
5510491968262.4221-91327.3873227852.23140.32630.32360.28310.3804
5610478261659.6191-133242.9649256562.20310.33230.33180.32950.3761
5710128159921.5199-168863.2781288706.3180.36150.35040.34990.3883
589454553233.4422-214538.9633321005.84770.38120.36250.3530.3854
599324851499.7393-253420.506356419.98460.39420.3910.37450.3947
608403144859.2802-302108.1185391826.67890.41240.39230.38950.3927
618748643150.1484-344614.4942430914.7910.41130.41810.40.4004

\begin{tabular}{lllllllll}
\hline
Univariate ARIMA Extrapolation Forecast \tabularnewline
time & Y[t] & F[t] & 95% LB & 95% UB & p-value(H0: Y[t] = F[t]) & P(F[t]>Y[t-1]) & P(F[t]>Y[t-s]) & P(F[t]>Y[49]) \tabularnewline
47 & 101802 & - & - & - & - & - & - & - \tabularnewline
48 & 94542 & - & - & - & - & - & - & - \tabularnewline
49 & 93051 & - & - & - & - & - & - & - \tabularnewline
50 & 124129 & 86850.3494 & 60714.4622 & 112986.2366 & 0.0026 & 0.321 & 0.282 & 0.321 \tabularnewline
51 & 130374 & 85261.189 & 36724.3708 & 133798.0072 & 0.0342 & 0.0583 & 0.3765 & 0.3765 \tabularnewline
52 & 123946 & 78444.3851 & 66.5794 & 156822.1909 & 0.1276 & 0.097 & 0.1266 & 0.3575 \tabularnewline
53 & 114971 & 76559.1372 & -25511.6786 & 178629.953 & 0.2304 & 0.1814 & 0.1507 & 0.3757 \tabularnewline
54 & 105531 & 69901.2095 & -61510.9783 & 201313.3973 & 0.2976 & 0.2507 & 0.2101 & 0.3649 \tabularnewline
55 & 104919 & 68262.4221 & -91327.3873 & 227852.2314 & 0.3263 & 0.3236 & 0.2831 & 0.3804 \tabularnewline
56 & 104782 & 61659.6191 & -133242.9649 & 256562.2031 & 0.3323 & 0.3318 & 0.3295 & 0.3761 \tabularnewline
57 & 101281 & 59921.5199 & -168863.2781 & 288706.318 & 0.3615 & 0.3504 & 0.3499 & 0.3883 \tabularnewline
58 & 94545 & 53233.4422 & -214538.9633 & 321005.8477 & 0.3812 & 0.3625 & 0.353 & 0.3854 \tabularnewline
59 & 93248 & 51499.7393 & -253420.506 & 356419.9846 & 0.3942 & 0.391 & 0.3745 & 0.3947 \tabularnewline
60 & 84031 & 44859.2802 & -302108.1185 & 391826.6789 & 0.4124 & 0.3923 & 0.3895 & 0.3927 \tabularnewline
61 & 87486 & 43150.1484 & -344614.4942 & 430914.791 & 0.4113 & 0.4181 & 0.4 & 0.4004 \tabularnewline
\hline
\end{tabular}
%Source: https://freestatistics.org/blog/index.php?pk=33541&T=1

[TABLE]
[ROW][C]Univariate ARIMA Extrapolation Forecast[/C][/ROW]
[ROW][C]time[/C][C]Y[t][/C][C]F[t][/C][C]95% LB[/C][C]95% UB[/C][C]p-value(H0: Y[t] = F[t])[/C][C]P(F[t]>Y[t-1])[/C][C]P(F[t]>Y[t-s])[/C][C]P(F[t]>Y[49])[/C][/ROW]
[ROW][C]47[/C][C]101802[/C][C]-[/C][C]-[/C][C]-[/C][C]-[/C][C]-[/C][C]-[/C][C]-[/C][/ROW]
[ROW][C]48[/C][C]94542[/C][C]-[/C][C]-[/C][C]-[/C][C]-[/C][C]-[/C][C]-[/C][C]-[/C][/ROW]
[ROW][C]49[/C][C]93051[/C][C]-[/C][C]-[/C][C]-[/C][C]-[/C][C]-[/C][C]-[/C][C]-[/C][/ROW]
[ROW][C]50[/C][C]124129[/C][C]86850.3494[/C][C]60714.4622[/C][C]112986.2366[/C][C]0.0026[/C][C]0.321[/C][C]0.282[/C][C]0.321[/C][/ROW]
[ROW][C]51[/C][C]130374[/C][C]85261.189[/C][C]36724.3708[/C][C]133798.0072[/C][C]0.0342[/C][C]0.0583[/C][C]0.3765[/C][C]0.3765[/C][/ROW]
[ROW][C]52[/C][C]123946[/C][C]78444.3851[/C][C]66.5794[/C][C]156822.1909[/C][C]0.1276[/C][C]0.097[/C][C]0.1266[/C][C]0.3575[/C][/ROW]
[ROW][C]53[/C][C]114971[/C][C]76559.1372[/C][C]-25511.6786[/C][C]178629.953[/C][C]0.2304[/C][C]0.1814[/C][C]0.1507[/C][C]0.3757[/C][/ROW]
[ROW][C]54[/C][C]105531[/C][C]69901.2095[/C][C]-61510.9783[/C][C]201313.3973[/C][C]0.2976[/C][C]0.2507[/C][C]0.2101[/C][C]0.3649[/C][/ROW]
[ROW][C]55[/C][C]104919[/C][C]68262.4221[/C][C]-91327.3873[/C][C]227852.2314[/C][C]0.3263[/C][C]0.3236[/C][C]0.2831[/C][C]0.3804[/C][/ROW]
[ROW][C]56[/C][C]104782[/C][C]61659.6191[/C][C]-133242.9649[/C][C]256562.2031[/C][C]0.3323[/C][C]0.3318[/C][C]0.3295[/C][C]0.3761[/C][/ROW]
[ROW][C]57[/C][C]101281[/C][C]59921.5199[/C][C]-168863.2781[/C][C]288706.318[/C][C]0.3615[/C][C]0.3504[/C][C]0.3499[/C][C]0.3883[/C][/ROW]
[ROW][C]58[/C][C]94545[/C][C]53233.4422[/C][C]-214538.9633[/C][C]321005.8477[/C][C]0.3812[/C][C]0.3625[/C][C]0.353[/C][C]0.3854[/C][/ROW]
[ROW][C]59[/C][C]93248[/C][C]51499.7393[/C][C]-253420.506[/C][C]356419.9846[/C][C]0.3942[/C][C]0.391[/C][C]0.3745[/C][C]0.3947[/C][/ROW]
[ROW][C]60[/C][C]84031[/C][C]44859.2802[/C][C]-302108.1185[/C][C]391826.6789[/C][C]0.4124[/C][C]0.3923[/C][C]0.3895[/C][C]0.3927[/C][/ROW]
[ROW][C]61[/C][C]87486[/C][C]43150.1484[/C][C]-344614.4942[/C][C]430914.791[/C][C]0.4113[/C][C]0.4181[/C][C]0.4[/C][C]0.4004[/C][/ROW]
[/TABLE]
Source: https://freestatistics.org/blog/index.php?pk=33541&T=1

Globally Unique Identifier (entire table): ba.freestatistics.org/blog/index.php?pk=33541&T=1

As an alternative you can also use a QR Code:  

The GUIDs for individual cells are displayed in the table below:

Univariate ARIMA Extrapolation Forecast
timeY[t]F[t]95% LB95% UBp-value(H0: Y[t] = F[t])P(F[t]>Y[t-1])P(F[t]>Y[t-s])P(F[t]>Y[49])
47101802-------
4894542-------
4993051-------
5012412986850.349460714.4622112986.23660.00260.3210.2820.321
5113037485261.18936724.3708133798.00720.03420.05830.37650.3765
5212394678444.385166.5794156822.19090.12760.0970.12660.3575
5311497176559.1372-25511.6786178629.9530.23040.18140.15070.3757
5410553169901.2095-61510.9783201313.39730.29760.25070.21010.3649
5510491968262.4221-91327.3873227852.23140.32630.32360.28310.3804
5610478261659.6191-133242.9649256562.20310.33230.33180.32950.3761
5710128159921.5199-168863.2781288706.3180.36150.35040.34990.3883
589454553233.4422-214538.9633321005.84770.38120.36250.3530.3854
599324851499.7393-253420.506356419.98460.39420.3910.37450.3947
608403144859.2802-302108.1185391826.67890.41240.39230.38950.3927
618748643150.1484-344614.4942430914.7910.41130.41810.40.4004


Univariate ARIMA Extrapolation Forecast Performance
time% S.E.PEMAPESq.EMSERMSE
500.15350.42920.03581389697790.0991115808149.174910761.4195
510.29040.52910.04412035165715.9183169597142.993213022.9468
520.50980.580.04832070396954.8153172533079.567913135.1848
530.68020.50170.04181475471200.9622122955933.413511088.5497
540.95920.50970.04251269481970.1186105790164.176610285.4346
551.19280.5370.04471343704706.2028111975392.183610581.8426
561.61270.69940.05831859539734.2528154961644.521112448.3591
571.9480.69020.05751710606590.483142550549.206911939.4535
582.56640.7760.06471706644808.3425142220400.695211925.6195
593.02080.81060.06761742917271.4425145243105.953512051.6848
603.94620.87320.07281534423634.2825127868636.190211307.9015
614.58491.02750.08561965667734.0177163805644.501512798.6579

\begin{tabular}{lllllllll}
\hline
Univariate ARIMA Extrapolation Forecast Performance \tabularnewline
time & % S.E. & PE & MAPE & Sq.E & MSE & RMSE \tabularnewline
50 & 0.1535 & 0.4292 & 0.0358 & 1389697790.0991 & 115808149.1749 & 10761.4195 \tabularnewline
51 & 0.2904 & 0.5291 & 0.0441 & 2035165715.9183 & 169597142.9932 & 13022.9468 \tabularnewline
52 & 0.5098 & 0.58 & 0.0483 & 2070396954.8153 & 172533079.5679 & 13135.1848 \tabularnewline
53 & 0.6802 & 0.5017 & 0.0418 & 1475471200.9622 & 122955933.4135 & 11088.5497 \tabularnewline
54 & 0.9592 & 0.5097 & 0.0425 & 1269481970.1186 & 105790164.1766 & 10285.4346 \tabularnewline
55 & 1.1928 & 0.537 & 0.0447 & 1343704706.2028 & 111975392.1836 & 10581.8426 \tabularnewline
56 & 1.6127 & 0.6994 & 0.0583 & 1859539734.2528 & 154961644.5211 & 12448.3591 \tabularnewline
57 & 1.948 & 0.6902 & 0.0575 & 1710606590.483 & 142550549.2069 & 11939.4535 \tabularnewline
58 & 2.5664 & 0.776 & 0.0647 & 1706644808.3425 & 142220400.6952 & 11925.6195 \tabularnewline
59 & 3.0208 & 0.8106 & 0.0676 & 1742917271.4425 & 145243105.9535 & 12051.6848 \tabularnewline
60 & 3.9462 & 0.8732 & 0.0728 & 1534423634.2825 & 127868636.1902 & 11307.9015 \tabularnewline
61 & 4.5849 & 1.0275 & 0.0856 & 1965667734.0177 & 163805644.5015 & 12798.6579 \tabularnewline
\hline
\end{tabular}
%Source: https://freestatistics.org/blog/index.php?pk=33541&T=2

[TABLE]
[ROW][C]Univariate ARIMA Extrapolation Forecast Performance[/C][/ROW]
[ROW][C]time[/C][C]% S.E.[/C][C]PE[/C][C]MAPE[/C][C]Sq.E[/C][C]MSE[/C][C]RMSE[/C][/ROW]
[ROW][C]50[/C][C]0.1535[/C][C]0.4292[/C][C]0.0358[/C][C]1389697790.0991[/C][C]115808149.1749[/C][C]10761.4195[/C][/ROW]
[ROW][C]51[/C][C]0.2904[/C][C]0.5291[/C][C]0.0441[/C][C]2035165715.9183[/C][C]169597142.9932[/C][C]13022.9468[/C][/ROW]
[ROW][C]52[/C][C]0.5098[/C][C]0.58[/C][C]0.0483[/C][C]2070396954.8153[/C][C]172533079.5679[/C][C]13135.1848[/C][/ROW]
[ROW][C]53[/C][C]0.6802[/C][C]0.5017[/C][C]0.0418[/C][C]1475471200.9622[/C][C]122955933.4135[/C][C]11088.5497[/C][/ROW]
[ROW][C]54[/C][C]0.9592[/C][C]0.5097[/C][C]0.0425[/C][C]1269481970.1186[/C][C]105790164.1766[/C][C]10285.4346[/C][/ROW]
[ROW][C]55[/C][C]1.1928[/C][C]0.537[/C][C]0.0447[/C][C]1343704706.2028[/C][C]111975392.1836[/C][C]10581.8426[/C][/ROW]
[ROW][C]56[/C][C]1.6127[/C][C]0.6994[/C][C]0.0583[/C][C]1859539734.2528[/C][C]154961644.5211[/C][C]12448.3591[/C][/ROW]
[ROW][C]57[/C][C]1.948[/C][C]0.6902[/C][C]0.0575[/C][C]1710606590.483[/C][C]142550549.2069[/C][C]11939.4535[/C][/ROW]
[ROW][C]58[/C][C]2.5664[/C][C]0.776[/C][C]0.0647[/C][C]1706644808.3425[/C][C]142220400.6952[/C][C]11925.6195[/C][/ROW]
[ROW][C]59[/C][C]3.0208[/C][C]0.8106[/C][C]0.0676[/C][C]1742917271.4425[/C][C]145243105.9535[/C][C]12051.6848[/C][/ROW]
[ROW][C]60[/C][C]3.9462[/C][C]0.8732[/C][C]0.0728[/C][C]1534423634.2825[/C][C]127868636.1902[/C][C]11307.9015[/C][/ROW]
[ROW][C]61[/C][C]4.5849[/C][C]1.0275[/C][C]0.0856[/C][C]1965667734.0177[/C][C]163805644.5015[/C][C]12798.6579[/C][/ROW]
[/TABLE]
Source: https://freestatistics.org/blog/index.php?pk=33541&T=2

Globally Unique Identifier (entire table): ba.freestatistics.org/blog/index.php?pk=33541&T=2

As an alternative you can also use a QR Code:  

The GUIDs for individual cells are displayed in the table below:

Univariate ARIMA Extrapolation Forecast Performance
time% S.E.PEMAPESq.EMSERMSE
500.15350.42920.03581389697790.0991115808149.174910761.4195
510.29040.52910.04412035165715.9183169597142.993213022.9468
520.50980.580.04832070396954.8153172533079.567913135.1848
530.68020.50170.04181475471200.9622122955933.413511088.5497
540.95920.50970.04251269481970.1186105790164.176610285.4346
551.19280.5370.04471343704706.2028111975392.183610581.8426
561.61270.69940.05831859539734.2528154961644.521112448.3591
571.9480.69020.05751710606590.483142550549.206911939.4535
582.56640.7760.06471706644808.3425142220400.695211925.6195
593.02080.81060.06761742917271.4425145243105.953512051.6848
603.94620.87320.07281534423634.2825127868636.190211307.9015
614.58491.02750.08561965667734.0177163805644.501512798.6579


Parameters (Session):
par1 = 12 ; par2 = 1 ; par3 = 1 ; par4 = 1 ; par5 = 2 ; par6 = 2 ; par7 = 0 ; par8 = 0 ; par9 = 0 ; par10 = FALSE ;
Parameters (R input):
par1 = 12 ; par2 = 1 ; par3 = 1 ; par4 = 1 ; par5 = 2 ; par6 = 2 ; par7 = 0 ; par8 = 0 ; par9 = 0 ; par10 = FALSE ;
R code (references can be found in the software module):
par1 <- as.numeric(par1) #cut off periods
par2 <- as.numeric(par2) #lambda
par3 <- as.numeric(par3) #degree of non-seasonal differencing
par4 <- as.numeric(par4) #degree of seasonal differencing
par5 <- as.numeric(par5) #seasonal period
par6 <- as.numeric(par6) #p
par7 <- as.numeric(par7) #q
par8 <- as.numeric(par8) #P
par9 <- as.numeric(par9) #Q
if (par10 == 'TRUE') par10 <- TRUE
if (par10 == 'FALSE') par10 <- FALSE
if (par2 == 0) x <- log(x)
if (par2 != 0) x <- x^par2
lx <- length(x)
first <- lx - 2*par1
nx <- lx - par1
nx1 <- nx + 1
fx <- lx - nx
if (fx < 1) {
fx <- par5
nx1 <- lx + fx - 1
first <- lx - 2*fx
}
first <- 1
if (fx < 3) fx <- round(lx/10,0)
(arima.out <- arima(x[1:nx], order=c(par6,par3,par7), seasonal=list(order=c(par8,par4,par9), period=par5), include.mean=par10, method='ML'))
(forecast <- predict(arima.out,fx))
(lb <- forecast$pred - 1.96 * forecast$se)
(ub <- forecast$pred + 1.96 * forecast$se)
if (par2 == 0) {
x <- exp(x)
forecast$pred <- exp(forecast$pred)
lb <- exp(lb)
ub <- exp(ub)
}
if (par2 != 0) {
x <- x^(1/par2)
forecast$pred <- forecast$pred^(1/par2)
lb <- lb^(1/par2)
ub <- ub^(1/par2)
}
if (par2 < 0) {
olb <- lb
lb <- ub
ub <- olb
}
(actandfor <- c(x[1:nx], forecast$pred))
(perc.se <- (ub-forecast$pred)/1.96/forecast$pred)
bitmap(file='test1.png')
opar <- par(mar=c(4,4,2,2),las=1)
ylim <- c( min(x[first:nx],lb), max(x[first:nx],ub))
plot(x,ylim=ylim,type='n',xlim=c(first,lx))
usr <- par('usr')
rect(usr[1],usr[3],nx+1,usr[4],border=NA,col='lemonchiffon')
rect(nx1,usr[3],usr[2],usr[4],border=NA,col='lavender')
abline(h= (-3:3)*2 , col ='gray', lty =3)
polygon( c(nx1:lx,lx:nx1), c(lb,rev(ub)), col = 'orange', lty=2,border=NA)
lines(nx1:lx, lb , lty=2)
lines(nx1:lx, ub , lty=2)
lines(x, lwd=2)
lines(nx1:lx, forecast$pred , lwd=2 , col ='white')
box()
par(opar)
dev.off()
prob.dec <- array(NA, dim=fx)
prob.sdec <- array(NA, dim=fx)
prob.ldec <- array(NA, dim=fx)
prob.pval <- array(NA, dim=fx)
perf.pe <- array(0, dim=fx)
perf.mape <- array(0, dim=fx)
perf.se <- array(0, dim=fx)
perf.mse <- array(0, dim=fx)
perf.rmse <- array(0, dim=fx)
for (i in 1:fx) {
locSD <- (ub[i] - forecast$pred[i]) / 1.96
perf.pe[i] = (x[nx+i] - forecast$pred[i]) / forecast$pred[i]
perf.mape[i] = perf.mape[i] + abs(perf.pe[i])
perf.se[i] = (x[nx+i] - forecast$pred[i])^2
perf.mse[i] = perf.mse[i] + perf.se[i]
prob.dec[i] = pnorm((x[nx+i-1] - forecast$pred[i]) / locSD)
prob.sdec[i] = pnorm((x[nx+i-par5] - forecast$pred[i]) / locSD)
prob.ldec[i] = pnorm((x[nx] - forecast$pred[i]) / locSD)
prob.pval[i] = pnorm(abs(x[nx+i] - forecast$pred[i]) / locSD)
}
perf.mape = perf.mape / fx
perf.mse = perf.mse / fx
perf.rmse = sqrt(perf.mse)
bitmap(file='test2.png')
plot(forecast$pred, pch=19, type='b',main='ARIMA Extrapolation Forecast', ylab='Forecast and 95% CI', xlab='time',ylim=c(min(lb),max(ub)))
dum <- forecast$pred
dum[1:12] <- x[(nx+1):lx]
lines(dum, lty=1)
lines(ub,lty=3)
lines(lb,lty=3)
dev.off()
load(file='createtable')
a<-table.start()
a<-table.row.start(a)
a<-table.element(a,'Univariate ARIMA Extrapolation Forecast',9,TRUE)
a<-table.row.end(a)
a<-table.row.start(a)
a<-table.element(a,'time',1,header=TRUE)
a<-table.element(a,'Y[t]',1,header=TRUE)
a<-table.element(a,'F[t]',1,header=TRUE)
a<-table.element(a,'95% LB',1,header=TRUE)
a<-table.element(a,'95% UB',1,header=TRUE)
a<-table.element(a,'p-value
(H0: Y[t] = F[t])',1,header=TRUE)
a<-table.element(a,'P(F[t]>Y[t-1])',1,header=TRUE)
a<-table.element(a,'P(F[t]>Y[t-s])',1,header=TRUE)
mylab <- paste('P(F[t]>Y[',nx,sep='')
mylab <- paste(mylab,'])',sep='')
a<-table.element(a,mylab,1,header=TRUE)
a<-table.row.end(a)
for (i in (nx-par5):nx) {
a<-table.row.start(a)
a<-table.element(a,i,header=TRUE)
a<-table.element(a,x[i])
a<-table.element(a,'-')
a<-table.row.end(a)
}
for (i in 1:fx) {
a<-table.row.start(a)
a<-table.element(a,nx+i,header=TRUE)
a<-table.element(a,round(x[nx+i],4))
a<-table.element(a,round(forecast$pred[i],4))
a<-table.element(a,round(lb[i],4))
a<-table.element(a,round(ub[i],4))
a<-table.element(a,round((1-prob.pval[i]),4))
a<-table.element(a,round((1-prob.dec[i]),4))
a<-table.element(a,round((1-prob.sdec[i]),4))
a<-table.element(a,round((1-prob.ldec[i]),4))
a<-table.row.end(a)
}
a<-table.end(a)
table.save(a,file='mytable.tab')
a<-table.start()
a<-table.row.start(a)
a<-table.element(a,'Univariate ARIMA Extrapolation Forecast Performance',7,TRUE)
a<-table.row.end(a)
a<-table.row.start(a)
a<-table.element(a,'time',1,header=TRUE)
a<-table.element(a,'% S.E.',1,header=TRUE)
a<-table.element(a,'PE',1,header=TRUE)
a<-table.element(a,'MAPE',1,header=TRUE)
a<-table.element(a,'Sq.E',1,header=TRUE)
a<-table.element(a,'MSE',1,header=TRUE)
a<-table.element(a,'RMSE',1,header=TRUE)
a<-table.row.end(a)
for (i in 1:fx) {
a<-table.row.start(a)
a<-table.element(a,nx+i,header=TRUE)
a<-table.element(a,round(perc.se[i],4))
a<-table.element(a,round(perf.pe[i],4))
a<-table.element(a,round(perf.mape[i],4))
a<-table.element(a,round(perf.se[i],4))
a<-table.element(a,round(perf.mse[i],4))
a<-table.element(a,round(perf.rmse[i],4))
a<-table.row.end(a)
}
a<-table.end(a)
table.save(a,file='mytable1.tab')