Free Statistics

of Irreproducible Research!

Author's title

Author*The author of this computation has been verified*
R Software Modulerwasp_arimaforecasting.wasp
Title produced by softwareARIMA Forecasting
Date of computationSun, 14 Dec 2008 11:02:13 -0700
Cite this page as followsStatistical Computations at FreeStatistics.org, Office for Research Development and Education, URL https://freestatistics.org/blog/index.php?v=date/2008/Dec/14/t1229277829fh0qq3ovyx25pzq.htm/, Retrieved Wed, 15 May 2024 00:20:42 +0000
Statistical Computations at FreeStatistics.org, Office for Research Development and Education, URL https://freestatistics.org/blog/index.php?pk=33514, Retrieved Wed, 15 May 2024 00:20:42 +0000
QR Codes:

Original text written by user:
IsPrivate?No (this computation is public)
User-defined keywords
Estimated Impact192
Family? (F = Feedback message, R = changed R code, M = changed R Module, P = changed Parameters, D = changed Data)
-     [ARIMA Backward Selection] [ARMA backward sel...] [2007-12-20 15:28:14] [74be16979710d4c4e7c6647856088456]
- RMPD  [ARIMA Forecasting] [forecasting] [2008-01-07 19:49:31] [74be16979710d4c4e7c6647856088456]
-   PD      [ARIMA Forecasting] [werkloosheid] [2008-12-14 18:02:13] [5925747fb2a6bb4cfcd8015825ee5e92] [Current]
Feedback Forum

Post a new message
Dataseries X:
180144
173666
165688
161570
156145
153730
182698
200765
176512
166618
158644
159585
163095
159044
155511
153745
150569
150605
179612
194690
189917
184128
175335
179566
181140
177876
175041
169292
166070
166972
206348
215706
202108
195411
193111
195198
198770
194163
190420
189733
186029
191531
232571
243477
227247
217859
208679
213188
216234
213586
209465
204045
200237
203666
241476
260307
243324
244460
233575
237217
235243
230354
227184
221678
217142
219452
256446
265845
248624
241114
229245
231805
219277
219313
212610
214771
211142
211457
240048
240636
230580
208795
197922
194596


Summary of computational transaction
Raw Inputview raw input (R code)
Raw Outputview raw output of R engine
Computing time1 seconds
R Server'Gwilym Jenkins' @ 72.249.127.135

\begin{tabular}{lllllllll}
\hline
Summary of computational transaction \tabularnewline
Raw Input & view raw input (R code)  \tabularnewline
Raw Output & view raw output of R engine  \tabularnewline
Computing time & 1 seconds \tabularnewline
R Server & 'Gwilym Jenkins' @ 72.249.127.135 \tabularnewline
\hline
\end{tabular}
%Source: https://freestatistics.org/blog/index.php?pk=33514&T=0

[TABLE]
[ROW][C]Summary of computational transaction[/C][/ROW]
[ROW][C]Raw Input[/C][C]view raw input (R code) [/C][/ROW]
[ROW][C]Raw Output[/C][C]view raw output of R engine [/C][/ROW]
[ROW][C]Computing time[/C][C]1 seconds[/C][/ROW]
[ROW][C]R Server[/C][C]'Gwilym Jenkins' @ 72.249.127.135[/C][/ROW]
[/TABLE]
Source: https://freestatistics.org/blog/index.php?pk=33514&T=0

Globally Unique Identifier (entire table): ba.freestatistics.org/blog/index.php?pk=33514&T=0

As an alternative you can also use a QR Code:  

The GUIDs for individual cells are displayed in the table below:

Summary of computational transaction
Raw Inputview raw input (R code)
Raw Outputview raw output of R engine
Computing time1 seconds
R Server'Gwilym Jenkins' @ 72.249.127.135


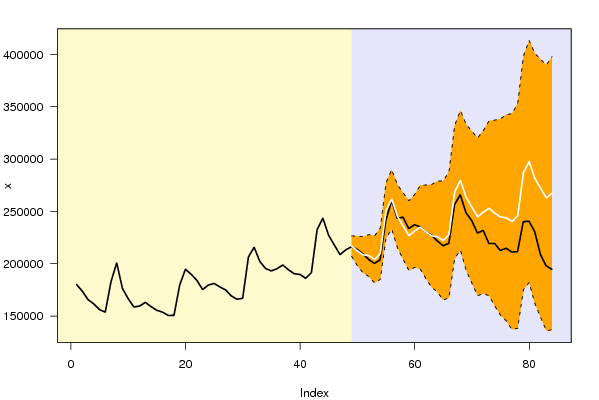
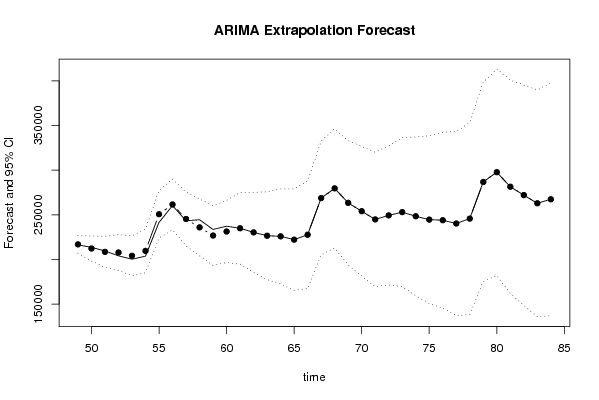
Univariate ARIMA Extrapolation Forecast
timeY[t]F[t]95% LB95% UBp-value(H0: Y[t] = F[t])P(F[t]>Y[t-1])P(F[t]>Y[t-s])P(F[t]>Y[48])
36195198-------
37198770-------
38194163-------
39190420-------
40189733-------
41186029-------
42191531-------
43232571-------
44243477-------
45227247-------
46217859-------
47208679-------
48213188-------
49216234216831.5318207050.9225226612.14110.45230.76740.99990.7674
50213586212226.6444198189.0316226264.25730.42470.28790.99420.4466
51209465208483.7068191203.0611225764.35250.45570.28140.97980.2968
52204045207796.7086187791.9108227801.50650.35660.43510.96160.2987
53200237204092.7087181692.6349226492.78250.36790.50170.9430.2131
54203666209594.7087185031.8367234157.58070.31810.77240.92530.3872
55241476250634.7087224084.6418277184.77560.24950.99970.90880.9971
56260307261540.7087233142.1625289939.25490.46610.91690.89370.9996
57243324245310.7087215176.8606275444.55680.44860.16470.880.9817
58244460235922.7087204148.1878267697.22960.29920.3240.86740.9196
59233575226742.7087193408.1688260077.24860.34390.14880.85590.7873
60237217231251.7087196426.9628266076.45460.36850.4480.84530.8453
61235243234895.2405194806.1184274984.36260.49320.45480.81920.8557
62230354230290.3531185423.1168275157.58950.49890.41440.76720.7725
63227184226547.4155177360.5887275734.24230.48990.43970.7520.7028
64221678225860.4173172703.7704279017.06430.43870.48050.78940.6798
65217142222156.4174165306.4868279006.3480.43140.50660.77510.6214
66219452227658.4174167340.9232287975.91160.39490.63370.78220.6809
67256446268698.4174205102.1471332294.68770.35290.93550.79930.9564
68265845279604.4174212890.3177346318.51710.3430.75190.71460.9745
69248624263374.4174193681.831333067.00380.33910.47230.71360.9209
70241114253986.4174181437.5229326535.31190.3640.55760.60160.8648
71229245244806.4174169509.4879320103.34690.34270.53830.6150.7948
72231805249315.4174171367.2738327263.5610.32990.69310.61950.8182
73219277252958.9492169459.5774336458.3210.21460.69020.66120.8247
74219313248354.0618159552.2828337155.84080.26080.73950.65440.7812
75212610244611.1242150803.4346338418.81380.25190.70140.64210.7443
76214771243924.1261145364.375342483.87710.2810.73330.67090.7295
77211142240220.1261137127.125343313.12720.29020.68570.66960.6964
78211457245722.1261138286.9864353157.26590.26590.73590.68410.7236
79240048286762.1261175153.6514398370.60080.2060.9070.70280.9018
80240636297668.1261182036.8415413299.41080.16680.83560.70520.9239
81230580281438.1261161919.3562400956.8960.20210.74830.70480.8685
82208795272050.1261148766.3935395333.85870.15730.74510.68860.8253
83197922262870.1261135933.0508389807.20150.1580.79810.69820.7785
84194596267379.1261136890.9524397867.29980.13710.85160.70340.7922

\begin{tabular}{lllllllll}
\hline
Univariate ARIMA Extrapolation Forecast \tabularnewline
time & Y[t] & F[t] & 95% LB & 95% UB & p-value(H0: Y[t] = F[t]) & P(F[t]>Y[t-1]) & P(F[t]>Y[t-s]) & P(F[t]>Y[48]) \tabularnewline
36 & 195198 & - & - & - & - & - & - & - \tabularnewline
37 & 198770 & - & - & - & - & - & - & - \tabularnewline
38 & 194163 & - & - & - & - & - & - & - \tabularnewline
39 & 190420 & - & - & - & - & - & - & - \tabularnewline
40 & 189733 & - & - & - & - & - & - & - \tabularnewline
41 & 186029 & - & - & - & - & - & - & - \tabularnewline
42 & 191531 & - & - & - & - & - & - & - \tabularnewline
43 & 232571 & - & - & - & - & - & - & - \tabularnewline
44 & 243477 & - & - & - & - & - & - & - \tabularnewline
45 & 227247 & - & - & - & - & - & - & - \tabularnewline
46 & 217859 & - & - & - & - & - & - & - \tabularnewline
47 & 208679 & - & - & - & - & - & - & - \tabularnewline
48 & 213188 & - & - & - & - & - & - & - \tabularnewline
49 & 216234 & 216831.5318 & 207050.9225 & 226612.1411 & 0.4523 & 0.7674 & 0.9999 & 0.7674 \tabularnewline
50 & 213586 & 212226.6444 & 198189.0316 & 226264.2573 & 0.4247 & 0.2879 & 0.9942 & 0.4466 \tabularnewline
51 & 209465 & 208483.7068 & 191203.0611 & 225764.3525 & 0.4557 & 0.2814 & 0.9798 & 0.2968 \tabularnewline
52 & 204045 & 207796.7086 & 187791.9108 & 227801.5065 & 0.3566 & 0.4351 & 0.9616 & 0.2987 \tabularnewline
53 & 200237 & 204092.7087 & 181692.6349 & 226492.7825 & 0.3679 & 0.5017 & 0.943 & 0.2131 \tabularnewline
54 & 203666 & 209594.7087 & 185031.8367 & 234157.5807 & 0.3181 & 0.7724 & 0.9253 & 0.3872 \tabularnewline
55 & 241476 & 250634.7087 & 224084.6418 & 277184.7756 & 0.2495 & 0.9997 & 0.9088 & 0.9971 \tabularnewline
56 & 260307 & 261540.7087 & 233142.1625 & 289939.2549 & 0.4661 & 0.9169 & 0.8937 & 0.9996 \tabularnewline
57 & 243324 & 245310.7087 & 215176.8606 & 275444.5568 & 0.4486 & 0.1647 & 0.88 & 0.9817 \tabularnewline
58 & 244460 & 235922.7087 & 204148.1878 & 267697.2296 & 0.2992 & 0.324 & 0.8674 & 0.9196 \tabularnewline
59 & 233575 & 226742.7087 & 193408.1688 & 260077.2486 & 0.3439 & 0.1488 & 0.8559 & 0.7873 \tabularnewline
60 & 237217 & 231251.7087 & 196426.9628 & 266076.4546 & 0.3685 & 0.448 & 0.8453 & 0.8453 \tabularnewline
61 & 235243 & 234895.2405 & 194806.1184 & 274984.3626 & 0.4932 & 0.4548 & 0.8192 & 0.8557 \tabularnewline
62 & 230354 & 230290.3531 & 185423.1168 & 275157.5895 & 0.4989 & 0.4144 & 0.7672 & 0.7725 \tabularnewline
63 & 227184 & 226547.4155 & 177360.5887 & 275734.2423 & 0.4899 & 0.4397 & 0.752 & 0.7028 \tabularnewline
64 & 221678 & 225860.4173 & 172703.7704 & 279017.0643 & 0.4387 & 0.4805 & 0.7894 & 0.6798 \tabularnewline
65 & 217142 & 222156.4174 & 165306.4868 & 279006.348 & 0.4314 & 0.5066 & 0.7751 & 0.6214 \tabularnewline
66 & 219452 & 227658.4174 & 167340.9232 & 287975.9116 & 0.3949 & 0.6337 & 0.7822 & 0.6809 \tabularnewline
67 & 256446 & 268698.4174 & 205102.1471 & 332294.6877 & 0.3529 & 0.9355 & 0.7993 & 0.9564 \tabularnewline
68 & 265845 & 279604.4174 & 212890.3177 & 346318.5171 & 0.343 & 0.7519 & 0.7146 & 0.9745 \tabularnewline
69 & 248624 & 263374.4174 & 193681.831 & 333067.0038 & 0.3391 & 0.4723 & 0.7136 & 0.9209 \tabularnewline
70 & 241114 & 253986.4174 & 181437.5229 & 326535.3119 & 0.364 & 0.5576 & 0.6016 & 0.8648 \tabularnewline
71 & 229245 & 244806.4174 & 169509.4879 & 320103.3469 & 0.3427 & 0.5383 & 0.615 & 0.7948 \tabularnewline
72 & 231805 & 249315.4174 & 171367.2738 & 327263.561 & 0.3299 & 0.6931 & 0.6195 & 0.8182 \tabularnewline
73 & 219277 & 252958.9492 & 169459.5774 & 336458.321 & 0.2146 & 0.6902 & 0.6612 & 0.8247 \tabularnewline
74 & 219313 & 248354.0618 & 159552.2828 & 337155.8408 & 0.2608 & 0.7395 & 0.6544 & 0.7812 \tabularnewline
75 & 212610 & 244611.1242 & 150803.4346 & 338418.8138 & 0.2519 & 0.7014 & 0.6421 & 0.7443 \tabularnewline
76 & 214771 & 243924.1261 & 145364.375 & 342483.8771 & 0.281 & 0.7333 & 0.6709 & 0.7295 \tabularnewline
77 & 211142 & 240220.1261 & 137127.125 & 343313.1272 & 0.2902 & 0.6857 & 0.6696 & 0.6964 \tabularnewline
78 & 211457 & 245722.1261 & 138286.9864 & 353157.2659 & 0.2659 & 0.7359 & 0.6841 & 0.7236 \tabularnewline
79 & 240048 & 286762.1261 & 175153.6514 & 398370.6008 & 0.206 & 0.907 & 0.7028 & 0.9018 \tabularnewline
80 & 240636 & 297668.1261 & 182036.8415 & 413299.4108 & 0.1668 & 0.8356 & 0.7052 & 0.9239 \tabularnewline
81 & 230580 & 281438.1261 & 161919.3562 & 400956.896 & 0.2021 & 0.7483 & 0.7048 & 0.8685 \tabularnewline
82 & 208795 & 272050.1261 & 148766.3935 & 395333.8587 & 0.1573 & 0.7451 & 0.6886 & 0.8253 \tabularnewline
83 & 197922 & 262870.1261 & 135933.0508 & 389807.2015 & 0.158 & 0.7981 & 0.6982 & 0.7785 \tabularnewline
84 & 194596 & 267379.1261 & 136890.9524 & 397867.2998 & 0.1371 & 0.8516 & 0.7034 & 0.7922 \tabularnewline
\hline
\end{tabular}
%Source: https://freestatistics.org/blog/index.php?pk=33514&T=1

[TABLE]
[ROW][C]Univariate ARIMA Extrapolation Forecast[/C][/ROW]
[ROW][C]time[/C][C]Y[t][/C][C]F[t][/C][C]95% LB[/C][C]95% UB[/C][C]p-value(H0: Y[t] = F[t])[/C][C]P(F[t]>Y[t-1])[/C][C]P(F[t]>Y[t-s])[/C][C]P(F[t]>Y[48])[/C][/ROW]
[ROW][C]36[/C][C]195198[/C][C]-[/C][C]-[/C][C]-[/C][C]-[/C][C]-[/C][C]-[/C][C]-[/C][/ROW]
[ROW][C]37[/C][C]198770[/C][C]-[/C][C]-[/C][C]-[/C][C]-[/C][C]-[/C][C]-[/C][C]-[/C][/ROW]
[ROW][C]38[/C][C]194163[/C][C]-[/C][C]-[/C][C]-[/C][C]-[/C][C]-[/C][C]-[/C][C]-[/C][/ROW]
[ROW][C]39[/C][C]190420[/C][C]-[/C][C]-[/C][C]-[/C][C]-[/C][C]-[/C][C]-[/C][C]-[/C][/ROW]
[ROW][C]40[/C][C]189733[/C][C]-[/C][C]-[/C][C]-[/C][C]-[/C][C]-[/C][C]-[/C][C]-[/C][/ROW]
[ROW][C]41[/C][C]186029[/C][C]-[/C][C]-[/C][C]-[/C][C]-[/C][C]-[/C][C]-[/C][C]-[/C][/ROW]
[ROW][C]42[/C][C]191531[/C][C]-[/C][C]-[/C][C]-[/C][C]-[/C][C]-[/C][C]-[/C][C]-[/C][/ROW]
[ROW][C]43[/C][C]232571[/C][C]-[/C][C]-[/C][C]-[/C][C]-[/C][C]-[/C][C]-[/C][C]-[/C][/ROW]
[ROW][C]44[/C][C]243477[/C][C]-[/C][C]-[/C][C]-[/C][C]-[/C][C]-[/C][C]-[/C][C]-[/C][/ROW]
[ROW][C]45[/C][C]227247[/C][C]-[/C][C]-[/C][C]-[/C][C]-[/C][C]-[/C][C]-[/C][C]-[/C][/ROW]
[ROW][C]46[/C][C]217859[/C][C]-[/C][C]-[/C][C]-[/C][C]-[/C][C]-[/C][C]-[/C][C]-[/C][/ROW]
[ROW][C]47[/C][C]208679[/C][C]-[/C][C]-[/C][C]-[/C][C]-[/C][C]-[/C][C]-[/C][C]-[/C][/ROW]
[ROW][C]48[/C][C]213188[/C][C]-[/C][C]-[/C][C]-[/C][C]-[/C][C]-[/C][C]-[/C][C]-[/C][/ROW]
[ROW][C]49[/C][C]216234[/C][C]216831.5318[/C][C]207050.9225[/C][C]226612.1411[/C][C]0.4523[/C][C]0.7674[/C][C]0.9999[/C][C]0.7674[/C][/ROW]
[ROW][C]50[/C][C]213586[/C][C]212226.6444[/C][C]198189.0316[/C][C]226264.2573[/C][C]0.4247[/C][C]0.2879[/C][C]0.9942[/C][C]0.4466[/C][/ROW]
[ROW][C]51[/C][C]209465[/C][C]208483.7068[/C][C]191203.0611[/C][C]225764.3525[/C][C]0.4557[/C][C]0.2814[/C][C]0.9798[/C][C]0.2968[/C][/ROW]
[ROW][C]52[/C][C]204045[/C][C]207796.7086[/C][C]187791.9108[/C][C]227801.5065[/C][C]0.3566[/C][C]0.4351[/C][C]0.9616[/C][C]0.2987[/C][/ROW]
[ROW][C]53[/C][C]200237[/C][C]204092.7087[/C][C]181692.6349[/C][C]226492.7825[/C][C]0.3679[/C][C]0.5017[/C][C]0.943[/C][C]0.2131[/C][/ROW]
[ROW][C]54[/C][C]203666[/C][C]209594.7087[/C][C]185031.8367[/C][C]234157.5807[/C][C]0.3181[/C][C]0.7724[/C][C]0.9253[/C][C]0.3872[/C][/ROW]
[ROW][C]55[/C][C]241476[/C][C]250634.7087[/C][C]224084.6418[/C][C]277184.7756[/C][C]0.2495[/C][C]0.9997[/C][C]0.9088[/C][C]0.9971[/C][/ROW]
[ROW][C]56[/C][C]260307[/C][C]261540.7087[/C][C]233142.1625[/C][C]289939.2549[/C][C]0.4661[/C][C]0.9169[/C][C]0.8937[/C][C]0.9996[/C][/ROW]
[ROW][C]57[/C][C]243324[/C][C]245310.7087[/C][C]215176.8606[/C][C]275444.5568[/C][C]0.4486[/C][C]0.1647[/C][C]0.88[/C][C]0.9817[/C][/ROW]
[ROW][C]58[/C][C]244460[/C][C]235922.7087[/C][C]204148.1878[/C][C]267697.2296[/C][C]0.2992[/C][C]0.324[/C][C]0.8674[/C][C]0.9196[/C][/ROW]
[ROW][C]59[/C][C]233575[/C][C]226742.7087[/C][C]193408.1688[/C][C]260077.2486[/C][C]0.3439[/C][C]0.1488[/C][C]0.8559[/C][C]0.7873[/C][/ROW]
[ROW][C]60[/C][C]237217[/C][C]231251.7087[/C][C]196426.9628[/C][C]266076.4546[/C][C]0.3685[/C][C]0.448[/C][C]0.8453[/C][C]0.8453[/C][/ROW]
[ROW][C]61[/C][C]235243[/C][C]234895.2405[/C][C]194806.1184[/C][C]274984.3626[/C][C]0.4932[/C][C]0.4548[/C][C]0.8192[/C][C]0.8557[/C][/ROW]
[ROW][C]62[/C][C]230354[/C][C]230290.3531[/C][C]185423.1168[/C][C]275157.5895[/C][C]0.4989[/C][C]0.4144[/C][C]0.7672[/C][C]0.7725[/C][/ROW]
[ROW][C]63[/C][C]227184[/C][C]226547.4155[/C][C]177360.5887[/C][C]275734.2423[/C][C]0.4899[/C][C]0.4397[/C][C]0.752[/C][C]0.7028[/C][/ROW]
[ROW][C]64[/C][C]221678[/C][C]225860.4173[/C][C]172703.7704[/C][C]279017.0643[/C][C]0.4387[/C][C]0.4805[/C][C]0.7894[/C][C]0.6798[/C][/ROW]
[ROW][C]65[/C][C]217142[/C][C]222156.4174[/C][C]165306.4868[/C][C]279006.348[/C][C]0.4314[/C][C]0.5066[/C][C]0.7751[/C][C]0.6214[/C][/ROW]
[ROW][C]66[/C][C]219452[/C][C]227658.4174[/C][C]167340.9232[/C][C]287975.9116[/C][C]0.3949[/C][C]0.6337[/C][C]0.7822[/C][C]0.6809[/C][/ROW]
[ROW][C]67[/C][C]256446[/C][C]268698.4174[/C][C]205102.1471[/C][C]332294.6877[/C][C]0.3529[/C][C]0.9355[/C][C]0.7993[/C][C]0.9564[/C][/ROW]
[ROW][C]68[/C][C]265845[/C][C]279604.4174[/C][C]212890.3177[/C][C]346318.5171[/C][C]0.343[/C][C]0.7519[/C][C]0.7146[/C][C]0.9745[/C][/ROW]
[ROW][C]69[/C][C]248624[/C][C]263374.4174[/C][C]193681.831[/C][C]333067.0038[/C][C]0.3391[/C][C]0.4723[/C][C]0.7136[/C][C]0.9209[/C][/ROW]
[ROW][C]70[/C][C]241114[/C][C]253986.4174[/C][C]181437.5229[/C][C]326535.3119[/C][C]0.364[/C][C]0.5576[/C][C]0.6016[/C][C]0.8648[/C][/ROW]
[ROW][C]71[/C][C]229245[/C][C]244806.4174[/C][C]169509.4879[/C][C]320103.3469[/C][C]0.3427[/C][C]0.5383[/C][C]0.615[/C][C]0.7948[/C][/ROW]
[ROW][C]72[/C][C]231805[/C][C]249315.4174[/C][C]171367.2738[/C][C]327263.561[/C][C]0.3299[/C][C]0.6931[/C][C]0.6195[/C][C]0.8182[/C][/ROW]
[ROW][C]73[/C][C]219277[/C][C]252958.9492[/C][C]169459.5774[/C][C]336458.321[/C][C]0.2146[/C][C]0.6902[/C][C]0.6612[/C][C]0.8247[/C][/ROW]
[ROW][C]74[/C][C]219313[/C][C]248354.0618[/C][C]159552.2828[/C][C]337155.8408[/C][C]0.2608[/C][C]0.7395[/C][C]0.6544[/C][C]0.7812[/C][/ROW]
[ROW][C]75[/C][C]212610[/C][C]244611.1242[/C][C]150803.4346[/C][C]338418.8138[/C][C]0.2519[/C][C]0.7014[/C][C]0.6421[/C][C]0.7443[/C][/ROW]
[ROW][C]76[/C][C]214771[/C][C]243924.1261[/C][C]145364.375[/C][C]342483.8771[/C][C]0.281[/C][C]0.7333[/C][C]0.6709[/C][C]0.7295[/C][/ROW]
[ROW][C]77[/C][C]211142[/C][C]240220.1261[/C][C]137127.125[/C][C]343313.1272[/C][C]0.2902[/C][C]0.6857[/C][C]0.6696[/C][C]0.6964[/C][/ROW]
[ROW][C]78[/C][C]211457[/C][C]245722.1261[/C][C]138286.9864[/C][C]353157.2659[/C][C]0.2659[/C][C]0.7359[/C][C]0.6841[/C][C]0.7236[/C][/ROW]
[ROW][C]79[/C][C]240048[/C][C]286762.1261[/C][C]175153.6514[/C][C]398370.6008[/C][C]0.206[/C][C]0.907[/C][C]0.7028[/C][C]0.9018[/C][/ROW]
[ROW][C]80[/C][C]240636[/C][C]297668.1261[/C][C]182036.8415[/C][C]413299.4108[/C][C]0.1668[/C][C]0.8356[/C][C]0.7052[/C][C]0.9239[/C][/ROW]
[ROW][C]81[/C][C]230580[/C][C]281438.1261[/C][C]161919.3562[/C][C]400956.896[/C][C]0.2021[/C][C]0.7483[/C][C]0.7048[/C][C]0.8685[/C][/ROW]
[ROW][C]82[/C][C]208795[/C][C]272050.1261[/C][C]148766.3935[/C][C]395333.8587[/C][C]0.1573[/C][C]0.7451[/C][C]0.6886[/C][C]0.8253[/C][/ROW]
[ROW][C]83[/C][C]197922[/C][C]262870.1261[/C][C]135933.0508[/C][C]389807.2015[/C][C]0.158[/C][C]0.7981[/C][C]0.6982[/C][C]0.7785[/C][/ROW]
[ROW][C]84[/C][C]194596[/C][C]267379.1261[/C][C]136890.9524[/C][C]397867.2998[/C][C]0.1371[/C][C]0.8516[/C][C]0.7034[/C][C]0.7922[/C][/ROW]
[/TABLE]
Source: https://freestatistics.org/blog/index.php?pk=33514&T=1

Globally Unique Identifier (entire table): ba.freestatistics.org/blog/index.php?pk=33514&T=1

As an alternative you can also use a QR Code:  

The GUIDs for individual cells are displayed in the table below:

Univariate ARIMA Extrapolation Forecast
timeY[t]F[t]95% LB95% UBp-value(H0: Y[t] = F[t])P(F[t]>Y[t-1])P(F[t]>Y[t-s])P(F[t]>Y[48])
36195198-------
37198770-------
38194163-------
39190420-------
40189733-------
41186029-------
42191531-------
43232571-------
44243477-------
45227247-------
46217859-------
47208679-------
48213188-------
49216234216831.5318207050.9225226612.14110.45230.76740.99990.7674
50213586212226.6444198189.0316226264.25730.42470.28790.99420.4466
51209465208483.7068191203.0611225764.35250.45570.28140.97980.2968
52204045207796.7086187791.9108227801.50650.35660.43510.96160.2987
53200237204092.7087181692.6349226492.78250.36790.50170.9430.2131
54203666209594.7087185031.8367234157.58070.31810.77240.92530.3872
55241476250634.7087224084.6418277184.77560.24950.99970.90880.9971
56260307261540.7087233142.1625289939.25490.46610.91690.89370.9996
57243324245310.7087215176.8606275444.55680.44860.16470.880.9817
58244460235922.7087204148.1878267697.22960.29920.3240.86740.9196
59233575226742.7087193408.1688260077.24860.34390.14880.85590.7873
60237217231251.7087196426.9628266076.45460.36850.4480.84530.8453
61235243234895.2405194806.1184274984.36260.49320.45480.81920.8557
62230354230290.3531185423.1168275157.58950.49890.41440.76720.7725
63227184226547.4155177360.5887275734.24230.48990.43970.7520.7028
64221678225860.4173172703.7704279017.06430.43870.48050.78940.6798
65217142222156.4174165306.4868279006.3480.43140.50660.77510.6214
66219452227658.4174167340.9232287975.91160.39490.63370.78220.6809
67256446268698.4174205102.1471332294.68770.35290.93550.79930.9564
68265845279604.4174212890.3177346318.51710.3430.75190.71460.9745
69248624263374.4174193681.831333067.00380.33910.47230.71360.9209
70241114253986.4174181437.5229326535.31190.3640.55760.60160.8648
71229245244806.4174169509.4879320103.34690.34270.53830.6150.7948
72231805249315.4174171367.2738327263.5610.32990.69310.61950.8182
73219277252958.9492169459.5774336458.3210.21460.69020.66120.8247
74219313248354.0618159552.2828337155.84080.26080.73950.65440.7812
75212610244611.1242150803.4346338418.81380.25190.70140.64210.7443
76214771243924.1261145364.375342483.87710.2810.73330.67090.7295
77211142240220.1261137127.125343313.12720.29020.68570.66960.6964
78211457245722.1261138286.9864353157.26590.26590.73590.68410.7236
79240048286762.1261175153.6514398370.60080.2060.9070.70280.9018
80240636297668.1261182036.8415413299.41080.16680.83560.70520.9239
81230580281438.1261161919.3562400956.8960.20210.74830.70480.8685
82208795272050.1261148766.3935395333.85870.15730.74510.68860.8253
83197922262870.1261135933.0508389807.20150.1580.79810.69820.7785
84194596267379.1261136890.9524397867.29980.13710.85160.70340.7922


Univariate ARIMA Extrapolation Forecast Performance
time% S.E.PEMAPESq.EMSERMSE
490.023-0.00281e-04357044.22459917.895199.5886
500.03370.00642e-041847847.622351329.1006226.5593
510.04230.00471e-04962936.336526748.2316163.5489
520.0491-0.01815e-0414075317.7705390981.0492625.2848
530.056-0.01895e-0414866489.5888412958.0441642.6181
540.0598-0.02838e-0435149586.8831976377.4134988.1181
550.054-0.03650.00183881945.10442330054.03071526.4515
560.0554-0.00471e-041522037.163642278.8101205.6181
570.0627-0.00812e-043947011.4701109639.2075331.1181
580.06870.03620.00172885342.69172024592.85251422.8819
590.0750.03018e-0446680204.36861296672.34361138.7152
600.07680.02587e-0435584700.2594988463.8961994.2152
610.08710.00150120936.68383359.352357.9599
620.09943e-0404050.9263112.525710.6078
630.11080.00281e-04405239.816811256.6616106.0974
640.1201-0.01855e-0417492614.8871485905.9691697.0696
650.1306-0.02266e-0425144381.9028698455.0529835.7362
660.1352-0.0360.00167345286.63711870702.40661367.7362
670.1208-0.04560.0013150121732.28544170048.1192042.0696
680.1217-0.04920.0014189321567.34655258932.42632293.2362
690.135-0.0560.0016217574813.64476043744.82352458.4029
700.1457-0.05070.0014165699129.86864602753.60752145.4029
710.1569-0.06360.0018242157711.67696726603.10212593.5696
720.1595-0.07020.002306614717.72468517075.49242918.4029
730.1684-0.13320.00371134473700.751531513158.35425613.6582
740.1824-0.11690.0032843383271.3423427313.09284840.177
750.1957-0.13080.00361024071950.691528446443.07485333.5207
760.2062-0.11950.0033849904758.638123608465.51774858.8543
770.219-0.1210.0034845537417.895323487150.49714846.3544
780.2231-0.13940.00391174098867.239632613857.42335710.8544
790.1986-0.16290.00452182209578.096560616932.72497785.6877
800.1982-0.19160.00533252663408.475190351761.34659505.3544
810.2167-0.18070.0052586548991.285271848583.09138476.3544
820.2312-0.23250.00654001210979.0236111144749.417310542.521
830.2464-0.24710.00694218259085.0275117173863.47310824.6877
840.249-0.27220.00765297383446.1504147149540.170812130.521

\begin{tabular}{lllllllll}
\hline
Univariate ARIMA Extrapolation Forecast Performance \tabularnewline
time & % S.E. & PE & MAPE & Sq.E & MSE & RMSE \tabularnewline
49 & 0.023 & -0.0028 & 1e-04 & 357044.2245 & 9917.8951 & 99.5886 \tabularnewline
50 & 0.0337 & 0.0064 & 2e-04 & 1847847.6223 & 51329.1006 & 226.5593 \tabularnewline
51 & 0.0423 & 0.0047 & 1e-04 & 962936.3365 & 26748.2316 & 163.5489 \tabularnewline
52 & 0.0491 & -0.0181 & 5e-04 & 14075317.7705 & 390981.0492 & 625.2848 \tabularnewline
53 & 0.056 & -0.0189 & 5e-04 & 14866489.5888 & 412958.0441 & 642.6181 \tabularnewline
54 & 0.0598 & -0.0283 & 8e-04 & 35149586.8831 & 976377.4134 & 988.1181 \tabularnewline
55 & 0.054 & -0.0365 & 0.001 & 83881945.1044 & 2330054.0307 & 1526.4515 \tabularnewline
56 & 0.0554 & -0.0047 & 1e-04 & 1522037.1636 & 42278.8101 & 205.6181 \tabularnewline
57 & 0.0627 & -0.0081 & 2e-04 & 3947011.4701 & 109639.2075 & 331.1181 \tabularnewline
58 & 0.0687 & 0.0362 & 0.001 & 72885342.6917 & 2024592.8525 & 1422.8819 \tabularnewline
59 & 0.075 & 0.0301 & 8e-04 & 46680204.3686 & 1296672.3436 & 1138.7152 \tabularnewline
60 & 0.0768 & 0.0258 & 7e-04 & 35584700.2594 & 988463.8961 & 994.2152 \tabularnewline
61 & 0.0871 & 0.0015 & 0 & 120936.6838 & 3359.3523 & 57.9599 \tabularnewline
62 & 0.0994 & 3e-04 & 0 & 4050.9263 & 112.5257 & 10.6078 \tabularnewline
63 & 0.1108 & 0.0028 & 1e-04 & 405239.8168 & 11256.6616 & 106.0974 \tabularnewline
64 & 0.1201 & -0.0185 & 5e-04 & 17492614.8871 & 485905.9691 & 697.0696 \tabularnewline
65 & 0.1306 & -0.0226 & 6e-04 & 25144381.9028 & 698455.0529 & 835.7362 \tabularnewline
66 & 0.1352 & -0.036 & 0.001 & 67345286.6371 & 1870702.4066 & 1367.7362 \tabularnewline
67 & 0.1208 & -0.0456 & 0.0013 & 150121732.2854 & 4170048.119 & 2042.0696 \tabularnewline
68 & 0.1217 & -0.0492 & 0.0014 & 189321567.3465 & 5258932.4263 & 2293.2362 \tabularnewline
69 & 0.135 & -0.056 & 0.0016 & 217574813.6447 & 6043744.8235 & 2458.4029 \tabularnewline
70 & 0.1457 & -0.0507 & 0.0014 & 165699129.8686 & 4602753.6075 & 2145.4029 \tabularnewline
71 & 0.1569 & -0.0636 & 0.0018 & 242157711.6769 & 6726603.1021 & 2593.5696 \tabularnewline
72 & 0.1595 & -0.0702 & 0.002 & 306614717.7246 & 8517075.4924 & 2918.4029 \tabularnewline
73 & 0.1684 & -0.1332 & 0.0037 & 1134473700.7515 & 31513158.3542 & 5613.6582 \tabularnewline
74 & 0.1824 & -0.1169 & 0.0032 & 843383271.34 & 23427313.0928 & 4840.177 \tabularnewline
75 & 0.1957 & -0.1308 & 0.0036 & 1024071950.6915 & 28446443.0748 & 5333.5207 \tabularnewline
76 & 0.2062 & -0.1195 & 0.0033 & 849904758.6381 & 23608465.5177 & 4858.8543 \tabularnewline
77 & 0.219 & -0.121 & 0.0034 & 845537417.8953 & 23487150.4971 & 4846.3544 \tabularnewline
78 & 0.2231 & -0.1394 & 0.0039 & 1174098867.2396 & 32613857.4233 & 5710.8544 \tabularnewline
79 & 0.1986 & -0.1629 & 0.0045 & 2182209578.0965 & 60616932.7249 & 7785.6877 \tabularnewline
80 & 0.1982 & -0.1916 & 0.0053 & 3252663408.4751 & 90351761.3465 & 9505.3544 \tabularnewline
81 & 0.2167 & -0.1807 & 0.005 & 2586548991.2852 & 71848583.0913 & 8476.3544 \tabularnewline
82 & 0.2312 & -0.2325 & 0.0065 & 4001210979.0236 & 111144749.4173 & 10542.521 \tabularnewline
83 & 0.2464 & -0.2471 & 0.0069 & 4218259085.0275 & 117173863.473 & 10824.6877 \tabularnewline
84 & 0.249 & -0.2722 & 0.0076 & 5297383446.1504 & 147149540.1708 & 12130.521 \tabularnewline
\hline
\end{tabular}
%Source: https://freestatistics.org/blog/index.php?pk=33514&T=2

[TABLE]
[ROW][C]Univariate ARIMA Extrapolation Forecast Performance[/C][/ROW]
[ROW][C]time[/C][C]% S.E.[/C][C]PE[/C][C]MAPE[/C][C]Sq.E[/C][C]MSE[/C][C]RMSE[/C][/ROW]
[ROW][C]49[/C][C]0.023[/C][C]-0.0028[/C][C]1e-04[/C][C]357044.2245[/C][C]9917.8951[/C][C]99.5886[/C][/ROW]
[ROW][C]50[/C][C]0.0337[/C][C]0.0064[/C][C]2e-04[/C][C]1847847.6223[/C][C]51329.1006[/C][C]226.5593[/C][/ROW]
[ROW][C]51[/C][C]0.0423[/C][C]0.0047[/C][C]1e-04[/C][C]962936.3365[/C][C]26748.2316[/C][C]163.5489[/C][/ROW]
[ROW][C]52[/C][C]0.0491[/C][C]-0.0181[/C][C]5e-04[/C][C]14075317.7705[/C][C]390981.0492[/C][C]625.2848[/C][/ROW]
[ROW][C]53[/C][C]0.056[/C][C]-0.0189[/C][C]5e-04[/C][C]14866489.5888[/C][C]412958.0441[/C][C]642.6181[/C][/ROW]
[ROW][C]54[/C][C]0.0598[/C][C]-0.0283[/C][C]8e-04[/C][C]35149586.8831[/C][C]976377.4134[/C][C]988.1181[/C][/ROW]
[ROW][C]55[/C][C]0.054[/C][C]-0.0365[/C][C]0.001[/C][C]83881945.1044[/C][C]2330054.0307[/C][C]1526.4515[/C][/ROW]
[ROW][C]56[/C][C]0.0554[/C][C]-0.0047[/C][C]1e-04[/C][C]1522037.1636[/C][C]42278.8101[/C][C]205.6181[/C][/ROW]
[ROW][C]57[/C][C]0.0627[/C][C]-0.0081[/C][C]2e-04[/C][C]3947011.4701[/C][C]109639.2075[/C][C]331.1181[/C][/ROW]
[ROW][C]58[/C][C]0.0687[/C][C]0.0362[/C][C]0.001[/C][C]72885342.6917[/C][C]2024592.8525[/C][C]1422.8819[/C][/ROW]
[ROW][C]59[/C][C]0.075[/C][C]0.0301[/C][C]8e-04[/C][C]46680204.3686[/C][C]1296672.3436[/C][C]1138.7152[/C][/ROW]
[ROW][C]60[/C][C]0.0768[/C][C]0.0258[/C][C]7e-04[/C][C]35584700.2594[/C][C]988463.8961[/C][C]994.2152[/C][/ROW]
[ROW][C]61[/C][C]0.0871[/C][C]0.0015[/C][C]0[/C][C]120936.6838[/C][C]3359.3523[/C][C]57.9599[/C][/ROW]
[ROW][C]62[/C][C]0.0994[/C][C]3e-04[/C][C]0[/C][C]4050.9263[/C][C]112.5257[/C][C]10.6078[/C][/ROW]
[ROW][C]63[/C][C]0.1108[/C][C]0.0028[/C][C]1e-04[/C][C]405239.8168[/C][C]11256.6616[/C][C]106.0974[/C][/ROW]
[ROW][C]64[/C][C]0.1201[/C][C]-0.0185[/C][C]5e-04[/C][C]17492614.8871[/C][C]485905.9691[/C][C]697.0696[/C][/ROW]
[ROW][C]65[/C][C]0.1306[/C][C]-0.0226[/C][C]6e-04[/C][C]25144381.9028[/C][C]698455.0529[/C][C]835.7362[/C][/ROW]
[ROW][C]66[/C][C]0.1352[/C][C]-0.036[/C][C]0.001[/C][C]67345286.6371[/C][C]1870702.4066[/C][C]1367.7362[/C][/ROW]
[ROW][C]67[/C][C]0.1208[/C][C]-0.0456[/C][C]0.0013[/C][C]150121732.2854[/C][C]4170048.119[/C][C]2042.0696[/C][/ROW]
[ROW][C]68[/C][C]0.1217[/C][C]-0.0492[/C][C]0.0014[/C][C]189321567.3465[/C][C]5258932.4263[/C][C]2293.2362[/C][/ROW]
[ROW][C]69[/C][C]0.135[/C][C]-0.056[/C][C]0.0016[/C][C]217574813.6447[/C][C]6043744.8235[/C][C]2458.4029[/C][/ROW]
[ROW][C]70[/C][C]0.1457[/C][C]-0.0507[/C][C]0.0014[/C][C]165699129.8686[/C][C]4602753.6075[/C][C]2145.4029[/C][/ROW]
[ROW][C]71[/C][C]0.1569[/C][C]-0.0636[/C][C]0.0018[/C][C]242157711.6769[/C][C]6726603.1021[/C][C]2593.5696[/C][/ROW]
[ROW][C]72[/C][C]0.1595[/C][C]-0.0702[/C][C]0.002[/C][C]306614717.7246[/C][C]8517075.4924[/C][C]2918.4029[/C][/ROW]
[ROW][C]73[/C][C]0.1684[/C][C]-0.1332[/C][C]0.0037[/C][C]1134473700.7515[/C][C]31513158.3542[/C][C]5613.6582[/C][/ROW]
[ROW][C]74[/C][C]0.1824[/C][C]-0.1169[/C][C]0.0032[/C][C]843383271.34[/C][C]23427313.0928[/C][C]4840.177[/C][/ROW]
[ROW][C]75[/C][C]0.1957[/C][C]-0.1308[/C][C]0.0036[/C][C]1024071950.6915[/C][C]28446443.0748[/C][C]5333.5207[/C][/ROW]
[ROW][C]76[/C][C]0.2062[/C][C]-0.1195[/C][C]0.0033[/C][C]849904758.6381[/C][C]23608465.5177[/C][C]4858.8543[/C][/ROW]
[ROW][C]77[/C][C]0.219[/C][C]-0.121[/C][C]0.0034[/C][C]845537417.8953[/C][C]23487150.4971[/C][C]4846.3544[/C][/ROW]
[ROW][C]78[/C][C]0.2231[/C][C]-0.1394[/C][C]0.0039[/C][C]1174098867.2396[/C][C]32613857.4233[/C][C]5710.8544[/C][/ROW]
[ROW][C]79[/C][C]0.1986[/C][C]-0.1629[/C][C]0.0045[/C][C]2182209578.0965[/C][C]60616932.7249[/C][C]7785.6877[/C][/ROW]
[ROW][C]80[/C][C]0.1982[/C][C]-0.1916[/C][C]0.0053[/C][C]3252663408.4751[/C][C]90351761.3465[/C][C]9505.3544[/C][/ROW]
[ROW][C]81[/C][C]0.2167[/C][C]-0.1807[/C][C]0.005[/C][C]2586548991.2852[/C][C]71848583.0913[/C][C]8476.3544[/C][/ROW]
[ROW][C]82[/C][C]0.2312[/C][C]-0.2325[/C][C]0.0065[/C][C]4001210979.0236[/C][C]111144749.4173[/C][C]10542.521[/C][/ROW]
[ROW][C]83[/C][C]0.2464[/C][C]-0.2471[/C][C]0.0069[/C][C]4218259085.0275[/C][C]117173863.473[/C][C]10824.6877[/C][/ROW]
[ROW][C]84[/C][C]0.249[/C][C]-0.2722[/C][C]0.0076[/C][C]5297383446.1504[/C][C]147149540.1708[/C][C]12130.521[/C][/ROW]
[/TABLE]
Source: https://freestatistics.org/blog/index.php?pk=33514&T=2

Globally Unique Identifier (entire table): ba.freestatistics.org/blog/index.php?pk=33514&T=2

As an alternative you can also use a QR Code:  

The GUIDs for individual cells are displayed in the table below:

Univariate ARIMA Extrapolation Forecast Performance
time% S.E.PEMAPESq.EMSERMSE
490.023-0.00281e-04357044.22459917.895199.5886
500.03370.00642e-041847847.622351329.1006226.5593
510.04230.00471e-04962936.336526748.2316163.5489
520.0491-0.01815e-0414075317.7705390981.0492625.2848
530.056-0.01895e-0414866489.5888412958.0441642.6181
540.0598-0.02838e-0435149586.8831976377.4134988.1181
550.054-0.03650.00183881945.10442330054.03071526.4515
560.0554-0.00471e-041522037.163642278.8101205.6181
570.0627-0.00812e-043947011.4701109639.2075331.1181
580.06870.03620.00172885342.69172024592.85251422.8819
590.0750.03018e-0446680204.36861296672.34361138.7152
600.07680.02587e-0435584700.2594988463.8961994.2152
610.08710.00150120936.68383359.352357.9599
620.09943e-0404050.9263112.525710.6078
630.11080.00281e-04405239.816811256.6616106.0974
640.1201-0.01855e-0417492614.8871485905.9691697.0696
650.1306-0.02266e-0425144381.9028698455.0529835.7362
660.1352-0.0360.00167345286.63711870702.40661367.7362
670.1208-0.04560.0013150121732.28544170048.1192042.0696
680.1217-0.04920.0014189321567.34655258932.42632293.2362
690.135-0.0560.0016217574813.64476043744.82352458.4029
700.1457-0.05070.0014165699129.86864602753.60752145.4029
710.1569-0.06360.0018242157711.67696726603.10212593.5696
720.1595-0.07020.002306614717.72468517075.49242918.4029
730.1684-0.13320.00371134473700.751531513158.35425613.6582
740.1824-0.11690.0032843383271.3423427313.09284840.177
750.1957-0.13080.00361024071950.691528446443.07485333.5207
760.2062-0.11950.0033849904758.638123608465.51774858.8543
770.219-0.1210.0034845537417.895323487150.49714846.3544
780.2231-0.13940.00391174098867.239632613857.42335710.8544
790.1986-0.16290.00452182209578.096560616932.72497785.6877
800.1982-0.19160.00533252663408.475190351761.34659505.3544
810.2167-0.18070.0052586548991.285271848583.09138476.3544
820.2312-0.23250.00654001210979.0236111144749.417310542.521
830.2464-0.24710.00694218259085.0275117173863.47310824.6877
840.249-0.27220.00765297383446.1504147149540.170812130.521


Parameters (Session):
par1 = 36 ; par2 = 1.3 ; par3 = 1 ; par4 = 1 ; par5 = 12 ;
Parameters (R input):
par1 = 36 ; par2 = 1 ; par3 = 1 ; par4 = 1 ; par5 = 12 ; par6 = 1 ; par7 = 0 ; par8 = 0 ; par9 = 0 ; par10 = FALSE ;
R code (references can be found in the software module):
par1 <- as.numeric(par1) #cut off periods
par2 <- as.numeric(par2) #lambda
par3 <- as.numeric(par3) #degree of non-seasonal differencing
par4 <- as.numeric(par4) #degree of seasonal differencing
par5 <- as.numeric(par5) #seasonal period
par6 <- as.numeric(par6) #p
par7 <- as.numeric(par7) #q
par8 <- as.numeric(par8) #P
par9 <- as.numeric(par9) #Q
if (par10 == 'TRUE') par10 <- TRUE
if (par10 == 'FALSE') par10 <- FALSE
if (par2 == 0) x <- log(x)
if (par2 != 0) x <- x^par2
lx <- length(x)
first <- lx - 2*par1
nx <- lx - par1
nx1 <- nx + 1
fx <- lx - nx
if (fx < 1) {
fx <- par5
nx1 <- lx + fx - 1
first <- lx - 2*fx
}
first <- 1
if (fx < 3) fx <- round(lx/10,0)
(arima.out <- arima(x[1:nx], order=c(par6,par3,par7), seasonal=list(order=c(par8,par4,par9), period=par5), include.mean=par10, method='ML'))
(forecast <- predict(arima.out,fx))
(lb <- forecast$pred - 1.96 * forecast$se)
(ub <- forecast$pred + 1.96 * forecast$se)
if (par2 == 0) {
x <- exp(x)
forecast$pred <- exp(forecast$pred)
lb <- exp(lb)
ub <- exp(ub)
}
if (par2 != 0) {
x <- x^(1/par2)
forecast$pred <- forecast$pred^(1/par2)
lb <- lb^(1/par2)
ub <- ub^(1/par2)
}
if (par2 < 0) {
olb <- lb
lb <- ub
ub <- olb
}
(actandfor <- c(x[1:nx], forecast$pred))
(perc.se <- (ub-forecast$pred)/1.96/forecast$pred)
bitmap(file='test1.png')
opar <- par(mar=c(4,4,2,2),las=1)
ylim <- c( min(x[first:nx],lb), max(x[first:nx],ub))
plot(x,ylim=ylim,type='n',xlim=c(first,lx))
usr <- par('usr')
rect(usr[1],usr[3],nx+1,usr[4],border=NA,col='lemonchiffon')
rect(nx1,usr[3],usr[2],usr[4],border=NA,col='lavender')
abline(h= (-3:3)*2 , col ='gray', lty =3)
polygon( c(nx1:lx,lx:nx1), c(lb,rev(ub)), col = 'orange', lty=2,border=NA)
lines(nx1:lx, lb , lty=2)
lines(nx1:lx, ub , lty=2)
lines(x, lwd=2)
lines(nx1:lx, forecast$pred , lwd=2 , col ='white')
box()
par(opar)
dev.off()
prob.dec <- array(NA, dim=fx)
prob.sdec <- array(NA, dim=fx)
prob.ldec <- array(NA, dim=fx)
prob.pval <- array(NA, dim=fx)
perf.pe <- array(0, dim=fx)
perf.mape <- array(0, dim=fx)
perf.se <- array(0, dim=fx)
perf.mse <- array(0, dim=fx)
perf.rmse <- array(0, dim=fx)
for (i in 1:fx) {
locSD <- (ub[i] - forecast$pred[i]) / 1.96
perf.pe[i] = (x[nx+i] - forecast$pred[i]) / forecast$pred[i]
perf.mape[i] = perf.mape[i] + abs(perf.pe[i])
perf.se[i] = (x[nx+i] - forecast$pred[i])^2
perf.mse[i] = perf.mse[i] + perf.se[i]
prob.dec[i] = pnorm((x[nx+i-1] - forecast$pred[i]) / locSD)
prob.sdec[i] = pnorm((x[nx+i-par5] - forecast$pred[i]) / locSD)
prob.ldec[i] = pnorm((x[nx] - forecast$pred[i]) / locSD)
prob.pval[i] = pnorm(abs(x[nx+i] - forecast$pred[i]) / locSD)
}
perf.mape = perf.mape / fx
perf.mse = perf.mse / fx
perf.rmse = sqrt(perf.mse)
bitmap(file='test2.png')
plot(forecast$pred, pch=19, type='b',main='ARIMA Extrapolation Forecast', ylab='Forecast and 95% CI', xlab='time',ylim=c(min(lb),max(ub)))
dum <- forecast$pred
dum[1:12] <- x[(nx+1):lx]
lines(dum, lty=1)
lines(ub,lty=3)
lines(lb,lty=3)
dev.off()
load(file='createtable')
a<-table.start()
a<-table.row.start(a)
a<-table.element(a,'Univariate ARIMA Extrapolation Forecast',9,TRUE)
a<-table.row.end(a)
a<-table.row.start(a)
a<-table.element(a,'time',1,header=TRUE)
a<-table.element(a,'Y[t]',1,header=TRUE)
a<-table.element(a,'F[t]',1,header=TRUE)
a<-table.element(a,'95% LB',1,header=TRUE)
a<-table.element(a,'95% UB',1,header=TRUE)
a<-table.element(a,'p-value
(H0: Y[t] = F[t])',1,header=TRUE)
a<-table.element(a,'P(F[t]>Y[t-1])',1,header=TRUE)
a<-table.element(a,'P(F[t]>Y[t-s])',1,header=TRUE)
mylab <- paste('P(F[t]>Y[',nx,sep='')
mylab <- paste(mylab,'])',sep='')
a<-table.element(a,mylab,1,header=TRUE)
a<-table.row.end(a)
for (i in (nx-par5):nx) {
a<-table.row.start(a)
a<-table.element(a,i,header=TRUE)
a<-table.element(a,x[i])
a<-table.element(a,'-')
a<-table.row.end(a)
}
for (i in 1:fx) {
a<-table.row.start(a)
a<-table.element(a,nx+i,header=TRUE)
a<-table.element(a,round(x[nx+i],4))
a<-table.element(a,round(forecast$pred[i],4))
a<-table.element(a,round(lb[i],4))
a<-table.element(a,round(ub[i],4))
a<-table.element(a,round((1-prob.pval[i]),4))
a<-table.element(a,round((1-prob.dec[i]),4))
a<-table.element(a,round((1-prob.sdec[i]),4))
a<-table.element(a,round((1-prob.ldec[i]),4))
a<-table.row.end(a)
}
a<-table.end(a)
table.save(a,file='mytable.tab')
a<-table.start()
a<-table.row.start(a)
a<-table.element(a,'Univariate ARIMA Extrapolation Forecast Performance',7,TRUE)
a<-table.row.end(a)
a<-table.row.start(a)
a<-table.element(a,'time',1,header=TRUE)
a<-table.element(a,'% S.E.',1,header=TRUE)
a<-table.element(a,'PE',1,header=TRUE)
a<-table.element(a,'MAPE',1,header=TRUE)
a<-table.element(a,'Sq.E',1,header=TRUE)
a<-table.element(a,'MSE',1,header=TRUE)
a<-table.element(a,'RMSE',1,header=TRUE)
a<-table.row.end(a)
for (i in 1:fx) {
a<-table.row.start(a)
a<-table.element(a,nx+i,header=TRUE)
a<-table.element(a,round(perc.se[i],4))
a<-table.element(a,round(perf.pe[i],4))
a<-table.element(a,round(perf.mape[i],4))
a<-table.element(a,round(perf.se[i],4))
a<-table.element(a,round(perf.mse[i],4))
a<-table.element(a,round(perf.rmse[i],4))
a<-table.row.end(a)
}
a<-table.end(a)
table.save(a,file='mytable1.tab')