Free Statistics

of Irreproducible Research!

Author's title

Author*The author of this computation has been verified*
R Software Modulerwasp_arimabackwardselection.wasp
Title produced by softwareARIMA Backward Selection
Date of computationSun, 14 Dec 2008 10:43:32 -0700
Cite this page as followsStatistical Computations at FreeStatistics.org, Office for Research Development and Education, URL https://freestatistics.org/blog/index.php?v=date/2008/Dec/14/t1229276725aozb2roc1uc6zn5.htm/, Retrieved Wed, 15 May 2024 05:30:10 +0000
Statistical Computations at FreeStatistics.org, Office for Research Development and Education, URL https://freestatistics.org/blog/index.php?pk=33507, Retrieved Wed, 15 May 2024 05:30:10 +0000
QR Codes:

Original text written by user:
IsPrivate?No (this computation is public)
User-defined keywords
Estimated Impact238
Family? (F = Feedback message, R = changed R code, M = changed R Module, P = changed Parameters, D = changed Data)
-     [(Partial) Autocorrelation Function] [(P)ACF Totale omzet] [2007-12-20 14:02:48] [74be16979710d4c4e7c6647856088456]
- R PD  [(Partial) Autocorrelation Function] [invoer] [2008-12-14 15:37:18] [5e74953d94072114d25d7276793b561e]
- RM D      [ARIMA Backward Selection] [werkloosheid] [2008-12-14 17:43:32] [5925747fb2a6bb4cfcd8015825ee5e92] [Current]
Feedback Forum

Post a new message
Dataseries X:
180144
173666
165688
161570
156145
153730
182698
200765
176512
166618
158644
159585
163095
159044
155511
153745
150569
150605
179612
194690
189917
184128
175335
179566
181140
177876
175041
169292
166070
166972
206348
215706
202108
195411
193111
195198
198770
194163
190420
189733
186029
191531
232571
243477
227247
217859
208679
213188
216234
213586
209465
204045
200237
203666
241476
260307
243324
244460
233575
237217
235243
230354
227184
221678
217142
219452
256446
265845
248624
241114
229245
231805
219277
219313
212610
214771
211142
211457
240048
240636
230580
208795
197922
194596


Summary of computational transaction
Raw Inputview raw input (R code)
Raw Outputview raw output of R engine
Computing time15 seconds
R Server'Herman Ole Andreas Wold' @ 193.190.124.10:1001

\begin{tabular}{lllllllll}
\hline
Summary of computational transaction \tabularnewline
Raw Input & view raw input (R code)  \tabularnewline
Raw Output & view raw output of R engine  \tabularnewline
Computing time & 15 seconds \tabularnewline
R Server & 'Herman Ole Andreas Wold' @ 193.190.124.10:1001 \tabularnewline
\hline
\end{tabular}
%Source: https://freestatistics.org/blog/index.php?pk=33507&T=0

[TABLE]
[ROW][C]Summary of computational transaction[/C][/ROW]
[ROW][C]Raw Input[/C][C]view raw input (R code) [/C][/ROW]
[ROW][C]Raw Output[/C][C]view raw output of R engine [/C][/ROW]
[ROW][C]Computing time[/C][C]15 seconds[/C][/ROW]
[ROW][C]R Server[/C][C]'Herman Ole Andreas Wold' @ 193.190.124.10:1001[/C][/ROW]
[/TABLE]
Source: https://freestatistics.org/blog/index.php?pk=33507&T=0

Globally Unique Identifier (entire table): ba.freestatistics.org/blog/index.php?pk=33507&T=0

As an alternative you can also use a QR Code:  

The GUIDs for individual cells are displayed in the table below:

Summary of computational transaction
Raw Inputview raw input (R code)
Raw Outputview raw output of R engine
Computing time15 seconds
R Server'Herman Ole Andreas Wold' @ 193.190.124.10:1001


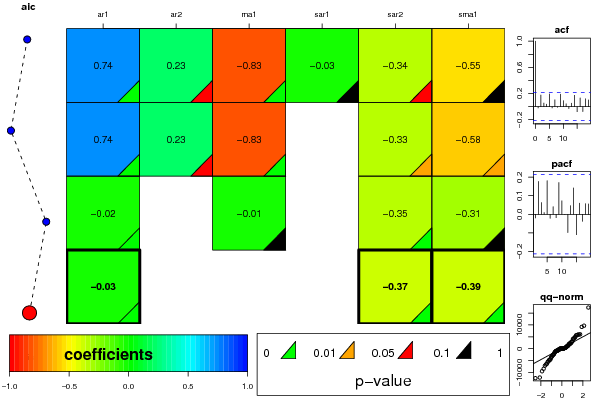
ARIMA Parameter Estimation and Backward Selection
Iterationar1ar2ma1sar1sar2sma1
Estimates ( 1 )0.74190.227-0.8293-0.0256-0.34-0.5498
(p-val)(0 )(0.0777 )(0 )(0.9373 )(0.0821 )(0.2059 )
Estimates ( 2 )0.74210.2264-0.82890-0.3308-0.5785
(p-val)(0 )(0.0783 )(0 )(NA )(0.0384 )(0.0183 )
Estimates ( 3 )-0.01680-0.00850-0.3539-0.3091
(p-val)(0 )(NA )(0.9411 )(NA )(0 )(0.5823 )
Estimates ( 4 )-0.028000-0.3662-0.392
(p-val)(0 )(NA )(NA )(NA )(0 )(0.0019 )
Estimates ( 5 )NANANANANANA
(p-val)(NA )(NA )(NA )(NA )(NA )(NA )
Estimates ( 6 )NANANANANANA
(p-val)(NA )(NA )(NA )(NA )(NA )(NA )
Estimates ( 7 )NANANANANANA
(p-val)(NA )(NA )(NA )(NA )(NA )(NA )
Estimates ( 8 )NANANANANANA
(p-val)(NA )(NA )(NA )(NA )(NA )(NA )
Estimates ( 9 )NANANANANANA
(p-val)(NA )(NA )(NA )(NA )(NA )(NA )
Estimates ( 10 )NANANANANANA
(p-val)(NA )(NA )(NA )(NA )(NA )(NA )
Estimates ( 11 )NANANANANANA
(p-val)(NA )(NA )(NA )(NA )(NA )(NA )

\begin{tabular}{lllllllll}
\hline
ARIMA Parameter Estimation and Backward Selection \tabularnewline
Iteration & ar1 & ar2 & ma1 & sar1 & sar2 & sma1 \tabularnewline
Estimates ( 1 ) & 0.7419 & 0.227 & -0.8293 & -0.0256 & -0.34 & -0.5498 \tabularnewline
(p-val) & (0 ) & (0.0777 ) & (0 ) & (0.9373 ) & (0.0821 ) & (0.2059 ) \tabularnewline
Estimates ( 2 ) & 0.7421 & 0.2264 & -0.8289 & 0 & -0.3308 & -0.5785 \tabularnewline
(p-val) & (0 ) & (0.0783 ) & (0 ) & (NA ) & (0.0384 ) & (0.0183 ) \tabularnewline
Estimates ( 3 ) & -0.0168 & 0 & -0.0085 & 0 & -0.3539 & -0.3091 \tabularnewline
(p-val) & (0 ) & (NA ) & (0.9411 ) & (NA ) & (0 ) & (0.5823 ) \tabularnewline
Estimates ( 4 ) & -0.028 & 0 & 0 & 0 & -0.3662 & -0.392 \tabularnewline
(p-val) & (0 ) & (NA ) & (NA ) & (NA ) & (0 ) & (0.0019 ) \tabularnewline
Estimates ( 5 ) & NA & NA & NA & NA & NA & NA \tabularnewline
(p-val) & (NA ) & (NA ) & (NA ) & (NA ) & (NA ) & (NA ) \tabularnewline
Estimates ( 6 ) & NA & NA & NA & NA & NA & NA \tabularnewline
(p-val) & (NA ) & (NA ) & (NA ) & (NA ) & (NA ) & (NA ) \tabularnewline
Estimates ( 7 ) & NA & NA & NA & NA & NA & NA \tabularnewline
(p-val) & (NA ) & (NA ) & (NA ) & (NA ) & (NA ) & (NA ) \tabularnewline
Estimates ( 8 ) & NA & NA & NA & NA & NA & NA \tabularnewline
(p-val) & (NA ) & (NA ) & (NA ) & (NA ) & (NA ) & (NA ) \tabularnewline
Estimates ( 9 ) & NA & NA & NA & NA & NA & NA \tabularnewline
(p-val) & (NA ) & (NA ) & (NA ) & (NA ) & (NA ) & (NA ) \tabularnewline
Estimates ( 10 ) & NA & NA & NA & NA & NA & NA \tabularnewline
(p-val) & (NA ) & (NA ) & (NA ) & (NA ) & (NA ) & (NA ) \tabularnewline
Estimates ( 11 ) & NA & NA & NA & NA & NA & NA \tabularnewline
(p-val) & (NA ) & (NA ) & (NA ) & (NA ) & (NA ) & (NA ) \tabularnewline
\hline
\end{tabular}
%Source: https://freestatistics.org/blog/index.php?pk=33507&T=1

[TABLE]
[ROW][C]ARIMA Parameter Estimation and Backward Selection[/C][/ROW]
[ROW][C]Iteration[/C][C]ar1[/C][C]ar2[/C][C]ma1[/C][C]sar1[/C][C]sar2[/C][C]sma1[/C][/ROW]
[ROW][C]Estimates ( 1 )[/C][C]0.7419[/C][C]0.227[/C][C]-0.8293[/C][C]-0.0256[/C][C]-0.34[/C][C]-0.5498[/C][/ROW]
[ROW][C](p-val)[/C][C](0 )[/C][C](0.0777 )[/C][C](0 )[/C][C](0.9373 )[/C][C](0.0821 )[/C][C](0.2059 )[/C][/ROW]
[ROW][C]Estimates ( 2 )[/C][C]0.7421[/C][C]0.2264[/C][C]-0.8289[/C][C]0[/C][C]-0.3308[/C][C]-0.5785[/C][/ROW]
[ROW][C](p-val)[/C][C](0 )[/C][C](0.0783 )[/C][C](0 )[/C][C](NA )[/C][C](0.0384 )[/C][C](0.0183 )[/C][/ROW]
[ROW][C]Estimates ( 3 )[/C][C]-0.0168[/C][C]0[/C][C]-0.0085[/C][C]0[/C][C]-0.3539[/C][C]-0.3091[/C][/ROW]
[ROW][C](p-val)[/C][C](0 )[/C][C](NA )[/C][C](0.9411 )[/C][C](NA )[/C][C](0 )[/C][C](0.5823 )[/C][/ROW]
[ROW][C]Estimates ( 4 )[/C][C]-0.028[/C][C]0[/C][C]0[/C][C]0[/C][C]-0.3662[/C][C]-0.392[/C][/ROW]
[ROW][C](p-val)[/C][C](0 )[/C][C](NA )[/C][C](NA )[/C][C](NA )[/C][C](0 )[/C][C](0.0019 )[/C][/ROW]
[ROW][C]Estimates ( 5 )[/C][C]NA[/C][C]NA[/C][C]NA[/C][C]NA[/C][C]NA[/C][C]NA[/C][/ROW]
[ROW][C](p-val)[/C][C](NA )[/C][C](NA )[/C][C](NA )[/C][C](NA )[/C][C](NA )[/C][C](NA )[/C][/ROW]
[ROW][C]Estimates ( 6 )[/C][C]NA[/C][C]NA[/C][C]NA[/C][C]NA[/C][C]NA[/C][C]NA[/C][/ROW]
[ROW][C](p-val)[/C][C](NA )[/C][C](NA )[/C][C](NA )[/C][C](NA )[/C][C](NA )[/C][C](NA )[/C][/ROW]
[ROW][C]Estimates ( 7 )[/C][C]NA[/C][C]NA[/C][C]NA[/C][C]NA[/C][C]NA[/C][C]NA[/C][/ROW]
[ROW][C](p-val)[/C][C](NA )[/C][C](NA )[/C][C](NA )[/C][C](NA )[/C][C](NA )[/C][C](NA )[/C][/ROW]
[ROW][C]Estimates ( 8 )[/C][C]NA[/C][C]NA[/C][C]NA[/C][C]NA[/C][C]NA[/C][C]NA[/C][/ROW]
[ROW][C](p-val)[/C][C](NA )[/C][C](NA )[/C][C](NA )[/C][C](NA )[/C][C](NA )[/C][C](NA )[/C][/ROW]
[ROW][C]Estimates ( 9 )[/C][C]NA[/C][C]NA[/C][C]NA[/C][C]NA[/C][C]NA[/C][C]NA[/C][/ROW]
[ROW][C](p-val)[/C][C](NA )[/C][C](NA )[/C][C](NA )[/C][C](NA )[/C][C](NA )[/C][C](NA )[/C][/ROW]
[ROW][C]Estimates ( 10 )[/C][C]NA[/C][C]NA[/C][C]NA[/C][C]NA[/C][C]NA[/C][C]NA[/C][/ROW]
[ROW][C](p-val)[/C][C](NA )[/C][C](NA )[/C][C](NA )[/C][C](NA )[/C][C](NA )[/C][C](NA )[/C][/ROW]
[ROW][C]Estimates ( 11 )[/C][C]NA[/C][C]NA[/C][C]NA[/C][C]NA[/C][C]NA[/C][C]NA[/C][/ROW]
[ROW][C](p-val)[/C][C](NA )[/C][C](NA )[/C][C](NA )[/C][C](NA )[/C][C](NA )[/C][C](NA )[/C][/ROW]
[/TABLE]
Source: https://freestatistics.org/blog/index.php?pk=33507&T=1

Globally Unique Identifier (entire table): ba.freestatistics.org/blog/index.php?pk=33507&T=1

As an alternative you can also use a QR Code:  

The GUIDs for individual cells are displayed in the table below:

ARIMA Parameter Estimation and Backward Selection
Iterationar1ar2ma1sar1sar2sma1
Estimates ( 1 )0.74190.227-0.8293-0.0256-0.34-0.5498
(p-val)(0 )(0.0777 )(0 )(0.9373 )(0.0821 )(0.2059 )
Estimates ( 2 )0.74210.2264-0.82890-0.3308-0.5785
(p-val)(0 )(0.0783 )(0 )(NA )(0.0384 )(0.0183 )
Estimates ( 3 )-0.01680-0.00850-0.3539-0.3091
(p-val)(0 )(NA )(0.9411 )(NA )(0 )(0.5823 )
Estimates ( 4 )-0.028000-0.3662-0.392
(p-val)(0 )(NA )(NA )(NA )(0 )(0.0019 )
Estimates ( 5 )NANANANANANA
(p-val)(NA )(NA )(NA )(NA )(NA )(NA )
Estimates ( 6 )NANANANANANA
(p-val)(NA )(NA )(NA )(NA )(NA )(NA )
Estimates ( 7 )NANANANANANA
(p-val)(NA )(NA )(NA )(NA )(NA )(NA )
Estimates ( 8 )NANANANANANA
(p-val)(NA )(NA )(NA )(NA )(NA )(NA )
Estimates ( 9 )NANANANANANA
(p-val)(NA )(NA )(NA )(NA )(NA )(NA )
Estimates ( 10 )NANANANANANA
(p-val)(NA )(NA )(NA )(NA )(NA )(NA )
Estimates ( 11 )NANANANANANA
(p-val)(NA )(NA )(NA )(NA )(NA )(NA )


Estimated ARIMA Residuals
Value
-656.902758051388
2167.81595591413
4026.67081846858
2202.53994190982
2063.47499812588
2241.19653650927
90.4115129048267
-2669.92321522935
17338.5970422344
4107.90520251769
-636.720453443414
2856.91546433472
-1620.96829745179
1205.21761443714
1335.64169999315
-3332.1235158756
253.693173786432
1179.66528560052
9174.66710727187
-5370.35842403249
-4798.70002698051
-871.088539896558
5849.89984204819
-1257.34318786243
1370.964112057
-87.6752449957976
1023.12731491225
4934.46273703859
524.684144863787
5748.22875263566
4364.79200163202
-962.119558296408
2903.00788220799
-1371.88606219726
-5509.07781207417
3026.78549189075
-731.858739905116
2178.12610708495
238.492408471419
-4629.36134812198
-115.528422320914
-9.14848826650681
1731.76371745373
5611.59782710811
-2834.58798193384
9678.30779946068
-838.211583166468
-680.267277181233
-4574.70135289983
-2152.96180302675
633.606948016841
291.134138450885
-890.869290646637
483.745682363949
320.391443755404
-7156.13632933746
-2269.94363779997
-6640.3713645741
-3920.90861378189
-523.476411815092
-12158.5649877590
4680.81022303561
-3330.9372884605
5990.15632303187
745.8436997282
-2555.81796821609
-9515.97945987443
-8460.18346390957
6042.71511490134
-12429.1139901461
-1084.9652866914
-6346.90580958532

\begin{tabular}{lllllllll}
\hline
Estimated ARIMA Residuals \tabularnewline
Value \tabularnewline
-656.902758051388 \tabularnewline
2167.81595591413 \tabularnewline
4026.67081846858 \tabularnewline
2202.53994190982 \tabularnewline
2063.47499812588 \tabularnewline
2241.19653650927 \tabularnewline
90.4115129048267 \tabularnewline
-2669.92321522935 \tabularnewline
17338.5970422344 \tabularnewline
4107.90520251769 \tabularnewline
-636.720453443414 \tabularnewline
2856.91546433472 \tabularnewline
-1620.96829745179 \tabularnewline
1205.21761443714 \tabularnewline
1335.64169999315 \tabularnewline
-3332.1235158756 \tabularnewline
253.693173786432 \tabularnewline
1179.66528560052 \tabularnewline
9174.66710727187 \tabularnewline
-5370.35842403249 \tabularnewline
-4798.70002698051 \tabularnewline
-871.088539896558 \tabularnewline
5849.89984204819 \tabularnewline
-1257.34318786243 \tabularnewline
1370.964112057 \tabularnewline
-87.6752449957976 \tabularnewline
1023.12731491225 \tabularnewline
4934.46273703859 \tabularnewline
524.684144863787 \tabularnewline
5748.22875263566 \tabularnewline
4364.79200163202 \tabularnewline
-962.119558296408 \tabularnewline
2903.00788220799 \tabularnewline
-1371.88606219726 \tabularnewline
-5509.07781207417 \tabularnewline
3026.78549189075 \tabularnewline
-731.858739905116 \tabularnewline
2178.12610708495 \tabularnewline
238.492408471419 \tabularnewline
-4629.36134812198 \tabularnewline
-115.528422320914 \tabularnewline
-9.14848826650681 \tabularnewline
1731.76371745373 \tabularnewline
5611.59782710811 \tabularnewline
-2834.58798193384 \tabularnewline
9678.30779946068 \tabularnewline
-838.211583166468 \tabularnewline
-680.267277181233 \tabularnewline
-4574.70135289983 \tabularnewline
-2152.96180302675 \tabularnewline
633.606948016841 \tabularnewline
291.134138450885 \tabularnewline
-890.869290646637 \tabularnewline
483.745682363949 \tabularnewline
320.391443755404 \tabularnewline
-7156.13632933746 \tabularnewline
-2269.94363779997 \tabularnewline
-6640.3713645741 \tabularnewline
-3920.90861378189 \tabularnewline
-523.476411815092 \tabularnewline
-12158.5649877590 \tabularnewline
4680.81022303561 \tabularnewline
-3330.9372884605 \tabularnewline
5990.15632303187 \tabularnewline
745.8436997282 \tabularnewline
-2555.81796821609 \tabularnewline
-9515.97945987443 \tabularnewline
-8460.18346390957 \tabularnewline
6042.71511490134 \tabularnewline
-12429.1139901461 \tabularnewline
-1084.9652866914 \tabularnewline
-6346.90580958532 \tabularnewline
\hline
\end{tabular}
%Source: https://freestatistics.org/blog/index.php?pk=33507&T=2

[TABLE]
[ROW][C]Estimated ARIMA Residuals[/C][/ROW]
[ROW][C]Value[/C][/ROW]
[ROW][C]-656.902758051388[/C][/ROW]
[ROW][C]2167.81595591413[/C][/ROW]
[ROW][C]4026.67081846858[/C][/ROW]
[ROW][C]2202.53994190982[/C][/ROW]
[ROW][C]2063.47499812588[/C][/ROW]
[ROW][C]2241.19653650927[/C][/ROW]
[ROW][C]90.4115129048267[/C][/ROW]
[ROW][C]-2669.92321522935[/C][/ROW]
[ROW][C]17338.5970422344[/C][/ROW]
[ROW][C]4107.90520251769[/C][/ROW]
[ROW][C]-636.720453443414[/C][/ROW]
[ROW][C]2856.91546433472[/C][/ROW]
[ROW][C]-1620.96829745179[/C][/ROW]
[ROW][C]1205.21761443714[/C][/ROW]
[ROW][C]1335.64169999315[/C][/ROW]
[ROW][C]-3332.1235158756[/C][/ROW]
[ROW][C]253.693173786432[/C][/ROW]
[ROW][C]1179.66528560052[/C][/ROW]
[ROW][C]9174.66710727187[/C][/ROW]
[ROW][C]-5370.35842403249[/C][/ROW]
[ROW][C]-4798.70002698051[/C][/ROW]
[ROW][C]-871.088539896558[/C][/ROW]
[ROW][C]5849.89984204819[/C][/ROW]
[ROW][C]-1257.34318786243[/C][/ROW]
[ROW][C]1370.964112057[/C][/ROW]
[ROW][C]-87.6752449957976[/C][/ROW]
[ROW][C]1023.12731491225[/C][/ROW]
[ROW][C]4934.46273703859[/C][/ROW]
[ROW][C]524.684144863787[/C][/ROW]
[ROW][C]5748.22875263566[/C][/ROW]
[ROW][C]4364.79200163202[/C][/ROW]
[ROW][C]-962.119558296408[/C][/ROW]
[ROW][C]2903.00788220799[/C][/ROW]
[ROW][C]-1371.88606219726[/C][/ROW]
[ROW][C]-5509.07781207417[/C][/ROW]
[ROW][C]3026.78549189075[/C][/ROW]
[ROW][C]-731.858739905116[/C][/ROW]
[ROW][C]2178.12610708495[/C][/ROW]
[ROW][C]238.492408471419[/C][/ROW]
[ROW][C]-4629.36134812198[/C][/ROW]
[ROW][C]-115.528422320914[/C][/ROW]
[ROW][C]-9.14848826650681[/C][/ROW]
[ROW][C]1731.76371745373[/C][/ROW]
[ROW][C]5611.59782710811[/C][/ROW]
[ROW][C]-2834.58798193384[/C][/ROW]
[ROW][C]9678.30779946068[/C][/ROW]
[ROW][C]-838.211583166468[/C][/ROW]
[ROW][C]-680.267277181233[/C][/ROW]
[ROW][C]-4574.70135289983[/C][/ROW]
[ROW][C]-2152.96180302675[/C][/ROW]
[ROW][C]633.606948016841[/C][/ROW]
[ROW][C]291.134138450885[/C][/ROW]
[ROW][C]-890.869290646637[/C][/ROW]
[ROW][C]483.745682363949[/C][/ROW]
[ROW][C]320.391443755404[/C][/ROW]
[ROW][C]-7156.13632933746[/C][/ROW]
[ROW][C]-2269.94363779997[/C][/ROW]
[ROW][C]-6640.3713645741[/C][/ROW]
[ROW][C]-3920.90861378189[/C][/ROW]
[ROW][C]-523.476411815092[/C][/ROW]
[ROW][C]-12158.5649877590[/C][/ROW]
[ROW][C]4680.81022303561[/C][/ROW]
[ROW][C]-3330.9372884605[/C][/ROW]
[ROW][C]5990.15632303187[/C][/ROW]
[ROW][C]745.8436997282[/C][/ROW]
[ROW][C]-2555.81796821609[/C][/ROW]
[ROW][C]-9515.97945987443[/C][/ROW]
[ROW][C]-8460.18346390957[/C][/ROW]
[ROW][C]6042.71511490134[/C][/ROW]
[ROW][C]-12429.1139901461[/C][/ROW]
[ROW][C]-1084.9652866914[/C][/ROW]
[ROW][C]-6346.90580958532[/C][/ROW]
[/TABLE]
Source: https://freestatistics.org/blog/index.php?pk=33507&T=2

Globally Unique Identifier (entire table): ba.freestatistics.org/blog/index.php?pk=33507&T=2

As an alternative you can also use a QR Code:  

The GUIDs for individual cells are displayed in the table below:

Estimated ARIMA Residuals
Value
-656.902758051388
2167.81595591413
4026.67081846858
2202.53994190982
2063.47499812588
2241.19653650927
90.4115129048267
-2669.92321522935
17338.5970422344
4107.90520251769
-636.720453443414
2856.91546433472
-1620.96829745179
1205.21761443714
1335.64169999315
-3332.1235158756
253.693173786432
1179.66528560052
9174.66710727187
-5370.35842403249
-4798.70002698051
-871.088539896558
5849.89984204819
-1257.34318786243
1370.964112057
-87.6752449957976
1023.12731491225
4934.46273703859
524.684144863787
5748.22875263566
4364.79200163202
-962.119558296408
2903.00788220799
-1371.88606219726
-5509.07781207417
3026.78549189075
-731.858739905116
2178.12610708495
238.492408471419
-4629.36134812198
-115.528422320914
-9.14848826650681
1731.76371745373
5611.59782710811
-2834.58798193384
9678.30779946068
-838.211583166468
-680.267277181233
-4574.70135289983
-2152.96180302675
633.606948016841
291.134138450885
-890.869290646637
483.745682363949
320.391443755404
-7156.13632933746
-2269.94363779997
-6640.3713645741
-3920.90861378189
-523.476411815092
-12158.5649877590
4680.81022303561
-3330.9372884605
5990.15632303187
745.8436997282
-2555.81796821609
-9515.97945987443
-8460.18346390957
6042.71511490134
-12429.1139901461
-1084.9652866914
-6346.90580958532


Parameters (Session):
par1 = 36 ; par2 = 1.3 ; par3 = 1 ; par4 = 1 ; par5 = 12 ;
Parameters (R input):
par1 = FALSE ; par2 = 1 ; par3 = 1 ; par4 = 1 ; par5 = 12 ; par6 = 2 ; par7 = 1 ; par8 = 2 ; par9 = 1 ;
R code (references can be found in the software module):
library(lattice)
if (par1 == 'TRUE') par1 <- TRUE
if (par1 == 'FALSE') par1 <- FALSE
par2 <- as.numeric(par2) #Box-Cox lambda transformation parameter
par3 <- as.numeric(par3) #degree of non-seasonal differencing
par4 <- as.numeric(par4) #degree of seasonal differencing
par5 <- as.numeric(par5) #seasonal period
par6 <- as.numeric(par6) #degree (p) of the non-seasonal AR(p) polynomial
par7 <- as.numeric(par7) #degree (q) of the non-seasonal MA(q) polynomial
par8 <- as.numeric(par8) #degree (P) of the seasonal AR(P) polynomial
par9 <- as.numeric(par9) #degree (Q) of the seasonal MA(Q) polynomial
armaGR <- function(arima.out, names, n){
try1 <- arima.out$coef
try2 <- sqrt(diag(arima.out$var.coef))
try.data.frame <- data.frame(matrix(NA,ncol=4,nrow=length(names)))
dimnames(try.data.frame) <- list(names,c('coef','std','tstat','pv'))
try.data.frame[,1] <- try1
for(i in 1:length(try2)) try.data.frame[which(rownames(try.data.frame)==names(try2)[i]),2] <- try2[i]
try.data.frame[,3] <- try.data.frame[,1] / try.data.frame[,2]
try.data.frame[,4] <- round((1-pt(abs(try.data.frame[,3]),df=n-(length(try2)+1)))*2,5)
vector <- rep(NA,length(names))
vector[is.na(try.data.frame[,4])] <- 0
maxi <- which.max(try.data.frame[,4])
continue <- max(try.data.frame[,4],na.rm=TRUE) > .05
vector[maxi] <- 0
list(summary=try.data.frame,next.vector=vector,continue=continue)
}
arimaSelect <- function(series, order=c(13,0,0), seasonal=list(order=c(2,0,0),period=12), include.mean=F){
nrc <- order[1]+order[3]+seasonal$order[1]+seasonal$order[3]
coeff <- matrix(NA, nrow=nrc*2, ncol=nrc)
pval <- matrix(NA, nrow=nrc*2, ncol=nrc)
mylist <- rep(list(NULL), nrc)
names <- NULL
if(order[1] > 0) names <- paste('ar',1:order[1],sep='')
if(order[3] > 0) names <- c( names , paste('ma',1:order[3],sep='') )
if(seasonal$order[1] > 0) names <- c(names, paste('sar',1:seasonal$order[1],sep=''))
if(seasonal$order[3] > 0) names <- c(names, paste('sma',1:seasonal$order[3],sep=''))
arima.out <- arima(series, order=order, seasonal=seasonal, include.mean=include.mean, method='ML')
mylist[[1]] <- arima.out
last.arma <- armaGR(arima.out, names, length(series))
mystop <- FALSE
i <- 1
coeff[i,] <- last.arma[[1]][,1]
pval [i,] <- last.arma[[1]][,4]
i <- 2
aic <- arima.out$aic
while(!mystop){
mylist[[i]] <- arima.out
arima.out <- arima(series, order=order, seasonal=seasonal, include.mean=include.mean, method='ML', fixed=last.arma$next.vector)
aic <- c(aic, arima.out$aic)
last.arma <- armaGR(arima.out, names, length(series))
mystop <- !last.arma$continue
coeff[i,] <- last.arma[[1]][,1]
pval [i,] <- last.arma[[1]][,4]
i <- i+1
}
list(coeff, pval, mylist, aic=aic)
}
arimaSelectplot <- function(arimaSelect.out,noms,choix){
noms <- names(arimaSelect.out[[3]][[1]]$coef)
coeff <- arimaSelect.out[[1]]
k <- min(which(is.na(coeff[,1])))-1
coeff <- coeff[1:k,]
pval <- arimaSelect.out[[2]][1:k,]
aic <- arimaSelect.out$aic[1:k]
coeff[coeff==0] <- NA
n <- ncol(coeff)
if(missing(choix)) choix <- k
layout(matrix(c(1,1,1,2,
3,3,3,2,
3,3,3,4,
5,6,7,7),nr=4),
widths=c(10,35,45,15),
heights=c(30,30,15,15))
couleurs <- rainbow(75)[1:50]#(50)
ticks <- pretty(coeff)
par(mar=c(1,1,3,1))
plot(aic,k:1-.5,type='o',pch=21,bg='blue',cex=2,axes=F,lty=2,xpd=NA)
points(aic[choix],k-choix+.5,pch=21,cex=4,bg=2,xpd=NA)
title('aic',line=2)
par(mar=c(3,0,0,0))
plot(0,axes=F,xlab='',ylab='',xlim=range(ticks),ylim=c(.1,1))
rect(xleft = min(ticks) + (0:49)/50*(max(ticks)-min(ticks)),
xright = min(ticks) + (1:50)/50*(max(ticks)-min(ticks)),
ytop = rep(1,50),
ybottom= rep(0,50),col=couleurs,border=NA)
axis(1,ticks)
rect(xleft=min(ticks),xright=max(ticks),ytop=1,ybottom=0)
text(mean(coeff,na.rm=T),.5,'coefficients',cex=2,font=2)
par(mar=c(1,1,3,1))
image(1:n,1:k,t(coeff[k:1,]),axes=F,col=couleurs,zlim=range(ticks))
for(i in 1:n) for(j in 1:k) if(!is.na(coeff[j,i])) {
if(pval[j,i]<.01) symb = 'green'
else if( (pval[j,i]<.05) & (pval[j,i]>=.01)) symb = 'orange'
else if( (pval[j,i]<.1) & (pval[j,i]>=.05)) symb = 'red'
else symb = 'black'
polygon(c(i+.5 ,i+.2 ,i+.5 ,i+.5),
c(k-j+0.5,k-j+0.5,k-j+0.8,k-j+0.5),
col=symb)
if(j==choix) {
rect(xleft=i-.5,
xright=i+.5,
ybottom=k-j+1.5,
ytop=k-j+.5,
lwd=4)
text(i,
k-j+1,
round(coeff[j,i],2),
cex=1.2,
font=2)
}
else{
rect(xleft=i-.5,xright=i+.5,ybottom=k-j+1.5,ytop=k-j+.5)
text(i,k-j+1,round(coeff[j,i],2),cex=1.2,font=1)
}
}
axis(3,1:n,noms)
par(mar=c(0.5,0,0,0.5))
plot(0,axes=F,xlab='',ylab='',type='n',xlim=c(0,8),ylim=c(-.2,.8))
cols <- c('green','orange','red','black')
niv <- c('0','0.01','0.05','0.1')
for(i in 0:3){
polygon(c(1+2*i ,1+2*i ,1+2*i-.5 ,1+2*i),
c(.4 ,.7 , .4 , .4),
col=cols[i+1])
text(2*i,0.5,niv[i+1],cex=1.5)
}
text(8,.5,1,cex=1.5)
text(4,0,'p-value',cex=2)
box()
residus <- arimaSelect.out[[3]][[choix]]$res
par(mar=c(1,2,4,1))
acf(residus,main='')
title('acf',line=.5)
par(mar=c(1,2,4,1))
pacf(residus,main='')
title('pacf',line=.5)
par(mar=c(2,2,4,1))
qqnorm(residus,main='')
title('qq-norm',line=.5)
qqline(residus)
residus
}
if (par2 == 0) x <- log(x)
if (par2 != 0) x <- x^par2
(selection <- arimaSelect(x, order=c(par6,par3,par7), seasonal=list(order=c(par8,par4,par9), period=par5)))
bitmap(file='test1.png')
resid <- arimaSelectplot(selection)
dev.off()
resid
bitmap(file='test2.png')
acf(resid,length(resid)/2, main='Residual Autocorrelation Function')
dev.off()
bitmap(file='test3.png')
pacf(resid,length(resid)/2, main='Residual Partial Autocorrelation Function')
dev.off()
bitmap(file='test4.png')
cpgram(resid, main='Residual Cumulative Periodogram')
dev.off()
bitmap(file='test5.png')
hist(resid, main='Residual Histogram', xlab='values of Residuals')
dev.off()
bitmap(file='test6.png')
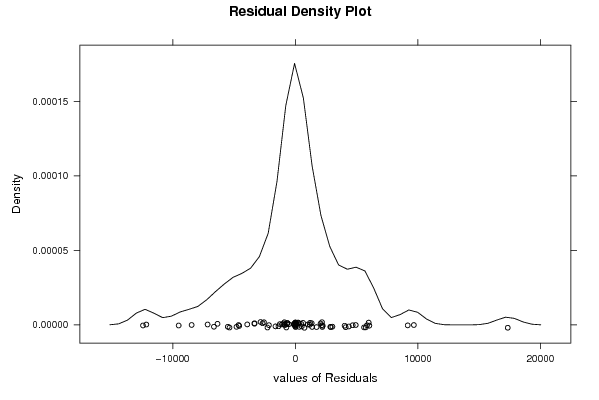
densityplot(~resid,col='black',main='Residual Density Plot', xlab='values of Residuals')
dev.off()
bitmap(file='test7.png')
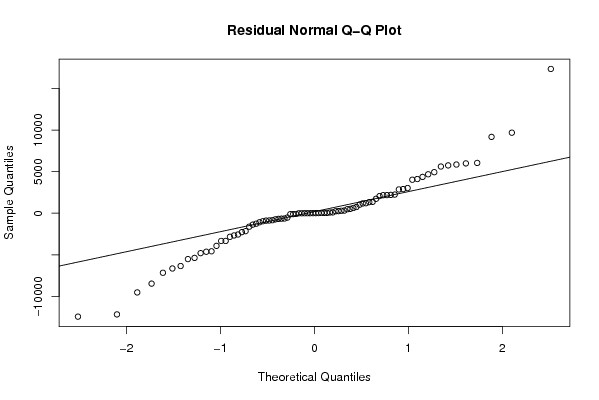
qqnorm(resid, main='Residual Normal Q-Q Plot')
qqline(resid)
dev.off()
ncols <- length(selection[[1]][1,])
nrows <- length(selection[[2]][,1])-1
load(file='createtable')
a<-table.start()
a<-table.row.start(a)
a<-table.element(a,'ARIMA Parameter Estimation and Backward Selection', ncols+1,TRUE)
a<-table.row.end(a)
a<-table.row.start(a)
a<-table.element(a,'Iteration', header=TRUE)
for (i in 1:ncols) {
a<-table.element(a,names(selection[[3]][[1]]$coef)[i],header=TRUE)
}
a<-table.row.end(a)
for (j in 1:nrows) {
a<-table.row.start(a)
mydum <- 'Estimates ('
mydum <- paste(mydum,j)
mydum <- paste(mydum,')')
a<-table.element(a,mydum, header=TRUE)
for (i in 1:ncols) {
a<-table.element(a,round(selection[[1]][j,i],4))
}
a<-table.row.end(a)
a<-table.row.start(a)
a<-table.element(a,'(p-val)', header=TRUE)
for (i in 1:ncols) {
mydum <- '('
mydum <- paste(mydum,round(selection[[2]][j,i],4),sep='')
mydum <- paste(mydum,')')
a<-table.element(a,mydum)
}
a<-table.row.end(a)
}
a<-table.end(a)
table.save(a,file='mytable.tab')
a<-table.start()
a<-table.row.start(a)
a<-table.element(a,'Estimated ARIMA Residuals', 1,TRUE)
a<-table.row.end(a)
a<-table.row.start(a)
a<-table.element(a,'Value', 1,TRUE)
a<-table.row.end(a)
for (i in (par4*par5+par3):length(resid)) {
a<-table.row.start(a)
a<-table.element(a,resid[i])
a<-table.row.end(a)
}
a<-table.end(a)
table.save(a,file='mytable1.tab')