Free Statistics

of Irreproducible Research!

Author's title

Author*The author of this computation has been verified*
R Software Modulerwasp_arimabackwardselection.wasp
Title produced by softwareARIMA Backward Selection
Date of computationSun, 14 Dec 2008 10:17:09 -0700
Cite this page as followsStatistical Computations at FreeStatistics.org, Office for Research Development and Education, URL https://freestatistics.org/blog/index.php?v=date/2008/Dec/14/t1229276374s8ixux4y10kbm9b.htm/, Retrieved Wed, 15 May 2024 17:31:20 +0000
Statistical Computations at FreeStatistics.org, Office for Research Development and Education, URL https://freestatistics.org/blog/index.php?pk=33503, Retrieved Wed, 15 May 2024 17:31:20 +0000
QR Codes:

Original text written by user:
IsPrivate?No (this computation is public)
User-defined keywords
Estimated Impact214
Family? (F = Feedback message, R = changed R code, M = changed R Module, P = changed Parameters, D = changed Data)
-     [(Partial) Autocorrelation Function] [(P)ACF Totale omzet] [2007-12-20 14:02:48] [74be16979710d4c4e7c6647856088456]
- R PD  [(Partial) Autocorrelation Function] [invoer] [2008-12-14 15:37:18] [5e74953d94072114d25d7276793b561e]
- RM D      [ARIMA Backward Selection] [invoer] [2008-12-14 17:17:09] [5925747fb2a6bb4cfcd8015825ee5e92] [Current]
Feedback Forum

Post a new message
Dataseries X:
11554,5
13182,1
14800,1
12150,7
14478,2
13253,9
12036,8
12653,2
14035,4
14571,4
15400,9
14283,2
14485,3
14196,3
15559,1
13767,4
14634
14381,1
12509,9
12122,3
13122,3
13908,7
13456,5
12441,6
12953
13057,2
14350,1
13830,2
13755,5
13574,4
12802,6
11737,3
13850,2
15081,8
13653,3
14019,1
13962
13768,7
14747,1
13858,1
13188
13693,1
12970
11392,8
13985,2
14994,7
13584,7
14257,8
13553,4
14007,3
16535,8
14721,4
13664,6
16805,9
13829,4
13735,6
15870,5
15962,4
15744,1
16083,7
14863,9
15533,1
17473,1
15925,5
15573,7
17495
14155,8
14913,9
17250,4
15879,8
17647,8
17749,9
17111,8
16934,8
20280
16238,2
17896,1
18089,3
15660
16162,4
17850,1
18520,4
18524,7
16843,7


Summary of computational transaction
Raw Inputview raw input (R code)
Raw Outputview raw output of R engine
Computing time9 seconds
R Server'Gwilym Jenkins' @ 72.249.127.135

\begin{tabular}{lllllllll}
\hline
Summary of computational transaction \tabularnewline
Raw Input & view raw input (R code)  \tabularnewline
Raw Output & view raw output of R engine  \tabularnewline
Computing time & 9 seconds \tabularnewline
R Server & 'Gwilym Jenkins' @ 72.249.127.135 \tabularnewline
\hline
\end{tabular}
%Source: https://freestatistics.org/blog/index.php?pk=33503&T=0

[TABLE]
[ROW][C]Summary of computational transaction[/C][/ROW]
[ROW][C]Raw Input[/C][C]view raw input (R code) [/C][/ROW]
[ROW][C]Raw Output[/C][C]view raw output of R engine [/C][/ROW]
[ROW][C]Computing time[/C][C]9 seconds[/C][/ROW]
[ROW][C]R Server[/C][C]'Gwilym Jenkins' @ 72.249.127.135[/C][/ROW]
[/TABLE]
Source: https://freestatistics.org/blog/index.php?pk=33503&T=0

Globally Unique Identifier (entire table): ba.freestatistics.org/blog/index.php?pk=33503&T=0

As an alternative you can also use a QR Code:  

The GUIDs for individual cells are displayed in the table below:

Summary of computational transaction
Raw Inputview raw input (R code)
Raw Outputview raw output of R engine
Computing time9 seconds
R Server'Gwilym Jenkins' @ 72.249.127.135


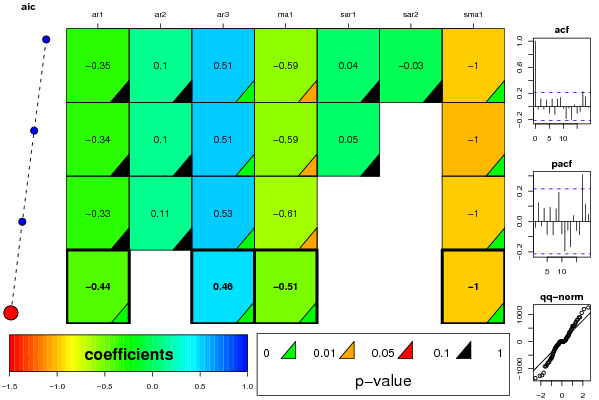
ARIMA Parameter Estimation and Backward Selection
Iterationar1ar2ar3ma1sar1sar2sma1
Estimates ( 1 )-0.34730.10150.5134-0.58530.0441-0.0331-1
(p-val)(0.2002 )(0.7003 )(0.0049 )(0.0442 )(0.8055 )(0.8491 )(2e-04 )
Estimates ( 2 )-0.34420.10430.5142-0.59240.04730-1.0002
(p-val)(0.2125 )(0.6982 )(0.0054 )(0.0447 )(0.7902 )(NA )(1e-04 )
Estimates ( 3 )-0.3340.11390.5285-0.61400-0.9999
(p-val)(0.2185 )(0.6694 )(0.0031 )(0.0301 )(NA )(NA )(4e-04 )
Estimates ( 4 )-0.439300.4623-0.506300-1
(p-val)(3e-04 )(NA )(0 )(1e-04 )(NA )(NA )(4e-04 )
Estimates ( 5 )NANANANANANANA
(p-val)(NA )(NA )(NA )(NA )(NA )(NA )(NA )
Estimates ( 6 )NANANANANANANA
(p-val)(NA )(NA )(NA )(NA )(NA )(NA )(NA )
Estimates ( 7 )NANANANANANANA
(p-val)(NA )(NA )(NA )(NA )(NA )(NA )(NA )
Estimates ( 8 )NANANANANANANA
(p-val)(NA )(NA )(NA )(NA )(NA )(NA )(NA )
Estimates ( 9 )NANANANANANANA
(p-val)(NA )(NA )(NA )(NA )(NA )(NA )(NA )
Estimates ( 10 )NANANANANANANA
(p-val)(NA )(NA )(NA )(NA )(NA )(NA )(NA )
Estimates ( 11 )NANANANANANANA
(p-val)(NA )(NA )(NA )(NA )(NA )(NA )(NA )
Estimates ( 12 )NANANANANANANA
(p-val)(NA )(NA )(NA )(NA )(NA )(NA )(NA )
Estimates ( 13 )NANANANANANANA
(p-val)(NA )(NA )(NA )(NA )(NA )(NA )(NA )

\begin{tabular}{lllllllll}
\hline
ARIMA Parameter Estimation and Backward Selection \tabularnewline
Iteration & ar1 & ar2 & ar3 & ma1 & sar1 & sar2 & sma1 \tabularnewline
Estimates ( 1 ) & -0.3473 & 0.1015 & 0.5134 & -0.5853 & 0.0441 & -0.0331 & -1 \tabularnewline
(p-val) & (0.2002 ) & (0.7003 ) & (0.0049 ) & (0.0442 ) & (0.8055 ) & (0.8491 ) & (2e-04 ) \tabularnewline
Estimates ( 2 ) & -0.3442 & 0.1043 & 0.5142 & -0.5924 & 0.0473 & 0 & -1.0002 \tabularnewline
(p-val) & (0.2125 ) & (0.6982 ) & (0.0054 ) & (0.0447 ) & (0.7902 ) & (NA ) & (1e-04 ) \tabularnewline
Estimates ( 3 ) & -0.334 & 0.1139 & 0.5285 & -0.614 & 0 & 0 & -0.9999 \tabularnewline
(p-val) & (0.2185 ) & (0.6694 ) & (0.0031 ) & (0.0301 ) & (NA ) & (NA ) & (4e-04 ) \tabularnewline
Estimates ( 4 ) & -0.4393 & 0 & 0.4623 & -0.5063 & 0 & 0 & -1 \tabularnewline
(p-val) & (3e-04 ) & (NA ) & (0 ) & (1e-04 ) & (NA ) & (NA ) & (4e-04 ) \tabularnewline
Estimates ( 5 ) & NA & NA & NA & NA & NA & NA & NA \tabularnewline
(p-val) & (NA ) & (NA ) & (NA ) & (NA ) & (NA ) & (NA ) & (NA ) \tabularnewline
Estimates ( 6 ) & NA & NA & NA & NA & NA & NA & NA \tabularnewline
(p-val) & (NA ) & (NA ) & (NA ) & (NA ) & (NA ) & (NA ) & (NA ) \tabularnewline
Estimates ( 7 ) & NA & NA & NA & NA & NA & NA & NA \tabularnewline
(p-val) & (NA ) & (NA ) & (NA ) & (NA ) & (NA ) & (NA ) & (NA ) \tabularnewline
Estimates ( 8 ) & NA & NA & NA & NA & NA & NA & NA \tabularnewline
(p-val) & (NA ) & (NA ) & (NA ) & (NA ) & (NA ) & (NA ) & (NA ) \tabularnewline
Estimates ( 9 ) & NA & NA & NA & NA & NA & NA & NA \tabularnewline
(p-val) & (NA ) & (NA ) & (NA ) & (NA ) & (NA ) & (NA ) & (NA ) \tabularnewline
Estimates ( 10 ) & NA & NA & NA & NA & NA & NA & NA \tabularnewline
(p-val) & (NA ) & (NA ) & (NA ) & (NA ) & (NA ) & (NA ) & (NA ) \tabularnewline
Estimates ( 11 ) & NA & NA & NA & NA & NA & NA & NA \tabularnewline
(p-val) & (NA ) & (NA ) & (NA ) & (NA ) & (NA ) & (NA ) & (NA ) \tabularnewline
Estimates ( 12 ) & NA & NA & NA & NA & NA & NA & NA \tabularnewline
(p-val) & (NA ) & (NA ) & (NA ) & (NA ) & (NA ) & (NA ) & (NA ) \tabularnewline
Estimates ( 13 ) & NA & NA & NA & NA & NA & NA & NA \tabularnewline
(p-val) & (NA ) & (NA ) & (NA ) & (NA ) & (NA ) & (NA ) & (NA ) \tabularnewline
\hline
\end{tabular}
%Source: https://freestatistics.org/blog/index.php?pk=33503&T=1

[TABLE]
[ROW][C]ARIMA Parameter Estimation and Backward Selection[/C][/ROW]
[ROW][C]Iteration[/C][C]ar1[/C][C]ar2[/C][C]ar3[/C][C]ma1[/C][C]sar1[/C][C]sar2[/C][C]sma1[/C][/ROW]
[ROW][C]Estimates ( 1 )[/C][C]-0.3473[/C][C]0.1015[/C][C]0.5134[/C][C]-0.5853[/C][C]0.0441[/C][C]-0.0331[/C][C]-1[/C][/ROW]
[ROW][C](p-val)[/C][C](0.2002 )[/C][C](0.7003 )[/C][C](0.0049 )[/C][C](0.0442 )[/C][C](0.8055 )[/C][C](0.8491 )[/C][C](2e-04 )[/C][/ROW]
[ROW][C]Estimates ( 2 )[/C][C]-0.3442[/C][C]0.1043[/C][C]0.5142[/C][C]-0.5924[/C][C]0.0473[/C][C]0[/C][C]-1.0002[/C][/ROW]
[ROW][C](p-val)[/C][C](0.2125 )[/C][C](0.6982 )[/C][C](0.0054 )[/C][C](0.0447 )[/C][C](0.7902 )[/C][C](NA )[/C][C](1e-04 )[/C][/ROW]
[ROW][C]Estimates ( 3 )[/C][C]-0.334[/C][C]0.1139[/C][C]0.5285[/C][C]-0.614[/C][C]0[/C][C]0[/C][C]-0.9999[/C][/ROW]
[ROW][C](p-val)[/C][C](0.2185 )[/C][C](0.6694 )[/C][C](0.0031 )[/C][C](0.0301 )[/C][C](NA )[/C][C](NA )[/C][C](4e-04 )[/C][/ROW]
[ROW][C]Estimates ( 4 )[/C][C]-0.4393[/C][C]0[/C][C]0.4623[/C][C]-0.5063[/C][C]0[/C][C]0[/C][C]-1[/C][/ROW]
[ROW][C](p-val)[/C][C](3e-04 )[/C][C](NA )[/C][C](0 )[/C][C](1e-04 )[/C][C](NA )[/C][C](NA )[/C][C](4e-04 )[/C][/ROW]
[ROW][C]Estimates ( 5 )[/C][C]NA[/C][C]NA[/C][C]NA[/C][C]NA[/C][C]NA[/C][C]NA[/C][C]NA[/C][/ROW]
[ROW][C](p-val)[/C][C](NA )[/C][C](NA )[/C][C](NA )[/C][C](NA )[/C][C](NA )[/C][C](NA )[/C][C](NA )[/C][/ROW]
[ROW][C]Estimates ( 6 )[/C][C]NA[/C][C]NA[/C][C]NA[/C][C]NA[/C][C]NA[/C][C]NA[/C][C]NA[/C][/ROW]
[ROW][C](p-val)[/C][C](NA )[/C][C](NA )[/C][C](NA )[/C][C](NA )[/C][C](NA )[/C][C](NA )[/C][C](NA )[/C][/ROW]
[ROW][C]Estimates ( 7 )[/C][C]NA[/C][C]NA[/C][C]NA[/C][C]NA[/C][C]NA[/C][C]NA[/C][C]NA[/C][/ROW]
[ROW][C](p-val)[/C][C](NA )[/C][C](NA )[/C][C](NA )[/C][C](NA )[/C][C](NA )[/C][C](NA )[/C][C](NA )[/C][/ROW]
[ROW][C]Estimates ( 8 )[/C][C]NA[/C][C]NA[/C][C]NA[/C][C]NA[/C][C]NA[/C][C]NA[/C][C]NA[/C][/ROW]
[ROW][C](p-val)[/C][C](NA )[/C][C](NA )[/C][C](NA )[/C][C](NA )[/C][C](NA )[/C][C](NA )[/C][C](NA )[/C][/ROW]
[ROW][C]Estimates ( 9 )[/C][C]NA[/C][C]NA[/C][C]NA[/C][C]NA[/C][C]NA[/C][C]NA[/C][C]NA[/C][/ROW]
[ROW][C](p-val)[/C][C](NA )[/C][C](NA )[/C][C](NA )[/C][C](NA )[/C][C](NA )[/C][C](NA )[/C][C](NA )[/C][/ROW]
[ROW][C]Estimates ( 10 )[/C][C]NA[/C][C]NA[/C][C]NA[/C][C]NA[/C][C]NA[/C][C]NA[/C][C]NA[/C][/ROW]
[ROW][C](p-val)[/C][C](NA )[/C][C](NA )[/C][C](NA )[/C][C](NA )[/C][C](NA )[/C][C](NA )[/C][C](NA )[/C][/ROW]
[ROW][C]Estimates ( 11 )[/C][C]NA[/C][C]NA[/C][C]NA[/C][C]NA[/C][C]NA[/C][C]NA[/C][C]NA[/C][/ROW]
[ROW][C](p-val)[/C][C](NA )[/C][C](NA )[/C][C](NA )[/C][C](NA )[/C][C](NA )[/C][C](NA )[/C][C](NA )[/C][/ROW]
[ROW][C]Estimates ( 12 )[/C][C]NA[/C][C]NA[/C][C]NA[/C][C]NA[/C][C]NA[/C][C]NA[/C][C]NA[/C][/ROW]
[ROW][C](p-val)[/C][C](NA )[/C][C](NA )[/C][C](NA )[/C][C](NA )[/C][C](NA )[/C][C](NA )[/C][C](NA )[/C][/ROW]
[ROW][C]Estimates ( 13 )[/C][C]NA[/C][C]NA[/C][C]NA[/C][C]NA[/C][C]NA[/C][C]NA[/C][C]NA[/C][/ROW]
[ROW][C](p-val)[/C][C](NA )[/C][C](NA )[/C][C](NA )[/C][C](NA )[/C][C](NA )[/C][C](NA )[/C][C](NA )[/C][/ROW]
[/TABLE]
Source: https://freestatistics.org/blog/index.php?pk=33503&T=1

Globally Unique Identifier (entire table): ba.freestatistics.org/blog/index.php?pk=33503&T=1

As an alternative you can also use a QR Code:  

The GUIDs for individual cells are displayed in the table below:

ARIMA Parameter Estimation and Backward Selection
Iterationar1ar2ar3ma1sar1sar2sma1
Estimates ( 1 )-0.34730.10150.5134-0.58530.0441-0.0331-1
(p-val)(0.2002 )(0.7003 )(0.0049 )(0.0442 )(0.8055 )(0.8491 )(2e-04 )
Estimates ( 2 )-0.34420.10430.5142-0.59240.04730-1.0002
(p-val)(0.2125 )(0.6982 )(0.0054 )(0.0447 )(0.7902 )(NA )(1e-04 )
Estimates ( 3 )-0.3340.11390.5285-0.61400-0.9999
(p-val)(0.2185 )(0.6694 )(0.0031 )(0.0301 )(NA )(NA )(4e-04 )
Estimates ( 4 )-0.439300.4623-0.506300-1
(p-val)(3e-04 )(NA )(0 )(1e-04 )(NA )(NA )(4e-04 )
Estimates ( 5 )NANANANANANANA
(p-val)(NA )(NA )(NA )(NA )(NA )(NA )(NA )
Estimates ( 6 )NANANANANANANA
(p-val)(NA )(NA )(NA )(NA )(NA )(NA )(NA )
Estimates ( 7 )NANANANANANANA
(p-val)(NA )(NA )(NA )(NA )(NA )(NA )(NA )
Estimates ( 8 )NANANANANANANA
(p-val)(NA )(NA )(NA )(NA )(NA )(NA )(NA )
Estimates ( 9 )NANANANANANANA
(p-val)(NA )(NA )(NA )(NA )(NA )(NA )(NA )
Estimates ( 10 )NANANANANANANA
(p-val)(NA )(NA )(NA )(NA )(NA )(NA )(NA )
Estimates ( 11 )NANANANANANANA
(p-val)(NA )(NA )(NA )(NA )(NA )(NA )(NA )
Estimates ( 12 )NANANANANANANA
(p-val)(NA )(NA )(NA )(NA )(NA )(NA )(NA )
Estimates ( 13 )NANANANANANANA
(p-val)(NA )(NA )(NA )(NA )(NA )(NA )(NA )


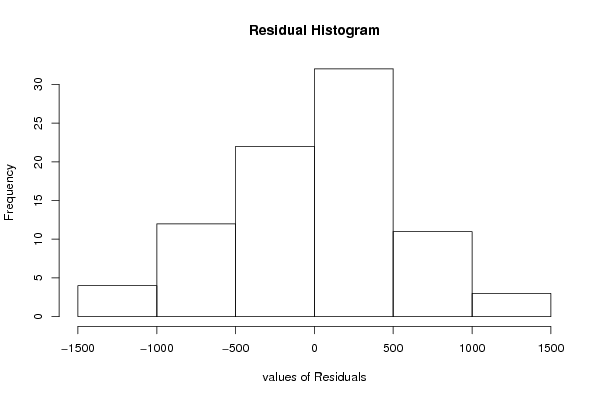
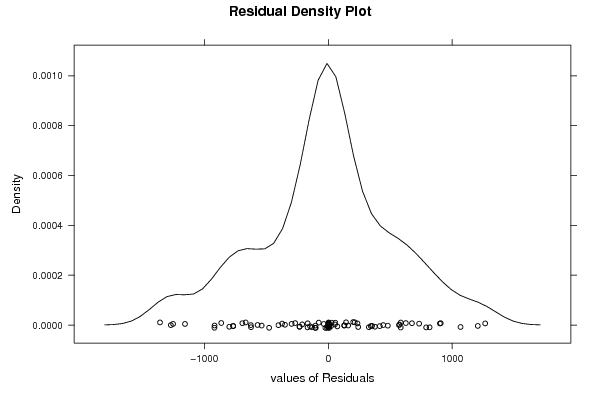
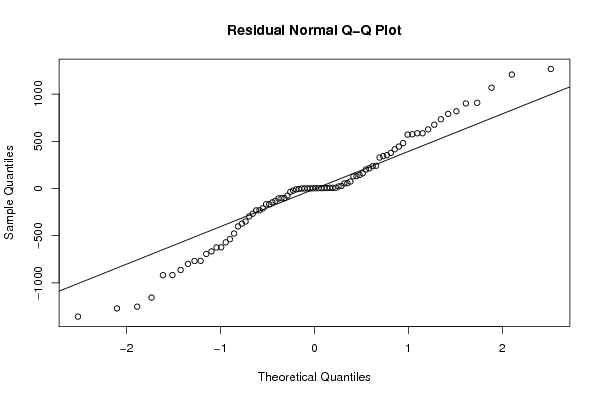
Estimated ARIMA Residuals
Value
-36.0173598836919
-768.594025792552
-766.493761252517
-477.341029679157
-296.034244441747
73.1069917820452
-349.562033190392
-537.479618678354
-1357.77202733445
-232.287680339257
-625.349689362752
-798.54247018917
235.412221111414
573.778123862834
53.063655415744
907.075907569194
-22.9779252725927
-167.292771049012
130.326694771200
56.2949564450518
6.8106537470338
625.644968221271
-372.620443211686
-146.628237133449
160.383783793663
240.981430296327
-918.623164325213
-103.295916128568
-917.64426248344
-77.0964596670572
584.195682478169
128.057651404573
-10.317264194175
414.935308883285
-131.561962664868
21.1736221659594
-166.448644115489
342.476529301474
900.247303716015
789.618614023537
-1270.41850217575
1206.19502384260
480.242229041832
674.919089091691
-623.396894586933
-105.938885227576
-231.286330751335
327.245715866766
-210.307578590570
-267.486438846308
143.124909417517
570.534080386384
-402.0852743005
733.035746293789
-666.695339865923
353.247512358209
443.512615530519
-693.405280200171
376.099095052786
1066.96227635483
1265.78180901511
-863.766109975949
817.072613637403
-1156.19795206783
7.24270196079881
-570.638470807106
26.5241149736748
-101.843063849772
200.868149827987
584.566838625671
213.405467093464
-1252.36008083151

\begin{tabular}{lllllllll}
\hline
Estimated ARIMA Residuals \tabularnewline
Value \tabularnewline
-36.0173598836919 \tabularnewline
-768.594025792552 \tabularnewline
-766.493761252517 \tabularnewline
-477.341029679157 \tabularnewline
-296.034244441747 \tabularnewline
73.1069917820452 \tabularnewline
-349.562033190392 \tabularnewline
-537.479618678354 \tabularnewline
-1357.77202733445 \tabularnewline
-232.287680339257 \tabularnewline
-625.349689362752 \tabularnewline
-798.54247018917 \tabularnewline
235.412221111414 \tabularnewline
573.778123862834 \tabularnewline
53.063655415744 \tabularnewline
907.075907569194 \tabularnewline
-22.9779252725927 \tabularnewline
-167.292771049012 \tabularnewline
130.326694771200 \tabularnewline
56.2949564450518 \tabularnewline
6.8106537470338 \tabularnewline
625.644968221271 \tabularnewline
-372.620443211686 \tabularnewline
-146.628237133449 \tabularnewline
160.383783793663 \tabularnewline
240.981430296327 \tabularnewline
-918.623164325213 \tabularnewline
-103.295916128568 \tabularnewline
-917.64426248344 \tabularnewline
-77.0964596670572 \tabularnewline
584.195682478169 \tabularnewline
128.057651404573 \tabularnewline
-10.317264194175 \tabularnewline
414.935308883285 \tabularnewline
-131.561962664868 \tabularnewline
21.1736221659594 \tabularnewline
-166.448644115489 \tabularnewline
342.476529301474 \tabularnewline
900.247303716015 \tabularnewline
789.618614023537 \tabularnewline
-1270.41850217575 \tabularnewline
1206.19502384260 \tabularnewline
480.242229041832 \tabularnewline
674.919089091691 \tabularnewline
-623.396894586933 \tabularnewline
-105.938885227576 \tabularnewline
-231.286330751335 \tabularnewline
327.245715866766 \tabularnewline
-210.307578590570 \tabularnewline
-267.486438846308 \tabularnewline
143.124909417517 \tabularnewline
570.534080386384 \tabularnewline
-402.0852743005 \tabularnewline
733.035746293789 \tabularnewline
-666.695339865923 \tabularnewline
353.247512358209 \tabularnewline
443.512615530519 \tabularnewline
-693.405280200171 \tabularnewline
376.099095052786 \tabularnewline
1066.96227635483 \tabularnewline
1265.78180901511 \tabularnewline
-863.766109975949 \tabularnewline
817.072613637403 \tabularnewline
-1156.19795206783 \tabularnewline
7.24270196079881 \tabularnewline
-570.638470807106 \tabularnewline
26.5241149736748 \tabularnewline
-101.843063849772 \tabularnewline
200.868149827987 \tabularnewline
584.566838625671 \tabularnewline
213.405467093464 \tabularnewline
-1252.36008083151 \tabularnewline
\hline
\end{tabular}
%Source: https://freestatistics.org/blog/index.php?pk=33503&T=2

[TABLE]
[ROW][C]Estimated ARIMA Residuals[/C][/ROW]
[ROW][C]Value[/C][/ROW]
[ROW][C]-36.0173598836919[/C][/ROW]
[ROW][C]-768.594025792552[/C][/ROW]
[ROW][C]-766.493761252517[/C][/ROW]
[ROW][C]-477.341029679157[/C][/ROW]
[ROW][C]-296.034244441747[/C][/ROW]
[ROW][C]73.1069917820452[/C][/ROW]
[ROW][C]-349.562033190392[/C][/ROW]
[ROW][C]-537.479618678354[/C][/ROW]
[ROW][C]-1357.77202733445[/C][/ROW]
[ROW][C]-232.287680339257[/C][/ROW]
[ROW][C]-625.349689362752[/C][/ROW]
[ROW][C]-798.54247018917[/C][/ROW]
[ROW][C]235.412221111414[/C][/ROW]
[ROW][C]573.778123862834[/C][/ROW]
[ROW][C]53.063655415744[/C][/ROW]
[ROW][C]907.075907569194[/C][/ROW]
[ROW][C]-22.9779252725927[/C][/ROW]
[ROW][C]-167.292771049012[/C][/ROW]
[ROW][C]130.326694771200[/C][/ROW]
[ROW][C]56.2949564450518[/C][/ROW]
[ROW][C]6.8106537470338[/C][/ROW]
[ROW][C]625.644968221271[/C][/ROW]
[ROW][C]-372.620443211686[/C][/ROW]
[ROW][C]-146.628237133449[/C][/ROW]
[ROW][C]160.383783793663[/C][/ROW]
[ROW][C]240.981430296327[/C][/ROW]
[ROW][C]-918.623164325213[/C][/ROW]
[ROW][C]-103.295916128568[/C][/ROW]
[ROW][C]-917.64426248344[/C][/ROW]
[ROW][C]-77.0964596670572[/C][/ROW]
[ROW][C]584.195682478169[/C][/ROW]
[ROW][C]128.057651404573[/C][/ROW]
[ROW][C]-10.317264194175[/C][/ROW]
[ROW][C]414.935308883285[/C][/ROW]
[ROW][C]-131.561962664868[/C][/ROW]
[ROW][C]21.1736221659594[/C][/ROW]
[ROW][C]-166.448644115489[/C][/ROW]
[ROW][C]342.476529301474[/C][/ROW]
[ROW][C]900.247303716015[/C][/ROW]
[ROW][C]789.618614023537[/C][/ROW]
[ROW][C]-1270.41850217575[/C][/ROW]
[ROW][C]1206.19502384260[/C][/ROW]
[ROW][C]480.242229041832[/C][/ROW]
[ROW][C]674.919089091691[/C][/ROW]
[ROW][C]-623.396894586933[/C][/ROW]
[ROW][C]-105.938885227576[/C][/ROW]
[ROW][C]-231.286330751335[/C][/ROW]
[ROW][C]327.245715866766[/C][/ROW]
[ROW][C]-210.307578590570[/C][/ROW]
[ROW][C]-267.486438846308[/C][/ROW]
[ROW][C]143.124909417517[/C][/ROW]
[ROW][C]570.534080386384[/C][/ROW]
[ROW][C]-402.0852743005[/C][/ROW]
[ROW][C]733.035746293789[/C][/ROW]
[ROW][C]-666.695339865923[/C][/ROW]
[ROW][C]353.247512358209[/C][/ROW]
[ROW][C]443.512615530519[/C][/ROW]
[ROW][C]-693.405280200171[/C][/ROW]
[ROW][C]376.099095052786[/C][/ROW]
[ROW][C]1066.96227635483[/C][/ROW]
[ROW][C]1265.78180901511[/C][/ROW]
[ROW][C]-863.766109975949[/C][/ROW]
[ROW][C]817.072613637403[/C][/ROW]
[ROW][C]-1156.19795206783[/C][/ROW]
[ROW][C]7.24270196079881[/C][/ROW]
[ROW][C]-570.638470807106[/C][/ROW]
[ROW][C]26.5241149736748[/C][/ROW]
[ROW][C]-101.843063849772[/C][/ROW]
[ROW][C]200.868149827987[/C][/ROW]
[ROW][C]584.566838625671[/C][/ROW]
[ROW][C]213.405467093464[/C][/ROW]
[ROW][C]-1252.36008083151[/C][/ROW]
[/TABLE]
Source: https://freestatistics.org/blog/index.php?pk=33503&T=2

Globally Unique Identifier (entire table): ba.freestatistics.org/blog/index.php?pk=33503&T=2

As an alternative you can also use a QR Code:  

The GUIDs for individual cells are displayed in the table below:

Estimated ARIMA Residuals
Value
-36.0173598836919
-768.594025792552
-766.493761252517
-477.341029679157
-296.034244441747
73.1069917820452
-349.562033190392
-537.479618678354
-1357.77202733445
-232.287680339257
-625.349689362752
-798.54247018917
235.412221111414
573.778123862834
53.063655415744
907.075907569194
-22.9779252725927
-167.292771049012
130.326694771200
56.2949564450518
6.8106537470338
625.644968221271
-372.620443211686
-146.628237133449
160.383783793663
240.981430296327
-918.623164325213
-103.295916128568
-917.64426248344
-77.0964596670572
584.195682478169
128.057651404573
-10.317264194175
414.935308883285
-131.561962664868
21.1736221659594
-166.448644115489
342.476529301474
900.247303716015
789.618614023537
-1270.41850217575
1206.19502384260
480.242229041832
674.919089091691
-623.396894586933
-105.938885227576
-231.286330751335
327.245715866766
-210.307578590570
-267.486438846308
143.124909417517
570.534080386384
-402.0852743005
733.035746293789
-666.695339865923
353.247512358209
443.512615530519
-693.405280200171
376.099095052786
1066.96227635483
1265.78180901511
-863.766109975949
817.072613637403
-1156.19795206783
7.24270196079881
-570.638470807106
26.5241149736748
-101.843063849772
200.868149827987
584.566838625671
213.405467093464
-1252.36008083151


Parameters (Session):
par1 = 36 ; par2 = 1.3 ; par3 = 1 ; par4 = 1 ; par5 = 12 ;
Parameters (R input):
par1 = FALSE ; par2 = 1 ; par3 = 1 ; par4 = 1 ; par5 = 12 ; par6 = 3 ; par7 = 1 ; par8 = 2 ; par9 = 1 ;
R code (references can be found in the software module):
library(lattice)
if (par1 == 'TRUE') par1 <- TRUE
if (par1 == 'FALSE') par1 <- FALSE
par2 <- as.numeric(par2) #Box-Cox lambda transformation parameter
par3 <- as.numeric(par3) #degree of non-seasonal differencing
par4 <- as.numeric(par4) #degree of seasonal differencing
par5 <- as.numeric(par5) #seasonal period
par6 <- as.numeric(par6) #degree (p) of the non-seasonal AR(p) polynomial
par7 <- as.numeric(par7) #degree (q) of the non-seasonal MA(q) polynomial
par8 <- as.numeric(par8) #degree (P) of the seasonal AR(P) polynomial
par9 <- as.numeric(par9) #degree (Q) of the seasonal MA(Q) polynomial
armaGR <- function(arima.out, names, n){
try1 <- arima.out$coef
try2 <- sqrt(diag(arima.out$var.coef))
try.data.frame <- data.frame(matrix(NA,ncol=4,nrow=length(names)))
dimnames(try.data.frame) <- list(names,c('coef','std','tstat','pv'))
try.data.frame[,1] <- try1
for(i in 1:length(try2)) try.data.frame[which(rownames(try.data.frame)==names(try2)[i]),2] <- try2[i]
try.data.frame[,3] <- try.data.frame[,1] / try.data.frame[,2]
try.data.frame[,4] <- round((1-pt(abs(try.data.frame[,3]),df=n-(length(try2)+1)))*2,5)
vector <- rep(NA,length(names))
vector[is.na(try.data.frame[,4])] <- 0
maxi <- which.max(try.data.frame[,4])
continue <- max(try.data.frame[,4],na.rm=TRUE) > .05
vector[maxi] <- 0
list(summary=try.data.frame,next.vector=vector,continue=continue)
}
arimaSelect <- function(series, order=c(13,0,0), seasonal=list(order=c(2,0,0),period=12), include.mean=F){
nrc <- order[1]+order[3]+seasonal$order[1]+seasonal$order[3]
coeff <- matrix(NA, nrow=nrc*2, ncol=nrc)
pval <- matrix(NA, nrow=nrc*2, ncol=nrc)
mylist <- rep(list(NULL), nrc)
names <- NULL
if(order[1] > 0) names <- paste('ar',1:order[1],sep='')
if(order[3] > 0) names <- c( names , paste('ma',1:order[3],sep='') )
if(seasonal$order[1] > 0) names <- c(names, paste('sar',1:seasonal$order[1],sep=''))
if(seasonal$order[3] > 0) names <- c(names, paste('sma',1:seasonal$order[3],sep=''))
arima.out <- arima(series, order=order, seasonal=seasonal, include.mean=include.mean, method='ML')
mylist[[1]] <- arima.out
last.arma <- armaGR(arima.out, names, length(series))
mystop <- FALSE
i <- 1
coeff[i,] <- last.arma[[1]][,1]
pval [i,] <- last.arma[[1]][,4]
i <- 2
aic <- arima.out$aic
while(!mystop){
mylist[[i]] <- arima.out
arima.out <- arima(series, order=order, seasonal=seasonal, include.mean=include.mean, method='ML', fixed=last.arma$next.vector)
aic <- c(aic, arima.out$aic)
last.arma <- armaGR(arima.out, names, length(series))
mystop <- !last.arma$continue
coeff[i,] <- last.arma[[1]][,1]
pval [i,] <- last.arma[[1]][,4]
i <- i+1
}
list(coeff, pval, mylist, aic=aic)
}
arimaSelectplot <- function(arimaSelect.out,noms,choix){
noms <- names(arimaSelect.out[[3]][[1]]$coef)
coeff <- arimaSelect.out[[1]]
k <- min(which(is.na(coeff[,1])))-1
coeff <- coeff[1:k,]
pval <- arimaSelect.out[[2]][1:k,]
aic <- arimaSelect.out$aic[1:k]
coeff[coeff==0] <- NA
n <- ncol(coeff)
if(missing(choix)) choix <- k
layout(matrix(c(1,1,1,2,
3,3,3,2,
3,3,3,4,
5,6,7,7),nr=4),
widths=c(10,35,45,15),
heights=c(30,30,15,15))
couleurs <- rainbow(75)[1:50]#(50)
ticks <- pretty(coeff)
par(mar=c(1,1,3,1))
plot(aic,k:1-.5,type='o',pch=21,bg='blue',cex=2,axes=F,lty=2,xpd=NA)
points(aic[choix],k-choix+.5,pch=21,cex=4,bg=2,xpd=NA)
title('aic',line=2)
par(mar=c(3,0,0,0))
plot(0,axes=F,xlab='',ylab='',xlim=range(ticks),ylim=c(.1,1))
rect(xleft = min(ticks) + (0:49)/50*(max(ticks)-min(ticks)),
xright = min(ticks) + (1:50)/50*(max(ticks)-min(ticks)),
ytop = rep(1,50),
ybottom= rep(0,50),col=couleurs,border=NA)
axis(1,ticks)
rect(xleft=min(ticks),xright=max(ticks),ytop=1,ybottom=0)
text(mean(coeff,na.rm=T),.5,'coefficients',cex=2,font=2)
par(mar=c(1,1,3,1))
image(1:n,1:k,t(coeff[k:1,]),axes=F,col=couleurs,zlim=range(ticks))
for(i in 1:n) for(j in 1:k) if(!is.na(coeff[j,i])) {
if(pval[j,i]<.01) symb = 'green'
else if( (pval[j,i]<.05) & (pval[j,i]>=.01)) symb = 'orange'
else if( (pval[j,i]<.1) & (pval[j,i]>=.05)) symb = 'red'
else symb = 'black'
polygon(c(i+.5 ,i+.2 ,i+.5 ,i+.5),
c(k-j+0.5,k-j+0.5,k-j+0.8,k-j+0.5),
col=symb)
if(j==choix) {
rect(xleft=i-.5,
xright=i+.5,
ybottom=k-j+1.5,
ytop=k-j+.5,
lwd=4)
text(i,
k-j+1,
round(coeff[j,i],2),
cex=1.2,
font=2)
}
else{
rect(xleft=i-.5,xright=i+.5,ybottom=k-j+1.5,ytop=k-j+.5)
text(i,k-j+1,round(coeff[j,i],2),cex=1.2,font=1)
}
}
axis(3,1:n,noms)
par(mar=c(0.5,0,0,0.5))
plot(0,axes=F,xlab='',ylab='',type='n',xlim=c(0,8),ylim=c(-.2,.8))
cols <- c('green','orange','red','black')
niv <- c('0','0.01','0.05','0.1')
for(i in 0:3){
polygon(c(1+2*i ,1+2*i ,1+2*i-.5 ,1+2*i),
c(.4 ,.7 , .4 , .4),
col=cols[i+1])
text(2*i,0.5,niv[i+1],cex=1.5)
}
text(8,.5,1,cex=1.5)
text(4,0,'p-value',cex=2)
box()
residus <- arimaSelect.out[[3]][[choix]]$res
par(mar=c(1,2,4,1))
acf(residus,main='')
title('acf',line=.5)
par(mar=c(1,2,4,1))
pacf(residus,main='')
title('pacf',line=.5)
par(mar=c(2,2,4,1))
qqnorm(residus,main='')
title('qq-norm',line=.5)
qqline(residus)
residus
}
if (par2 == 0) x <- log(x)
if (par2 != 0) x <- x^par2
(selection <- arimaSelect(x, order=c(par6,par3,par7), seasonal=list(order=c(par8,par4,par9), period=par5)))
bitmap(file='test1.png')
resid <- arimaSelectplot(selection)
dev.off()
resid
bitmap(file='test2.png')
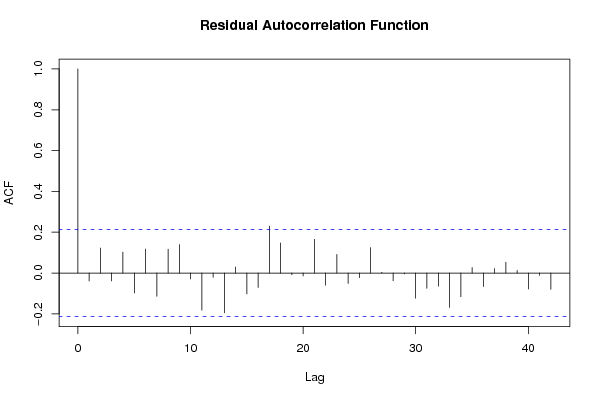
acf(resid,length(resid)/2, main='Residual Autocorrelation Function')
dev.off()
bitmap(file='test3.png')
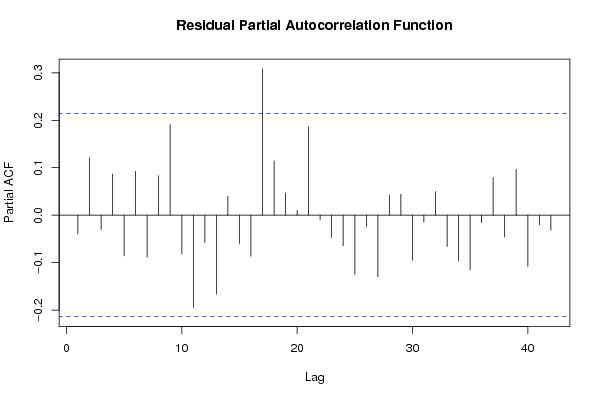
pacf(resid,length(resid)/2, main='Residual Partial Autocorrelation Function')
dev.off()
bitmap(file='test4.png')
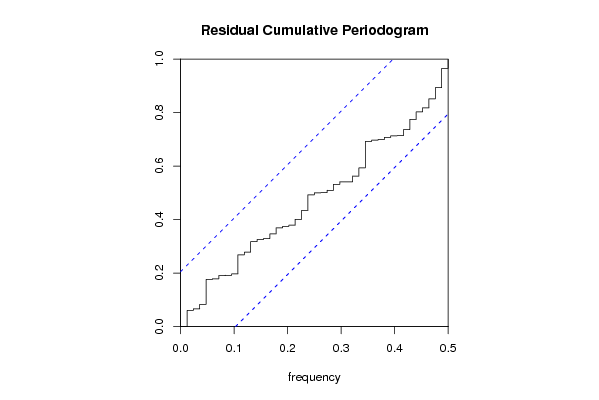
cpgram(resid, main='Residual Cumulative Periodogram')
dev.off()
bitmap(file='test5.png')
hist(resid, main='Residual Histogram', xlab='values of Residuals')
dev.off()
bitmap(file='test6.png')
densityplot(~resid,col='black',main='Residual Density Plot', xlab='values of Residuals')
dev.off()
bitmap(file='test7.png')
qqnorm(resid, main='Residual Normal Q-Q Plot')
qqline(resid)
dev.off()
ncols <- length(selection[[1]][1,])
nrows <- length(selection[[2]][,1])-1
load(file='createtable')
a<-table.start()
a<-table.row.start(a)
a<-table.element(a,'ARIMA Parameter Estimation and Backward Selection', ncols+1,TRUE)
a<-table.row.end(a)
a<-table.row.start(a)
a<-table.element(a,'Iteration', header=TRUE)
for (i in 1:ncols) {
a<-table.element(a,names(selection[[3]][[1]]$coef)[i],header=TRUE)
}
a<-table.row.end(a)
for (j in 1:nrows) {
a<-table.row.start(a)
mydum <- 'Estimates ('
mydum <- paste(mydum,j)
mydum <- paste(mydum,')')
a<-table.element(a,mydum, header=TRUE)
for (i in 1:ncols) {
a<-table.element(a,round(selection[[1]][j,i],4))
}
a<-table.row.end(a)
a<-table.row.start(a)
a<-table.element(a,'(p-val)', header=TRUE)
for (i in 1:ncols) {
mydum <- '('
mydum <- paste(mydum,round(selection[[2]][j,i],4),sep='')
mydum <- paste(mydum,')')
a<-table.element(a,mydum)
}
a<-table.row.end(a)
}
a<-table.end(a)
table.save(a,file='mytable.tab')
a<-table.start()
a<-table.row.start(a)
a<-table.element(a,'Estimated ARIMA Residuals', 1,TRUE)
a<-table.row.end(a)
a<-table.row.start(a)
a<-table.element(a,'Value', 1,TRUE)
a<-table.row.end(a)
for (i in (par4*par5+par3):length(resid)) {
a<-table.row.start(a)
a<-table.element(a,resid[i])
a<-table.row.end(a)
}
a<-table.end(a)
table.save(a,file='mytable1.tab')