Free Statistics

of Irreproducible Research!

Author's title

Author*The author of this computation has been verified*
R Software Modulerwasp_centraltendency.wasp
Title produced by softwareCentral Tendency
Date of computationSun, 14 Dec 2008 10:33:27 -0700
Cite this page as followsStatistical Computations at FreeStatistics.org, Office for Research Development and Education, URL https://freestatistics.org/blog/index.php?v=date/2008/Dec/14/t12292761365dicsp6ocoo0187.htm/, Retrieved Thu, 16 May 2024 00:31:27 +0000
Statistical Computations at FreeStatistics.org, Office for Research Development and Education, URL https://freestatistics.org/blog/index.php?pk=33500, Retrieved Thu, 16 May 2024 00:31:27 +0000
QR Codes:

Original text written by user:
IsPrivate?No (this computation is public)
User-defined keywordsgdm
Estimated Impact174
Family? (F = Feedback message, R = changed R code, M = changed R Module, P = changed Parameters, D = changed Data)
-     [Central Tendency] [Jongerenwerkloosheid] [2008-12-14 16:45:25] [11ac052cc87d77b9933b02bea117068e]
-    D    [Central Tendency] [Werkloosheid bij 50+] [2008-12-14 17:33:27] [99f79d508deef838ee89a56fb32f134e] [Current]
Feedback Forum

Post a new message
Dataseries X:
88900
87280
85519
83647
81616
80100
94027
102327
104296
101593
94816
93535
93618
92330
90751
88576
86102
85494
103432
108870
109713
106960
103195
102348
102158
100431
97649
95611
93035
93579
111777
116065
116609
112934
107660
107965
107772
106201
102288
99217
96511
96456
113021
117836
118492
113922
109317
107496
105524
103824
101833
99436
96915
96072
111941
116008
117557
113445
108762
106661
102824
101912
99005
97894
96256
95606
108948
111223
113142
106078
100992
97413


Summary of computational transaction
Raw Inputview raw input (R code)
Raw Outputview raw output of R engine
Computing time1 seconds
R Server'Gwilym Jenkins' @ 72.249.127.135

\begin{tabular}{lllllllll}
\hline
Summary of computational transaction \tabularnewline
Raw Input & view raw input (R code)  \tabularnewline
Raw Output & view raw output of R engine  \tabularnewline
Computing time & 1 seconds \tabularnewline
R Server & 'Gwilym Jenkins' @ 72.249.127.135 \tabularnewline
\hline
\end{tabular}
%Source: https://freestatistics.org/blog/index.php?pk=33500&T=0

[TABLE]
[ROW][C]Summary of computational transaction[/C][/ROW]
[ROW][C]Raw Input[/C][C]view raw input (R code) [/C][/ROW]
[ROW][C]Raw Output[/C][C]view raw output of R engine [/C][/ROW]
[ROW][C]Computing time[/C][C]1 seconds[/C][/ROW]
[ROW][C]R Server[/C][C]'Gwilym Jenkins' @ 72.249.127.135[/C][/ROW]
[/TABLE]
Source: https://freestatistics.org/blog/index.php?pk=33500&T=0

Globally Unique Identifier (entire table): ba.freestatistics.org/blog/index.php?pk=33500&T=0

As an alternative you can also use a QR Code:  

The GUIDs for individual cells are displayed in the table below:

Summary of computational transaction
Raw Inputview raw input (R code)
Raw Outputview raw output of R engine
Computing time1 seconds
R Server'Gwilym Jenkins' @ 72.249.127.135


Central Tendency - Ungrouped Data
MeasureValueS.E.Value/S.E.
Arithmetic Mean101698.8611111111111.9821323380691.45727989107
Geometric Mean101257.297512457
Harmonic Mean100805.759489791
Quadratic Mean102129.575314619
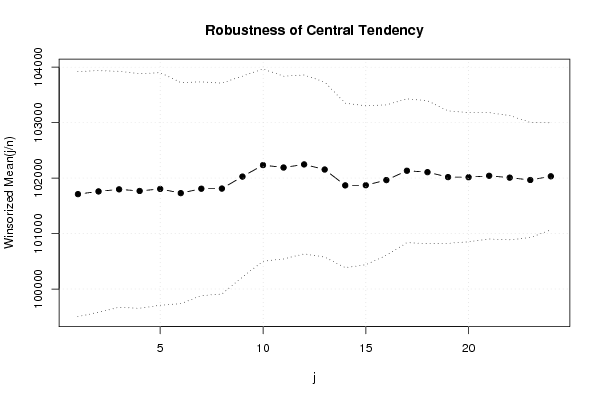
Winsorized Mean ( 1 / 24 )101710.8055555561104.4978257297892.0878277767106
Winsorized Mean ( 2 / 24 )101759.4722222221089.0690454457693.4371173689654
Winsorized Mean ( 3 / 24 )101796.9305555561063.8320134986595.688914475109
Winsorized Mean ( 4 / 24 )101768.0972222221057.6914023317096.2171924607427
Winsorized Mean ( 5 / 24 )101804.6251048.2854795196797.1153631228843
Winsorized Mean ( 6 / 24 )101728.958333333996.286175435379102.108170163937
Winsorized Mean ( 7 / 24 )101808.583333333963.27383963299105.690177750620
Winsorized Mean ( 8 / 24 )101810.916666667950.657634734025107.095249590197
Winsorized Mean ( 9 / 24 )102027.166666667905.63412427862112.658262240213
Winsorized Mean ( 10 / 24 )102234.388888889866.636303313266117.966889337584
Winsorized Mean ( 11 / 24 )102190.388888889823.679363039316124.065739017442
Winsorized Mean ( 12 / 24 )102246.388888889806.259560377027126.815722769323
Winsorized Mean ( 13 / 24 )102154.305555556788.616970890038129.53602233574
Winsorized Mean ( 14 / 24 )101868.277777778741.738788291163137.337131866145
Winsorized Mean ( 15 / 24 )101870.986111111716.305814408006142.217170462734
Winsorized Mean ( 16 / 24 )101964.319444444677.794575538963150.435431507202
Winsorized Mean ( 17 / 24 )102132.430555556648.012879524091157.608642949447
Winsorized Mean ( 18 / 24 )102106.680555556643.893127069242158.577062346210
Winsorized Mean ( 19 / 24 )102018.013888889596.614945332543170.994734018984
Winsorized Mean ( 20 / 24 )102015.513888889581.967137909046175.294285954738
Winsorized Mean ( 21 / 24 )102041.180555556569.325287160432179.231772866609
Winsorized Mean ( 22 / 24 )102007.875560.061611766047182.136880759132
Winsorized Mean ( 23 / 24 )101965.708333333518.861873860594196.518020440887
Winsorized Mean ( 24 / 24 )102032.041666667482.805139364559211.331722361024
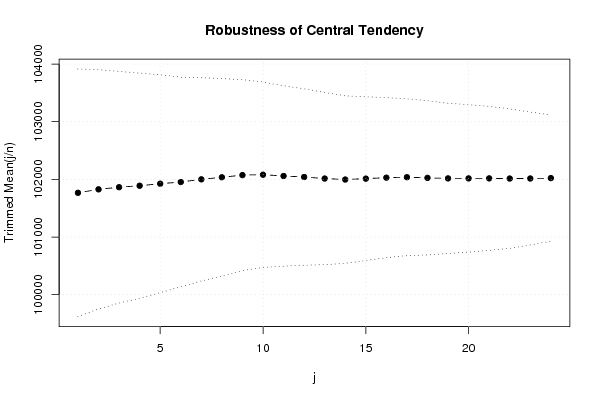
Trimmed Mean ( 1 / 24 )101767.5142857141074.0838984974894.7481983745178
Trimmed Mean ( 2 / 24 )101827.5588235291037.8730934528698.111762859911
Trimmed Mean ( 3 / 24 )101864.6969696971004.60426679017101.397834288687
Trimmed Mean ( 4 / 24 )101890.109375976.428546493462104.349785492145
Trimmed Mean ( 5 / 24 )101925.532258065944.681106386985107.894115346381
Trimmed Mean ( 6 / 24 )101954.55909.210698988616112.135229065619
Trimmed Mean ( 7 / 24 )102001.224137931881.294191477342115.740265991023
Trimmed Mean ( 8 / 24 )102036.607142857855.925774591151119.211980958976
Trimmed Mean ( 9 / 24 )102074.222222222827.644926375799123.330934521883
Trimmed Mean ( 10 / 24 )102081.461538462803.557530437072127.036904853517
Trimmed Mean ( 11 / 24 )102059.44782.334558717219130.454981008822
Trimmed Mean ( 12 / 24 )102041.583333333765.04269849859133.380246009264
Trimmed Mean ( 13 / 24 )102014.869565217746.405836047452136.674801613866
Trimmed Mean ( 14 / 24 )101997.318181818726.017091317064140.488866449115
Trimmed Mean ( 15 / 24 )102013.119047619709.778858595843143.725214990810
Trimmed Mean ( 16 / 24 )102030.175693.552324470797147.112440402896
Trimmed Mean ( 17 / 24 )102037.973684211680.180815938704150.015953542280
Trimmed Mean ( 18 / 24 )102026.861111111668.110864472829152.709477627811
Trimmed Mean ( 19 / 24 )102017.470588235651.270876387171156.643685887141
Trimmed Mean ( 20 / 24 )102017.40625639.098080556749159.627151690282
Trimmed Mean ( 21 / 24 )102017.633333333624.103617397818163.462653459201
Trimmed Mean ( 22 / 24 )102014.75604.328887088679168.806674940611
Trimmed Mean ( 23 / 24 )102015.615384615576.148949963791177.064655573922
Trimmed Mean ( 24 / 24 )102022.125547.22904523046186.434046016389
Median102223
Midrange99296
Midmean - Weighted Average at Xnp101853.324324324
Midmean - Weighted Average at X(n+1)p102026.861111111
Midmean - Empirical Distribution Function101853.324324324
Midmean - Empirical Distribution Function - Averaging102026.861111111
Midmean - Empirical Distribution Function - Interpolation102026.861111111
Midmean - Closest Observation101853.324324324
Midmean - True Basic - Statistics Graphics Toolkit102026.861111111
Midmean - MS Excel (old versions)102037.973684211
Number of observations72

\begin{tabular}{lllllllll}
\hline
Central Tendency - Ungrouped Data \tabularnewline
Measure & Value & S.E. & Value/S.E. \tabularnewline
Arithmetic Mean & 101698.861111111 & 1111.98213233806 & 91.45727989107 \tabularnewline
Geometric Mean & 101257.297512457 &  &  \tabularnewline
Harmonic Mean & 100805.759489791 &  &  \tabularnewline
Quadratic Mean & 102129.575314619 &  &  \tabularnewline
Winsorized Mean ( 1 / 24 ) & 101710.805555556 & 1104.49782572978 & 92.0878277767106 \tabularnewline
Winsorized Mean ( 2 / 24 ) & 101759.472222222 & 1089.06904544576 & 93.4371173689654 \tabularnewline
Winsorized Mean ( 3 / 24 ) & 101796.930555556 & 1063.83201349865 & 95.688914475109 \tabularnewline
Winsorized Mean ( 4 / 24 ) & 101768.097222222 & 1057.69140233170 & 96.2171924607427 \tabularnewline
Winsorized Mean ( 5 / 24 ) & 101804.625 & 1048.28547951967 & 97.1153631228843 \tabularnewline
Winsorized Mean ( 6 / 24 ) & 101728.958333333 & 996.286175435379 & 102.108170163937 \tabularnewline
Winsorized Mean ( 7 / 24 ) & 101808.583333333 & 963.27383963299 & 105.690177750620 \tabularnewline
Winsorized Mean ( 8 / 24 ) & 101810.916666667 & 950.657634734025 & 107.095249590197 \tabularnewline
Winsorized Mean ( 9 / 24 ) & 102027.166666667 & 905.63412427862 & 112.658262240213 \tabularnewline
Winsorized Mean ( 10 / 24 ) & 102234.388888889 & 866.636303313266 & 117.966889337584 \tabularnewline
Winsorized Mean ( 11 / 24 ) & 102190.388888889 & 823.679363039316 & 124.065739017442 \tabularnewline
Winsorized Mean ( 12 / 24 ) & 102246.388888889 & 806.259560377027 & 126.815722769323 \tabularnewline
Winsorized Mean ( 13 / 24 ) & 102154.305555556 & 788.616970890038 & 129.53602233574 \tabularnewline
Winsorized Mean ( 14 / 24 ) & 101868.277777778 & 741.738788291163 & 137.337131866145 \tabularnewline
Winsorized Mean ( 15 / 24 ) & 101870.986111111 & 716.305814408006 & 142.217170462734 \tabularnewline
Winsorized Mean ( 16 / 24 ) & 101964.319444444 & 677.794575538963 & 150.435431507202 \tabularnewline
Winsorized Mean ( 17 / 24 ) & 102132.430555556 & 648.012879524091 & 157.608642949447 \tabularnewline
Winsorized Mean ( 18 / 24 ) & 102106.680555556 & 643.893127069242 & 158.577062346210 \tabularnewline
Winsorized Mean ( 19 / 24 ) & 102018.013888889 & 596.614945332543 & 170.994734018984 \tabularnewline
Winsorized Mean ( 20 / 24 ) & 102015.513888889 & 581.967137909046 & 175.294285954738 \tabularnewline
Winsorized Mean ( 21 / 24 ) & 102041.180555556 & 569.325287160432 & 179.231772866609 \tabularnewline
Winsorized Mean ( 22 / 24 ) & 102007.875 & 560.061611766047 & 182.136880759132 \tabularnewline
Winsorized Mean ( 23 / 24 ) & 101965.708333333 & 518.861873860594 & 196.518020440887 \tabularnewline
Winsorized Mean ( 24 / 24 ) & 102032.041666667 & 482.805139364559 & 211.331722361024 \tabularnewline
Trimmed Mean ( 1 / 24 ) & 101767.514285714 & 1074.08389849748 & 94.7481983745178 \tabularnewline
Trimmed Mean ( 2 / 24 ) & 101827.558823529 & 1037.87309345286 & 98.111762859911 \tabularnewline
Trimmed Mean ( 3 / 24 ) & 101864.696969697 & 1004.60426679017 & 101.397834288687 \tabularnewline
Trimmed Mean ( 4 / 24 ) & 101890.109375 & 976.428546493462 & 104.349785492145 \tabularnewline
Trimmed Mean ( 5 / 24 ) & 101925.532258065 & 944.681106386985 & 107.894115346381 \tabularnewline
Trimmed Mean ( 6 / 24 ) & 101954.55 & 909.210698988616 & 112.135229065619 \tabularnewline
Trimmed Mean ( 7 / 24 ) & 102001.224137931 & 881.294191477342 & 115.740265991023 \tabularnewline
Trimmed Mean ( 8 / 24 ) & 102036.607142857 & 855.925774591151 & 119.211980958976 \tabularnewline
Trimmed Mean ( 9 / 24 ) & 102074.222222222 & 827.644926375799 & 123.330934521883 \tabularnewline
Trimmed Mean ( 10 / 24 ) & 102081.461538462 & 803.557530437072 & 127.036904853517 \tabularnewline
Trimmed Mean ( 11 / 24 ) & 102059.44 & 782.334558717219 & 130.454981008822 \tabularnewline
Trimmed Mean ( 12 / 24 ) & 102041.583333333 & 765.04269849859 & 133.380246009264 \tabularnewline
Trimmed Mean ( 13 / 24 ) & 102014.869565217 & 746.405836047452 & 136.674801613866 \tabularnewline
Trimmed Mean ( 14 / 24 ) & 101997.318181818 & 726.017091317064 & 140.488866449115 \tabularnewline
Trimmed Mean ( 15 / 24 ) & 102013.119047619 & 709.778858595843 & 143.725214990810 \tabularnewline
Trimmed Mean ( 16 / 24 ) & 102030.175 & 693.552324470797 & 147.112440402896 \tabularnewline
Trimmed Mean ( 17 / 24 ) & 102037.973684211 & 680.180815938704 & 150.015953542280 \tabularnewline
Trimmed Mean ( 18 / 24 ) & 102026.861111111 & 668.110864472829 & 152.709477627811 \tabularnewline
Trimmed Mean ( 19 / 24 ) & 102017.470588235 & 651.270876387171 & 156.643685887141 \tabularnewline
Trimmed Mean ( 20 / 24 ) & 102017.40625 & 639.098080556749 & 159.627151690282 \tabularnewline
Trimmed Mean ( 21 / 24 ) & 102017.633333333 & 624.103617397818 & 163.462653459201 \tabularnewline
Trimmed Mean ( 22 / 24 ) & 102014.75 & 604.328887088679 & 168.806674940611 \tabularnewline
Trimmed Mean ( 23 / 24 ) & 102015.615384615 & 576.148949963791 & 177.064655573922 \tabularnewline
Trimmed Mean ( 24 / 24 ) & 102022.125 & 547.22904523046 & 186.434046016389 \tabularnewline
Median & 102223 &  &  \tabularnewline
Midrange & 99296 &  &  \tabularnewline
Midmean - Weighted Average at Xnp & 101853.324324324 &  &  \tabularnewline
Midmean - Weighted Average at X(n+1)p & 102026.861111111 &  &  \tabularnewline
Midmean - Empirical Distribution Function & 101853.324324324 &  &  \tabularnewline
Midmean - Empirical Distribution Function - Averaging & 102026.861111111 &  &  \tabularnewline
Midmean - Empirical Distribution Function - Interpolation & 102026.861111111 &  &  \tabularnewline
Midmean - Closest Observation & 101853.324324324 &  &  \tabularnewline
Midmean - True Basic - Statistics Graphics Toolkit & 102026.861111111 &  &  \tabularnewline
Midmean - MS Excel (old versions) & 102037.973684211 &  &  \tabularnewline
Number of observations & 72 &  &  \tabularnewline
\hline
\end{tabular}
%Source: https://freestatistics.org/blog/index.php?pk=33500&T=1

[TABLE]
[ROW][C]Central Tendency - Ungrouped Data[/C][/ROW]
[ROW][C]Measure[/C][C]Value[/C][C]S.E.[/C][C]Value/S.E.[/C][/ROW]
[ROW][C]Arithmetic Mean[/C][C]101698.861111111[/C][C]1111.98213233806[/C][C]91.45727989107[/C][/ROW]
[ROW][C]Geometric Mean[/C][C]101257.297512457[/C][C][/C][C][/C][/ROW]
[ROW][C]Harmonic Mean[/C][C]100805.759489791[/C][C][/C][C][/C][/ROW]
[ROW][C]Quadratic Mean[/C][C]102129.575314619[/C][C][/C][C][/C][/ROW]
[ROW][C]Winsorized Mean ( 1 / 24 )[/C][C]101710.805555556[/C][C]1104.49782572978[/C][C]92.0878277767106[/C][/ROW]
[ROW][C]Winsorized Mean ( 2 / 24 )[/C][C]101759.472222222[/C][C]1089.06904544576[/C][C]93.4371173689654[/C][/ROW]
[ROW][C]Winsorized Mean ( 3 / 24 )[/C][C]101796.930555556[/C][C]1063.83201349865[/C][C]95.688914475109[/C][/ROW]
[ROW][C]Winsorized Mean ( 4 / 24 )[/C][C]101768.097222222[/C][C]1057.69140233170[/C][C]96.2171924607427[/C][/ROW]
[ROW][C]Winsorized Mean ( 5 / 24 )[/C][C]101804.625[/C][C]1048.28547951967[/C][C]97.1153631228843[/C][/ROW]
[ROW][C]Winsorized Mean ( 6 / 24 )[/C][C]101728.958333333[/C][C]996.286175435379[/C][C]102.108170163937[/C][/ROW]
[ROW][C]Winsorized Mean ( 7 / 24 )[/C][C]101808.583333333[/C][C]963.27383963299[/C][C]105.690177750620[/C][/ROW]
[ROW][C]Winsorized Mean ( 8 / 24 )[/C][C]101810.916666667[/C][C]950.657634734025[/C][C]107.095249590197[/C][/ROW]
[ROW][C]Winsorized Mean ( 9 / 24 )[/C][C]102027.166666667[/C][C]905.63412427862[/C][C]112.658262240213[/C][/ROW]
[ROW][C]Winsorized Mean ( 10 / 24 )[/C][C]102234.388888889[/C][C]866.636303313266[/C][C]117.966889337584[/C][/ROW]
[ROW][C]Winsorized Mean ( 11 / 24 )[/C][C]102190.388888889[/C][C]823.679363039316[/C][C]124.065739017442[/C][/ROW]
[ROW][C]Winsorized Mean ( 12 / 24 )[/C][C]102246.388888889[/C][C]806.259560377027[/C][C]126.815722769323[/C][/ROW]
[ROW][C]Winsorized Mean ( 13 / 24 )[/C][C]102154.305555556[/C][C]788.616970890038[/C][C]129.53602233574[/C][/ROW]
[ROW][C]Winsorized Mean ( 14 / 24 )[/C][C]101868.277777778[/C][C]741.738788291163[/C][C]137.337131866145[/C][/ROW]
[ROW][C]Winsorized Mean ( 15 / 24 )[/C][C]101870.986111111[/C][C]716.305814408006[/C][C]142.217170462734[/C][/ROW]
[ROW][C]Winsorized Mean ( 16 / 24 )[/C][C]101964.319444444[/C][C]677.794575538963[/C][C]150.435431507202[/C][/ROW]
[ROW][C]Winsorized Mean ( 17 / 24 )[/C][C]102132.430555556[/C][C]648.012879524091[/C][C]157.608642949447[/C][/ROW]
[ROW][C]Winsorized Mean ( 18 / 24 )[/C][C]102106.680555556[/C][C]643.893127069242[/C][C]158.577062346210[/C][/ROW]
[ROW][C]Winsorized Mean ( 19 / 24 )[/C][C]102018.013888889[/C][C]596.614945332543[/C][C]170.994734018984[/C][/ROW]
[ROW][C]Winsorized Mean ( 20 / 24 )[/C][C]102015.513888889[/C][C]581.967137909046[/C][C]175.294285954738[/C][/ROW]
[ROW][C]Winsorized Mean ( 21 / 24 )[/C][C]102041.180555556[/C][C]569.325287160432[/C][C]179.231772866609[/C][/ROW]
[ROW][C]Winsorized Mean ( 22 / 24 )[/C][C]102007.875[/C][C]560.061611766047[/C][C]182.136880759132[/C][/ROW]
[ROW][C]Winsorized Mean ( 23 / 24 )[/C][C]101965.708333333[/C][C]518.861873860594[/C][C]196.518020440887[/C][/ROW]
[ROW][C]Winsorized Mean ( 24 / 24 )[/C][C]102032.041666667[/C][C]482.805139364559[/C][C]211.331722361024[/C][/ROW]
[ROW][C]Trimmed Mean ( 1 / 24 )[/C][C]101767.514285714[/C][C]1074.08389849748[/C][C]94.7481983745178[/C][/ROW]
[ROW][C]Trimmed Mean ( 2 / 24 )[/C][C]101827.558823529[/C][C]1037.87309345286[/C][C]98.111762859911[/C][/ROW]
[ROW][C]Trimmed Mean ( 3 / 24 )[/C][C]101864.696969697[/C][C]1004.60426679017[/C][C]101.397834288687[/C][/ROW]
[ROW][C]Trimmed Mean ( 4 / 24 )[/C][C]101890.109375[/C][C]976.428546493462[/C][C]104.349785492145[/C][/ROW]
[ROW][C]Trimmed Mean ( 5 / 24 )[/C][C]101925.532258065[/C][C]944.681106386985[/C][C]107.894115346381[/C][/ROW]
[ROW][C]Trimmed Mean ( 6 / 24 )[/C][C]101954.55[/C][C]909.210698988616[/C][C]112.135229065619[/C][/ROW]
[ROW][C]Trimmed Mean ( 7 / 24 )[/C][C]102001.224137931[/C][C]881.294191477342[/C][C]115.740265991023[/C][/ROW]
[ROW][C]Trimmed Mean ( 8 / 24 )[/C][C]102036.607142857[/C][C]855.925774591151[/C][C]119.211980958976[/C][/ROW]
[ROW][C]Trimmed Mean ( 9 / 24 )[/C][C]102074.222222222[/C][C]827.644926375799[/C][C]123.330934521883[/C][/ROW]
[ROW][C]Trimmed Mean ( 10 / 24 )[/C][C]102081.461538462[/C][C]803.557530437072[/C][C]127.036904853517[/C][/ROW]
[ROW][C]Trimmed Mean ( 11 / 24 )[/C][C]102059.44[/C][C]782.334558717219[/C][C]130.454981008822[/C][/ROW]
[ROW][C]Trimmed Mean ( 12 / 24 )[/C][C]102041.583333333[/C][C]765.04269849859[/C][C]133.380246009264[/C][/ROW]
[ROW][C]Trimmed Mean ( 13 / 24 )[/C][C]102014.869565217[/C][C]746.405836047452[/C][C]136.674801613866[/C][/ROW]
[ROW][C]Trimmed Mean ( 14 / 24 )[/C][C]101997.318181818[/C][C]726.017091317064[/C][C]140.488866449115[/C][/ROW]
[ROW][C]Trimmed Mean ( 15 / 24 )[/C][C]102013.119047619[/C][C]709.778858595843[/C][C]143.725214990810[/C][/ROW]
[ROW][C]Trimmed Mean ( 16 / 24 )[/C][C]102030.175[/C][C]693.552324470797[/C][C]147.112440402896[/C][/ROW]
[ROW][C]Trimmed Mean ( 17 / 24 )[/C][C]102037.973684211[/C][C]680.180815938704[/C][C]150.015953542280[/C][/ROW]
[ROW][C]Trimmed Mean ( 18 / 24 )[/C][C]102026.861111111[/C][C]668.110864472829[/C][C]152.709477627811[/C][/ROW]
[ROW][C]Trimmed Mean ( 19 / 24 )[/C][C]102017.470588235[/C][C]651.270876387171[/C][C]156.643685887141[/C][/ROW]
[ROW][C]Trimmed Mean ( 20 / 24 )[/C][C]102017.40625[/C][C]639.098080556749[/C][C]159.627151690282[/C][/ROW]
[ROW][C]Trimmed Mean ( 21 / 24 )[/C][C]102017.633333333[/C][C]624.103617397818[/C][C]163.462653459201[/C][/ROW]
[ROW][C]Trimmed Mean ( 22 / 24 )[/C][C]102014.75[/C][C]604.328887088679[/C][C]168.806674940611[/C][/ROW]
[ROW][C]Trimmed Mean ( 23 / 24 )[/C][C]102015.615384615[/C][C]576.148949963791[/C][C]177.064655573922[/C][/ROW]
[ROW][C]Trimmed Mean ( 24 / 24 )[/C][C]102022.125[/C][C]547.22904523046[/C][C]186.434046016389[/C][/ROW]
[ROW][C]Median[/C][C]102223[/C][C][/C][C][/C][/ROW]
[ROW][C]Midrange[/C][C]99296[/C][C][/C][C][/C][/ROW]
[ROW][C]Midmean - Weighted Average at Xnp[/C][C]101853.324324324[/C][C][/C][C][/C][/ROW]
[ROW][C]Midmean - Weighted Average at X(n+1)p[/C][C]102026.861111111[/C][C][/C][C][/C][/ROW]
[ROW][C]Midmean - Empirical Distribution Function[/C][C]101853.324324324[/C][C][/C][C][/C][/ROW]
[ROW][C]Midmean - Empirical Distribution Function - Averaging[/C][C]102026.861111111[/C][C][/C][C][/C][/ROW]
[ROW][C]Midmean - Empirical Distribution Function - Interpolation[/C][C]102026.861111111[/C][C][/C][C][/C][/ROW]
[ROW][C]Midmean - Closest Observation[/C][C]101853.324324324[/C][C][/C][C][/C][/ROW]
[ROW][C]Midmean - True Basic - Statistics Graphics Toolkit[/C][C]102026.861111111[/C][C][/C][C][/C][/ROW]
[ROW][C]Midmean - MS Excel (old versions)[/C][C]102037.973684211[/C][C][/C][C][/C][/ROW]
[ROW][C]Number of observations[/C][C]72[/C][C][/C][C][/C][/ROW]
[/TABLE]
Source: https://freestatistics.org/blog/index.php?pk=33500&T=1

Globally Unique Identifier (entire table): ba.freestatistics.org/blog/index.php?pk=33500&T=1

As an alternative you can also use a QR Code:  

The GUIDs for individual cells are displayed in the table below:

Central Tendency - Ungrouped Data
MeasureValueS.E.Value/S.E.
Arithmetic Mean101698.8611111111111.9821323380691.45727989107
Geometric Mean101257.297512457
Harmonic Mean100805.759489791
Quadratic Mean102129.575314619
Winsorized Mean ( 1 / 24 )101710.8055555561104.4978257297892.0878277767106
Winsorized Mean ( 2 / 24 )101759.4722222221089.0690454457693.4371173689654
Winsorized Mean ( 3 / 24 )101796.9305555561063.8320134986595.688914475109
Winsorized Mean ( 4 / 24 )101768.0972222221057.6914023317096.2171924607427
Winsorized Mean ( 5 / 24 )101804.6251048.2854795196797.1153631228843
Winsorized Mean ( 6 / 24 )101728.958333333996.286175435379102.108170163937
Winsorized Mean ( 7 / 24 )101808.583333333963.27383963299105.690177750620
Winsorized Mean ( 8 / 24 )101810.916666667950.657634734025107.095249590197
Winsorized Mean ( 9 / 24 )102027.166666667905.63412427862112.658262240213
Winsorized Mean ( 10 / 24 )102234.388888889866.636303313266117.966889337584
Winsorized Mean ( 11 / 24 )102190.388888889823.679363039316124.065739017442
Winsorized Mean ( 12 / 24 )102246.388888889806.259560377027126.815722769323
Winsorized Mean ( 13 / 24 )102154.305555556788.616970890038129.53602233574
Winsorized Mean ( 14 / 24 )101868.277777778741.738788291163137.337131866145
Winsorized Mean ( 15 / 24 )101870.986111111716.305814408006142.217170462734
Winsorized Mean ( 16 / 24 )101964.319444444677.794575538963150.435431507202
Winsorized Mean ( 17 / 24 )102132.430555556648.012879524091157.608642949447
Winsorized Mean ( 18 / 24 )102106.680555556643.893127069242158.577062346210
Winsorized Mean ( 19 / 24 )102018.013888889596.614945332543170.994734018984
Winsorized Mean ( 20 / 24 )102015.513888889581.967137909046175.294285954738
Winsorized Mean ( 21 / 24 )102041.180555556569.325287160432179.231772866609
Winsorized Mean ( 22 / 24 )102007.875560.061611766047182.136880759132
Winsorized Mean ( 23 / 24 )101965.708333333518.861873860594196.518020440887
Winsorized Mean ( 24 / 24 )102032.041666667482.805139364559211.331722361024
Trimmed Mean ( 1 / 24 )101767.5142857141074.0838984974894.7481983745178
Trimmed Mean ( 2 / 24 )101827.5588235291037.8730934528698.111762859911
Trimmed Mean ( 3 / 24 )101864.6969696971004.60426679017101.397834288687
Trimmed Mean ( 4 / 24 )101890.109375976.428546493462104.349785492145
Trimmed Mean ( 5 / 24 )101925.532258065944.681106386985107.894115346381
Trimmed Mean ( 6 / 24 )101954.55909.210698988616112.135229065619
Trimmed Mean ( 7 / 24 )102001.224137931881.294191477342115.740265991023
Trimmed Mean ( 8 / 24 )102036.607142857855.925774591151119.211980958976
Trimmed Mean ( 9 / 24 )102074.222222222827.644926375799123.330934521883
Trimmed Mean ( 10 / 24 )102081.461538462803.557530437072127.036904853517
Trimmed Mean ( 11 / 24 )102059.44782.334558717219130.454981008822
Trimmed Mean ( 12 / 24 )102041.583333333765.04269849859133.380246009264
Trimmed Mean ( 13 / 24 )102014.869565217746.405836047452136.674801613866
Trimmed Mean ( 14 / 24 )101997.318181818726.017091317064140.488866449115
Trimmed Mean ( 15 / 24 )102013.119047619709.778858595843143.725214990810
Trimmed Mean ( 16 / 24 )102030.175693.552324470797147.112440402896
Trimmed Mean ( 17 / 24 )102037.973684211680.180815938704150.015953542280
Trimmed Mean ( 18 / 24 )102026.861111111668.110864472829152.709477627811
Trimmed Mean ( 19 / 24 )102017.470588235651.270876387171156.643685887141
Trimmed Mean ( 20 / 24 )102017.40625639.098080556749159.627151690282
Trimmed Mean ( 21 / 24 )102017.633333333624.103617397818163.462653459201
Trimmed Mean ( 22 / 24 )102014.75604.328887088679168.806674940611
Trimmed Mean ( 23 / 24 )102015.615384615576.148949963791177.064655573922
Trimmed Mean ( 24 / 24 )102022.125547.22904523046186.434046016389
Median102223
Midrange99296
Midmean - Weighted Average at Xnp101853.324324324
Midmean - Weighted Average at X(n+1)p102026.861111111
Midmean - Empirical Distribution Function101853.324324324
Midmean - Empirical Distribution Function - Averaging102026.861111111
Midmean - Empirical Distribution Function - Interpolation102026.861111111
Midmean - Closest Observation101853.324324324
Midmean - True Basic - Statistics Graphics Toolkit102026.861111111
Midmean - MS Excel (old versions)102037.973684211
Number of observations72


Parameters (Session):
Parameters (R input):
R code (references can be found in the software module):
geomean <- function(x) {
return(exp(mean(log(x))))
}
harmean <- function(x) {
return(1/mean(1/x))
}
quamean <- function(x) {
return(sqrt(mean(x*x)))
}
winmean <- function(x) {
x <-sort(x[!is.na(x)])
n<-length(x)
denom <- 3
nodenom <- n/denom
if (nodenom>40) denom <- n/40
sqrtn = sqrt(n)
roundnodenom = floor(nodenom)
win <- array(NA,dim=c(roundnodenom,2))
for (j in 1:roundnodenom) {
win[j,1] <- (j*x[j+1]+sum(x[(j+1):(n-j)])+j*x[n-j])/n
win[j,2] <- sd(c(rep(x[j+1],j),x[(j+1):(n-j)],rep(x[n-j],j)))/sqrtn
}
return(win)
}
trimean <- function(x) {
x <-sort(x[!is.na(x)])
n<-length(x)
denom <- 3
nodenom <- n/denom
if (nodenom>40) denom <- n/40
sqrtn = sqrt(n)
roundnodenom = floor(nodenom)
tri <- array(NA,dim=c(roundnodenom,2))
for (j in 1:roundnodenom) {
tri[j,1] <- mean(x,trim=j/n)
tri[j,2] <- sd(x[(j+1):(n-j)]) / sqrt(n-j*2)
}
return(tri)
}
midrange <- function(x) {
return((max(x)+min(x))/2)
}
q1 <- function(data,n,p,i,f) {
np <- n*p;
i <<- floor(np)
f <<- np - i
qvalue <- (1-f)*data[i] + f*data[i+1]
}
q2 <- function(data,n,p,i,f) {
np <- (n+1)*p
i <<- floor(np)
f <<- np - i
qvalue <- (1-f)*data[i] + f*data[i+1]
}
q3 <- function(data,n,p,i,f) {
np <- n*p
i <<- floor(np)
f <<- np - i
if (f==0) {
qvalue <- data[i]
} else {
qvalue <- data[i+1]
}
}
q4 <- function(data,n,p,i,f) {
np <- n*p
i <<- floor(np)
f <<- np - i
if (f==0) {
qvalue <- (data[i]+data[i+1])/2
} else {
qvalue <- data[i+1]
}
}
q5 <- function(data,n,p,i,f) {
np <- (n-1)*p
i <<- floor(np)
f <<- np - i
if (f==0) {
qvalue <- data[i+1]
} else {
qvalue <- data[i+1] + f*(data[i+2]-data[i+1])
}
}
q6 <- function(data,n,p,i,f) {
np <- n*p+0.5
i <<- floor(np)
f <<- np - i
qvalue <- data[i]
}
q7 <- function(data,n,p,i,f) {
np <- (n+1)*p
i <<- floor(np)
f <<- np - i
if (f==0) {
qvalue <- data[i]
} else {
qvalue <- f*data[i] + (1-f)*data[i+1]
}
}
q8 <- function(data,n,p,i,f) {
np <- (n+1)*p
i <<- floor(np)
f <<- np - i
if (f==0) {
qvalue <- data[i]
} else {
if (f == 0.5) {
qvalue <- (data[i]+data[i+1])/2
} else {
if (f < 0.5) {
qvalue <- data[i]
} else {
qvalue <- data[i+1]
}
}
}
}
midmean <- function(x,def) {
x <-sort(x[!is.na(x)])
n<-length(x)
if (def==1) {
qvalue1 <- q1(x,n,0.25,i,f)
qvalue3 <- q1(x,n,0.75,i,f)
}
if (def==2) {
qvalue1 <- q2(x,n,0.25,i,f)
qvalue3 <- q2(x,n,0.75,i,f)
}
if (def==3) {
qvalue1 <- q3(x,n,0.25,i,f)
qvalue3 <- q3(x,n,0.75,i,f)
}
if (def==4) {
qvalue1 <- q4(x,n,0.25,i,f)
qvalue3 <- q4(x,n,0.75,i,f)
}
if (def==5) {
qvalue1 <- q5(x,n,0.25,i,f)
qvalue3 <- q5(x,n,0.75,i,f)
}
if (def==6) {
qvalue1 <- q6(x,n,0.25,i,f)
qvalue3 <- q6(x,n,0.75,i,f)
}
if (def==7) {
qvalue1 <- q7(x,n,0.25,i,f)
qvalue3 <- q7(x,n,0.75,i,f)
}
if (def==8) {
qvalue1 <- q8(x,n,0.25,i,f)
qvalue3 <- q8(x,n,0.75,i,f)
}
midm <- 0
myn <- 0
roundno4 <- round(n/4)
round3no4 <- round(3*n/4)
for (i in 1:n) {
if ((x[i]>=qvalue1) & (x[i]<=qvalue3)){
midm = midm + x[i]
myn = myn + 1
}
}
midm = midm / myn
return(midm)
}
(arm <- mean(x))
sqrtn <- sqrt(length(x))
(armse <- sd(x) / sqrtn)
(armose <- arm / armse)
(geo <- geomean(x))
(har <- harmean(x))
(qua <- quamean(x))
(win <- winmean(x))
(tri <- trimean(x))
(midr <- midrange(x))
midm <- array(NA,dim=8)
for (j in 1:8) midm[j] <- midmean(x,j)
midm
bitmap(file='test1.png')
lb <- win[,1] - 2*win[,2]
ub <- win[,1] + 2*win[,2]
if ((ylimmin == '') | (ylimmax == '')) plot(win[,1],type='b',main=main, xlab='j', pch=19, ylab='Winsorized Mean(j/n)', ylim=c(min(lb),max(ub))) else plot(win[,1],type='l',main=main, xlab='j', pch=19, ylab='Winsorized Mean(j/n)', ylim=c(ylimmin,ylimmax))
lines(ub,lty=3)
lines(lb,lty=3)
grid()
dev.off()
bitmap(file='test2.png')
lb <- tri[,1] - 2*tri[,2]
ub <- tri[,1] + 2*tri[,2]
if ((ylimmin == '') | (ylimmax == '')) plot(tri[,1],type='b',main=main, xlab='j', pch=19, ylab='Trimmed Mean(j/n)', ylim=c(min(lb),max(ub))) else plot(tri[,1],type='l',main=main, xlab='j', pch=19, ylab='Trimmed Mean(j/n)', ylim=c(ylimmin,ylimmax))
lines(ub,lty=3)
lines(lb,lty=3)
grid()
dev.off()
load(file='createtable')
a<-table.start()
a<-table.row.start(a)
a<-table.element(a,'Central Tendency - Ungrouped Data',4,TRUE)
a<-table.row.end(a)
a<-table.row.start(a)
a<-table.element(a,'Measure',header=TRUE)
a<-table.element(a,'Value',header=TRUE)
a<-table.element(a,'S.E.',header=TRUE)
a<-table.element(a,'Value/S.E.',header=TRUE)
a<-table.row.end(a)
a<-table.row.start(a)
a<-table.element(a,hyperlink('arithmetic_mean.htm', 'Arithmetic Mean', 'click to view the definition of the Arithmetic Mean'),header=TRUE)
a<-table.element(a,arm)
a<-table.element(a,hyperlink('arithmetic_mean_standard_error.htm', armse, 'click to view the definition of the Standard Error of the Arithmetic Mean'))
a<-table.element(a,armose)
a<-table.row.end(a)
a<-table.row.start(a)
a<-table.element(a,hyperlink('geometric_mean.htm', 'Geometric Mean', 'click to view the definition of the Geometric Mean'),header=TRUE)
a<-table.element(a,geo)
a<-table.element(a,'')
a<-table.row.end(a)
a<-table.row.start(a)
a<-table.element(a,hyperlink('harmonic_mean.htm', 'Harmonic Mean', 'click to view the definition of the Harmonic Mean'),header=TRUE)
a<-table.element(a,har)
a<-table.element(a,'')
a<-table.row.end(a)
a<-table.row.start(a)
a<-table.element(a,hyperlink('quadratic_mean.htm', 'Quadratic Mean', 'click to view the definition of the Quadratic Mean'),header=TRUE)
a<-table.element(a,qua)
a<-table.element(a,'')
a<-table.row.end(a)
for (j in 1:length(win[,1])) {
a<-table.row.start(a)
mylabel <- paste('Winsorized Mean (',j)
mylabel <- paste(mylabel,'/')
mylabel <- paste(mylabel,length(win[,1]))
mylabel <- paste(mylabel,')')
a<-table.element(a,hyperlink('winsorized_mean.htm', mylabel, 'click to view the definition of the Winsorized Mean'),header=TRUE)
a<-table.element(a,win[j,1])
a<-table.element(a,win[j,2])
a<-table.element(a,win[j,1]/win[j,2])
a<-table.row.end(a)
}
for (j in 1:length(tri[,1])) {
a<-table.row.start(a)
mylabel <- paste('Trimmed Mean (',j)
mylabel <- paste(mylabel,'/')
mylabel <- paste(mylabel,length(tri[,1]))
mylabel <- paste(mylabel,')')
a<-table.element(a,hyperlink('arithmetic_mean.htm', mylabel, 'click to view the definition of the Trimmed Mean'),header=TRUE)
a<-table.element(a,tri[j,1])
a<-table.element(a,tri[j,2])
a<-table.element(a,tri[j,1]/tri[j,2])
a<-table.row.end(a)
}
a<-table.row.start(a)
a<-table.element(a,hyperlink('median_1.htm', 'Median', 'click to view the definition of the Median'),header=TRUE)
a<-table.element(a,median(x))
a<-table.element(a,'')
a<-table.row.end(a)
a<-table.row.start(a)
a<-table.element(a,hyperlink('midrange.htm', 'Midrange', 'click to view the definition of the Midrange'),header=TRUE)
a<-table.element(a,midr)
a<-table.element(a,'')
a<-table.row.end(a)
a<-table.row.start(a)
mymid <- hyperlink('midmean.htm', 'Midmean', 'click to view the definition of the Midmean')
mylabel <- paste(mymid,hyperlink('method_1.htm','Weighted Average at Xnp',''),sep=' - ')
a<-table.element(a,mylabel,header=TRUE)
a<-table.element(a,midm[1])
a<-table.element(a,'')
a<-table.row.end(a)
a<-table.row.start(a)
mymid <- hyperlink('midmean.htm', 'Midmean', 'click to view the definition of the Midmean')
mylabel <- paste(mymid,hyperlink('method_2.htm','Weighted Average at X(n+1)p',''),sep=' - ')
a<-table.element(a,mylabel,header=TRUE)
a<-table.element(a,midm[2])
a<-table.element(a,'')
a<-table.row.end(a)
a<-table.row.start(a)
mymid <- hyperlink('midmean.htm', 'Midmean', 'click to view the definition of the Midmean')
mylabel <- paste(mymid,hyperlink('method_3.htm','Empirical Distribution Function',''),sep=' - ')
a<-table.element(a,mylabel,header=TRUE)
a<-table.element(a,midm[3])
a<-table.element(a,'')
a<-table.row.end(a)
a<-table.row.start(a)
mymid <- hyperlink('midmean.htm', 'Midmean', 'click to view the definition of the Midmean')
mylabel <- paste(mymid,hyperlink('method_4.htm','Empirical Distribution Function - Averaging',''),sep=' - ')
a<-table.element(a,mylabel,header=TRUE)
a<-table.element(a,midm[4])
a<-table.element(a,'')
a<-table.row.end(a)
a<-table.row.start(a)
mymid <- hyperlink('midmean.htm', 'Midmean', 'click to view the definition of the Midmean')
mylabel <- paste(mymid,hyperlink('method_5.htm','Empirical Distribution Function - Interpolation',''),sep=' - ')
a<-table.element(a,mylabel,header=TRUE)
a<-table.element(a,midm[5])
a<-table.element(a,'')
a<-table.row.end(a)
a<-table.row.start(a)
mymid <- hyperlink('midmean.htm', 'Midmean', 'click to view the definition of the Midmean')
mylabel <- paste(mymid,hyperlink('method_6.htm','Closest Observation',''),sep=' - ')
a<-table.element(a,mylabel,header=TRUE)
a<-table.element(a,midm[6])
a<-table.element(a,'')
a<-table.row.end(a)
a<-table.row.start(a)
mymid <- hyperlink('midmean.htm', 'Midmean', 'click to view the definition of the Midmean')
mylabel <- paste(mymid,hyperlink('method_7.htm','True Basic - Statistics Graphics Toolkit',''),sep=' - ')
a<-table.element(a,mylabel,header=TRUE)
a<-table.element(a,midm[7])
a<-table.element(a,'')
a<-table.row.end(a)
a<-table.row.start(a)
mymid <- hyperlink('midmean.htm', 'Midmean', 'click to view the definition of the Midmean')
mylabel <- paste(mymid,hyperlink('method_8.htm','MS Excel (old versions)',''),sep=' - ')
a<-table.element(a,mylabel,header=TRUE)
a<-table.element(a,midm[8])
a<-table.element(a,'')
a<-table.row.end(a)
a<-table.row.start(a)
a<-table.element(a,'Number of observations',header=TRUE)
a<-table.element(a,length(x))
a<-table.element(a,'')
a<-table.row.end(a)
a<-table.end(a)
table.save(a,file='mytable.tab')