Free Statistics

of Irreproducible Research!

Author's title

Author*Unverified author*
R Software Modulerwasp_arimabackwardselection.wasp
Title produced by softwareARIMA Backward Selection
Date of computationSun, 14 Dec 2008 10:10:44 -0700
Cite this page as followsStatistical Computations at FreeStatistics.org, Office for Research Development and Education, URL https://freestatistics.org/blog/index.php?v=date/2008/Dec/14/t1229274703gv4awumftm4q0tv.htm/, Retrieved Wed, 15 May 2024 05:26:13 +0000
Statistical Computations at FreeStatistics.org, Office for Research Development and Education, URL https://freestatistics.org/blog/index.php?pk=33489, Retrieved Wed, 15 May 2024 05:26:13 +0000
QR Codes:

Original text written by user:
IsPrivate?No (this computation is public)
User-defined keywords
Estimated Impact224
Family? (F = Feedback message, R = changed R code, M = changed R Module, P = changed Parameters, D = changed Data)
-     [(Partial) Autocorrelation Function] [paper autocorrela...] [2008-12-14 16:25:08] [85134b6edb9973b9193450dd2306c65b]
-   P   [(Partial) Autocorrelation Function] [paper autocorrela...] [2008-12-14 16:31:59] [85134b6edb9973b9193450dd2306c65b]
- RMP     [Spectral Analysis] [paper spectrale a...] [2008-12-14 16:40:55] [85134b6edb9973b9193450dd2306c65b]
-   P       [Spectral Analysis] [paper spectrale a...] [2008-12-14 16:47:07] [85134b6edb9973b9193450dd2306c65b]
- RMP           [ARIMA Backward Selection] [paper arima backw...] [2008-12-14 17:10:44] [4940af498c7c54f3992f17142bd40069] [Current]
Feedback Forum

Post a new message
Dataseries X:
111078
150739
159129
157928
147768
137507
136919
136151
133001
125554
119647
114158
116193
152803
161761
160942
149470
139208
134588
130322
126611
122401
117352
112135
112879
148729
157230
157221
146681
136524
132111
125326
122716
116615
113719
110737
112093
143565
149946
149147
134339
122683
115614
116566
111272
104609
101802
94542
93051
124129
130374
123946
114971
105531
104919
104782
101281
94545
93248
84031
87486


Summary of computational transaction
Raw Inputview raw input (R code)
Raw Outputview raw output of R engine
Computing time7 seconds
R Server'George Udny Yule' @ 72.249.76.132

\begin{tabular}{lllllllll}
\hline
Summary of computational transaction \tabularnewline
Raw Input & view raw input (R code)  \tabularnewline
Raw Output & view raw output of R engine  \tabularnewline
Computing time & 7 seconds \tabularnewline
R Server & 'George Udny Yule' @ 72.249.76.132 \tabularnewline
\hline
\end{tabular}
%Source: https://freestatistics.org/blog/index.php?pk=33489&T=0

[TABLE]
[ROW][C]Summary of computational transaction[/C][/ROW]
[ROW][C]Raw Input[/C][C]view raw input (R code) [/C][/ROW]
[ROW][C]Raw Output[/C][C]view raw output of R engine [/C][/ROW]
[ROW][C]Computing time[/C][C]7 seconds[/C][/ROW]
[ROW][C]R Server[/C][C]'George Udny Yule' @ 72.249.76.132[/C][/ROW]
[/TABLE]
Source: https://freestatistics.org/blog/index.php?pk=33489&T=0

Globally Unique Identifier (entire table): ba.freestatistics.org/blog/index.php?pk=33489&T=0

As an alternative you can also use a QR Code:  

The GUIDs for individual cells are displayed in the table below:

Summary of computational transaction
Raw Inputview raw input (R code)
Raw Outputview raw output of R engine
Computing time7 seconds
R Server'George Udny Yule' @ 72.249.76.132


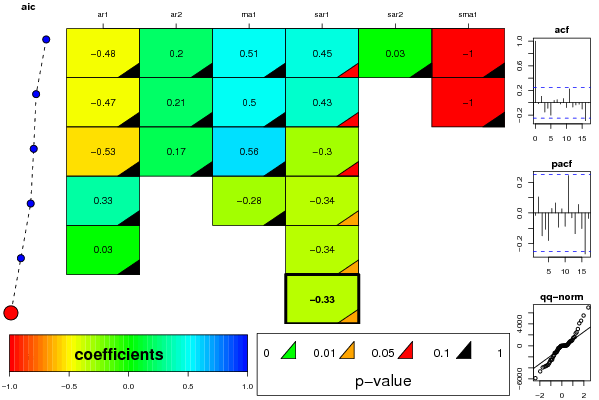
ARIMA Parameter Estimation and Backward Selection
Iterationar1ar2ma1sar1sar2sma1
Estimates ( 1 )-0.47950.20380.51020.44530.0289-0.9993
(p-val)(0.2428 )(0.2076 )(0.2007 )(0.0829 )(0.9118 )(0.165 )
Estimates ( 2 )-0.47480.20760.50480.43460-0.9977
(p-val)(0.2428 )(0.1912 )(0.2004 )(0.0688 )(NA )(0.2473 )
Estimates ( 3 )-0.53280.16610.5607-0.299300
(p-val)(0.1898 )(0.2825 )(0.1522 )(0.0693 )(NA )(NA )
Estimates ( 4 )0.32840-0.2818-0.344300
(p-val)(0.7086 )(NA )(0.7507 )(0.0356 )(NA )(NA )
Estimates ( 5 )0.030100-0.341100
(p-val)(0.8459 )(NA )(NA )(0.0397 )(NA )(NA )
Estimates ( 6 )000-0.332600
(p-val)(NA )(NA )(NA )(0.0384 )(NA )(NA )
Estimates ( 7 )NANANANANANA
(p-val)(NA )(NA )(NA )(NA )(NA )(NA )
Estimates ( 8 )NANANANANANA
(p-val)(NA )(NA )(NA )(NA )(NA )(NA )
Estimates ( 9 )NANANANANANA
(p-val)(NA )(NA )(NA )(NA )(NA )(NA )
Estimates ( 10 )NANANANANANA
(p-val)(NA )(NA )(NA )(NA )(NA )(NA )
Estimates ( 11 )NANANANANANA
(p-val)(NA )(NA )(NA )(NA )(NA )(NA )

\begin{tabular}{lllllllll}
\hline
ARIMA Parameter Estimation and Backward Selection \tabularnewline
Iteration & ar1 & ar2 & ma1 & sar1 & sar2 & sma1 \tabularnewline
Estimates ( 1 ) & -0.4795 & 0.2038 & 0.5102 & 0.4453 & 0.0289 & -0.9993 \tabularnewline
(p-val) & (0.2428 ) & (0.2076 ) & (0.2007 ) & (0.0829 ) & (0.9118 ) & (0.165 ) \tabularnewline
Estimates ( 2 ) & -0.4748 & 0.2076 & 0.5048 & 0.4346 & 0 & -0.9977 \tabularnewline
(p-val) & (0.2428 ) & (0.1912 ) & (0.2004 ) & (0.0688 ) & (NA ) & (0.2473 ) \tabularnewline
Estimates ( 3 ) & -0.5328 & 0.1661 & 0.5607 & -0.2993 & 0 & 0 \tabularnewline
(p-val) & (0.1898 ) & (0.2825 ) & (0.1522 ) & (0.0693 ) & (NA ) & (NA ) \tabularnewline
Estimates ( 4 ) & 0.3284 & 0 & -0.2818 & -0.3443 & 0 & 0 \tabularnewline
(p-val) & (0.7086 ) & (NA ) & (0.7507 ) & (0.0356 ) & (NA ) & (NA ) \tabularnewline
Estimates ( 5 ) & 0.0301 & 0 & 0 & -0.3411 & 0 & 0 \tabularnewline
(p-val) & (0.8459 ) & (NA ) & (NA ) & (0.0397 ) & (NA ) & (NA ) \tabularnewline
Estimates ( 6 ) & 0 & 0 & 0 & -0.3326 & 0 & 0 \tabularnewline
(p-val) & (NA ) & (NA ) & (NA ) & (0.0384 ) & (NA ) & (NA ) \tabularnewline
Estimates ( 7 ) & NA & NA & NA & NA & NA & NA \tabularnewline
(p-val) & (NA ) & (NA ) & (NA ) & (NA ) & (NA ) & (NA ) \tabularnewline
Estimates ( 8 ) & NA & NA & NA & NA & NA & NA \tabularnewline
(p-val) & (NA ) & (NA ) & (NA ) & (NA ) & (NA ) & (NA ) \tabularnewline
Estimates ( 9 ) & NA & NA & NA & NA & NA & NA \tabularnewline
(p-val) & (NA ) & (NA ) & (NA ) & (NA ) & (NA ) & (NA ) \tabularnewline
Estimates ( 10 ) & NA & NA & NA & NA & NA & NA \tabularnewline
(p-val) & (NA ) & (NA ) & (NA ) & (NA ) & (NA ) & (NA ) \tabularnewline
Estimates ( 11 ) & NA & NA & NA & NA & NA & NA \tabularnewline
(p-val) & (NA ) & (NA ) & (NA ) & (NA ) & (NA ) & (NA ) \tabularnewline
\hline
\end{tabular}
%Source: https://freestatistics.org/blog/index.php?pk=33489&T=1

[TABLE]
[ROW][C]ARIMA Parameter Estimation and Backward Selection[/C][/ROW]
[ROW][C]Iteration[/C][C]ar1[/C][C]ar2[/C][C]ma1[/C][C]sar1[/C][C]sar2[/C][C]sma1[/C][/ROW]
[ROW][C]Estimates ( 1 )[/C][C]-0.4795[/C][C]0.2038[/C][C]0.5102[/C][C]0.4453[/C][C]0.0289[/C][C]-0.9993[/C][/ROW]
[ROW][C](p-val)[/C][C](0.2428 )[/C][C](0.2076 )[/C][C](0.2007 )[/C][C](0.0829 )[/C][C](0.9118 )[/C][C](0.165 )[/C][/ROW]
[ROW][C]Estimates ( 2 )[/C][C]-0.4748[/C][C]0.2076[/C][C]0.5048[/C][C]0.4346[/C][C]0[/C][C]-0.9977[/C][/ROW]
[ROW][C](p-val)[/C][C](0.2428 )[/C][C](0.1912 )[/C][C](0.2004 )[/C][C](0.0688 )[/C][C](NA )[/C][C](0.2473 )[/C][/ROW]
[ROW][C]Estimates ( 3 )[/C][C]-0.5328[/C][C]0.1661[/C][C]0.5607[/C][C]-0.2993[/C][C]0[/C][C]0[/C][/ROW]
[ROW][C](p-val)[/C][C](0.1898 )[/C][C](0.2825 )[/C][C](0.1522 )[/C][C](0.0693 )[/C][C](NA )[/C][C](NA )[/C][/ROW]
[ROW][C]Estimates ( 4 )[/C][C]0.3284[/C][C]0[/C][C]-0.2818[/C][C]-0.3443[/C][C]0[/C][C]0[/C][/ROW]
[ROW][C](p-val)[/C][C](0.7086 )[/C][C](NA )[/C][C](0.7507 )[/C][C](0.0356 )[/C][C](NA )[/C][C](NA )[/C][/ROW]
[ROW][C]Estimates ( 5 )[/C][C]0.0301[/C][C]0[/C][C]0[/C][C]-0.3411[/C][C]0[/C][C]0[/C][/ROW]
[ROW][C](p-val)[/C][C](0.8459 )[/C][C](NA )[/C][C](NA )[/C][C](0.0397 )[/C][C](NA )[/C][C](NA )[/C][/ROW]
[ROW][C]Estimates ( 6 )[/C][C]0[/C][C]0[/C][C]0[/C][C]-0.3326[/C][C]0[/C][C]0[/C][/ROW]
[ROW][C](p-val)[/C][C](NA )[/C][C](NA )[/C][C](NA )[/C][C](0.0384 )[/C][C](NA )[/C][C](NA )[/C][/ROW]
[ROW][C]Estimates ( 7 )[/C][C]NA[/C][C]NA[/C][C]NA[/C][C]NA[/C][C]NA[/C][C]NA[/C][/ROW]
[ROW][C](p-val)[/C][C](NA )[/C][C](NA )[/C][C](NA )[/C][C](NA )[/C][C](NA )[/C][C](NA )[/C][/ROW]
[ROW][C]Estimates ( 8 )[/C][C]NA[/C][C]NA[/C][C]NA[/C][C]NA[/C][C]NA[/C][C]NA[/C][/ROW]
[ROW][C](p-val)[/C][C](NA )[/C][C](NA )[/C][C](NA )[/C][C](NA )[/C][C](NA )[/C][C](NA )[/C][/ROW]
[ROW][C]Estimates ( 9 )[/C][C]NA[/C][C]NA[/C][C]NA[/C][C]NA[/C][C]NA[/C][C]NA[/C][/ROW]
[ROW][C](p-val)[/C][C](NA )[/C][C](NA )[/C][C](NA )[/C][C](NA )[/C][C](NA )[/C][C](NA )[/C][/ROW]
[ROW][C]Estimates ( 10 )[/C][C]NA[/C][C]NA[/C][C]NA[/C][C]NA[/C][C]NA[/C][C]NA[/C][/ROW]
[ROW][C](p-val)[/C][C](NA )[/C][C](NA )[/C][C](NA )[/C][C](NA )[/C][C](NA )[/C][C](NA )[/C][/ROW]
[ROW][C]Estimates ( 11 )[/C][C]NA[/C][C]NA[/C][C]NA[/C][C]NA[/C][C]NA[/C][C]NA[/C][/ROW]
[ROW][C](p-val)[/C][C](NA )[/C][C](NA )[/C][C](NA )[/C][C](NA )[/C][C](NA )[/C][C](NA )[/C][/ROW]
[/TABLE]
Source: https://freestatistics.org/blog/index.php?pk=33489&T=1

Globally Unique Identifier (entire table): ba.freestatistics.org/blog/index.php?pk=33489&T=1

As an alternative you can also use a QR Code:  

The GUIDs for individual cells are displayed in the table below:

ARIMA Parameter Estimation and Backward Selection
Iterationar1ar2ma1sar1sar2sma1
Estimates ( 1 )-0.47950.20380.51020.44530.0289-0.9993
(p-val)(0.2428 )(0.2076 )(0.2007 )(0.0829 )(0.9118 )(0.165 )
Estimates ( 2 )-0.47480.20760.50480.43460-0.9977
(p-val)(0.2428 )(0.1912 )(0.2004 )(0.0688 )(NA )(0.2473 )
Estimates ( 3 )-0.53280.16610.5607-0.299300
(p-val)(0.1898 )(0.2825 )(0.1522 )(0.0693 )(NA )(NA )
Estimates ( 4 )0.32840-0.2818-0.344300
(p-val)(0.7086 )(NA )(0.7507 )(0.0356 )(NA )(NA )
Estimates ( 5 )0.030100-0.341100
(p-val)(0.8459 )(NA )(NA )(0.0397 )(NA )(NA )
Estimates ( 6 )000-0.332600
(p-val)(NA )(NA )(NA )(0.0384 )(NA )(NA )
Estimates ( 7 )NANANANANANA
(p-val)(NA )(NA )(NA )(NA )(NA )(NA )
Estimates ( 8 )NANANANANANA
(p-val)(NA )(NA )(NA )(NA )(NA )(NA )
Estimates ( 9 )NANANANANANA
(p-val)(NA )(NA )(NA )(NA )(NA )(NA )
Estimates ( 10 )NANANANANANA
(p-val)(NA )(NA )(NA )(NA )(NA )(NA )
Estimates ( 11 )NANANANANANA
(p-val)(NA )(NA )(NA )(NA )(NA )(NA )


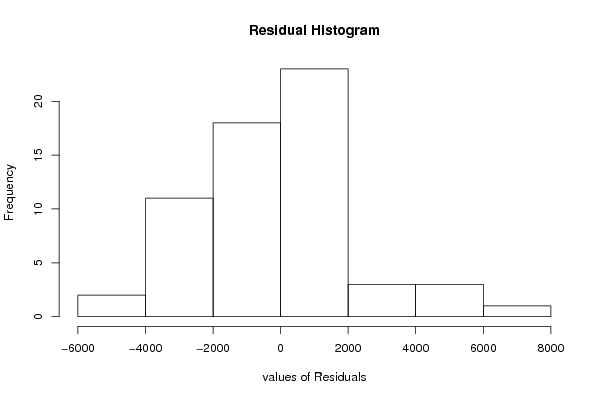
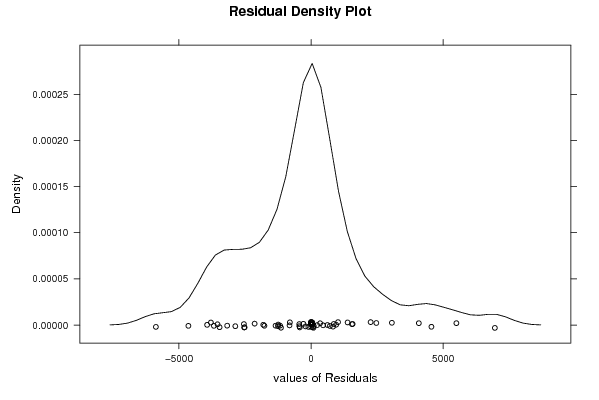
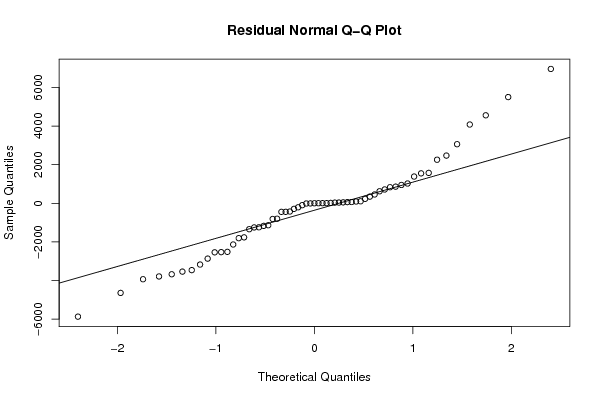
Estimated ARIMA Residuals
Value
-443.994616131804
-2866.74390296410
620.270632996506
342.799877211276
-1244.39288187103
35.9404839386439
-3790.51839505596
-3174.35150557420
-428.675566291783
3058.26375608028
714.228182433652
229.892825046677
-1251.45342411839
-1765.34397913717
-208.965923169142
948.23657889668
456.129521475996
90.051969658519
-1171.46289975519
-3676.93690275175
1021.56471884699
-814.291055815784
2469.3859542895
2254.04256647304
101.460424796041
-4642.40951644642
-2136.07034392408
-445.093278779037
-3934.60834249752
-1344.09026272426
-2541.27803915783
6955.72288846756
-2515.81420302557
-1137.41724062325
859.775416065502
-3540.47062024887
-2532.25212053464
-1807.78486924128
-802.225474329956
-5872.56498804211
4555.03073444599
1572.72267536412
5499.64739530876
1382.71325369163
830.758347587995
-291.153311403905
1548.33828212760
-3462.65899356001
4077.89188384594

\begin{tabular}{lllllllll}
\hline
Estimated ARIMA Residuals \tabularnewline
Value \tabularnewline
-443.994616131804 \tabularnewline
-2866.74390296410 \tabularnewline
620.270632996506 \tabularnewline
342.799877211276 \tabularnewline
-1244.39288187103 \tabularnewline
35.9404839386439 \tabularnewline
-3790.51839505596 \tabularnewline
-3174.35150557420 \tabularnewline
-428.675566291783 \tabularnewline
3058.26375608028 \tabularnewline
714.228182433652 \tabularnewline
229.892825046677 \tabularnewline
-1251.45342411839 \tabularnewline
-1765.34397913717 \tabularnewline
-208.965923169142 \tabularnewline
948.23657889668 \tabularnewline
456.129521475996 \tabularnewline
90.051969658519 \tabularnewline
-1171.46289975519 \tabularnewline
-3676.93690275175 \tabularnewline
1021.56471884699 \tabularnewline
-814.291055815784 \tabularnewline
2469.3859542895 \tabularnewline
2254.04256647304 \tabularnewline
101.460424796041 \tabularnewline
-4642.40951644642 \tabularnewline
-2136.07034392408 \tabularnewline
-445.093278779037 \tabularnewline
-3934.60834249752 \tabularnewline
-1344.09026272426 \tabularnewline
-2541.27803915783 \tabularnewline
6955.72288846756 \tabularnewline
-2515.81420302557 \tabularnewline
-1137.41724062325 \tabularnewline
859.775416065502 \tabularnewline
-3540.47062024887 \tabularnewline
-2532.25212053464 \tabularnewline
-1807.78486924128 \tabularnewline
-802.225474329956 \tabularnewline
-5872.56498804211 \tabularnewline
4555.03073444599 \tabularnewline
1572.72267536412 \tabularnewline
5499.64739530876 \tabularnewline
1382.71325369163 \tabularnewline
830.758347587995 \tabularnewline
-291.153311403905 \tabularnewline
1548.33828212760 \tabularnewline
-3462.65899356001 \tabularnewline
4077.89188384594 \tabularnewline
\hline
\end{tabular}
%Source: https://freestatistics.org/blog/index.php?pk=33489&T=2

[TABLE]
[ROW][C]Estimated ARIMA Residuals[/C][/ROW]
[ROW][C]Value[/C][/ROW]
[ROW][C]-443.994616131804[/C][/ROW]
[ROW][C]-2866.74390296410[/C][/ROW]
[ROW][C]620.270632996506[/C][/ROW]
[ROW][C]342.799877211276[/C][/ROW]
[ROW][C]-1244.39288187103[/C][/ROW]
[ROW][C]35.9404839386439[/C][/ROW]
[ROW][C]-3790.51839505596[/C][/ROW]
[ROW][C]-3174.35150557420[/C][/ROW]
[ROW][C]-428.675566291783[/C][/ROW]
[ROW][C]3058.26375608028[/C][/ROW]
[ROW][C]714.228182433652[/C][/ROW]
[ROW][C]229.892825046677[/C][/ROW]
[ROW][C]-1251.45342411839[/C][/ROW]
[ROW][C]-1765.34397913717[/C][/ROW]
[ROW][C]-208.965923169142[/C][/ROW]
[ROW][C]948.23657889668[/C][/ROW]
[ROW][C]456.129521475996[/C][/ROW]
[ROW][C]90.051969658519[/C][/ROW]
[ROW][C]-1171.46289975519[/C][/ROW]
[ROW][C]-3676.93690275175[/C][/ROW]
[ROW][C]1021.56471884699[/C][/ROW]
[ROW][C]-814.291055815784[/C][/ROW]
[ROW][C]2469.3859542895[/C][/ROW]
[ROW][C]2254.04256647304[/C][/ROW]
[ROW][C]101.460424796041[/C][/ROW]
[ROW][C]-4642.40951644642[/C][/ROW]
[ROW][C]-2136.07034392408[/C][/ROW]
[ROW][C]-445.093278779037[/C][/ROW]
[ROW][C]-3934.60834249752[/C][/ROW]
[ROW][C]-1344.09026272426[/C][/ROW]
[ROW][C]-2541.27803915783[/C][/ROW]
[ROW][C]6955.72288846756[/C][/ROW]
[ROW][C]-2515.81420302557[/C][/ROW]
[ROW][C]-1137.41724062325[/C][/ROW]
[ROW][C]859.775416065502[/C][/ROW]
[ROW][C]-3540.47062024887[/C][/ROW]
[ROW][C]-2532.25212053464[/C][/ROW]
[ROW][C]-1807.78486924128[/C][/ROW]
[ROW][C]-802.225474329956[/C][/ROW]
[ROW][C]-5872.56498804211[/C][/ROW]
[ROW][C]4555.03073444599[/C][/ROW]
[ROW][C]1572.72267536412[/C][/ROW]
[ROW][C]5499.64739530876[/C][/ROW]
[ROW][C]1382.71325369163[/C][/ROW]
[ROW][C]830.758347587995[/C][/ROW]
[ROW][C]-291.153311403905[/C][/ROW]
[ROW][C]1548.33828212760[/C][/ROW]
[ROW][C]-3462.65899356001[/C][/ROW]
[ROW][C]4077.89188384594[/C][/ROW]
[/TABLE]
Source: https://freestatistics.org/blog/index.php?pk=33489&T=2

Globally Unique Identifier (entire table): ba.freestatistics.org/blog/index.php?pk=33489&T=2

As an alternative you can also use a QR Code:  

The GUIDs for individual cells are displayed in the table below:

Estimated ARIMA Residuals
Value
-443.994616131804
-2866.74390296410
620.270632996506
342.799877211276
-1244.39288187103
35.9404839386439
-3790.51839505596
-3174.35150557420
-428.675566291783
3058.26375608028
714.228182433652
229.892825046677
-1251.45342411839
-1765.34397913717
-208.965923169142
948.23657889668
456.129521475996
90.051969658519
-1171.46289975519
-3676.93690275175
1021.56471884699
-814.291055815784
2469.3859542895
2254.04256647304
101.460424796041
-4642.40951644642
-2136.07034392408
-445.093278779037
-3934.60834249752
-1344.09026272426
-2541.27803915783
6955.72288846756
-2515.81420302557
-1137.41724062325
859.775416065502
-3540.47062024887
-2532.25212053464
-1807.78486924128
-802.225474329956
-5872.56498804211
4555.03073444599
1572.72267536412
5499.64739530876
1382.71325369163
830.758347587995
-291.153311403905
1548.33828212760
-3462.65899356001
4077.89188384594


Parameters (Session):
par1 = FALSE ; par2 = 1 ; par3 = 1 ; par4 = 1 ; par5 = 12 ; par6 = 2 ; par7 = 1 ; par8 = 2 ; par9 = 1 ;
Parameters (R input):
par1 = FALSE ; par2 = 1 ; par3 = 1 ; par4 = 1 ; par5 = 12 ; par6 = 2 ; par7 = 1 ; par8 = 2 ; par9 = 1 ;
R code (references can be found in the software module):
library(lattice)
if (par1 == 'TRUE') par1 <- TRUE
if (par1 == 'FALSE') par1 <- FALSE
par2 <- as.numeric(par2) #Box-Cox lambda transformation parameter
par3 <- as.numeric(par3) #degree of non-seasonal differencing
par4 <- as.numeric(par4) #degree of seasonal differencing
par5 <- as.numeric(par5) #seasonal period
par6 <- as.numeric(par6) #degree (p) of the non-seasonal AR(p) polynomial
par7 <- as.numeric(par7) #degree (q) of the non-seasonal MA(q) polynomial
par8 <- as.numeric(par8) #degree (P) of the seasonal AR(P) polynomial
par9 <- as.numeric(par9) #degree (Q) of the seasonal MA(Q) polynomial
armaGR <- function(arima.out, names, n){
try1 <- arima.out$coef
try2 <- sqrt(diag(arima.out$var.coef))
try.data.frame <- data.frame(matrix(NA,ncol=4,nrow=length(names)))
dimnames(try.data.frame) <- list(names,c('coef','std','tstat','pv'))
try.data.frame[,1] <- try1
for(i in 1:length(try2)) try.data.frame[which(rownames(try.data.frame)==names(try2)[i]),2] <- try2[i]
try.data.frame[,3] <- try.data.frame[,1] / try.data.frame[,2]
try.data.frame[,4] <- round((1-pt(abs(try.data.frame[,3]),df=n-(length(try2)+1)))*2,5)
vector <- rep(NA,length(names))
vector[is.na(try.data.frame[,4])] <- 0
maxi <- which.max(try.data.frame[,4])
continue <- max(try.data.frame[,4],na.rm=TRUE) > .05
vector[maxi] <- 0
list(summary=try.data.frame,next.vector=vector,continue=continue)
}
arimaSelect <- function(series, order=c(13,0,0), seasonal=list(order=c(2,0,0),period=12), include.mean=F){
nrc <- order[1]+order[3]+seasonal$order[1]+seasonal$order[3]
coeff <- matrix(NA, nrow=nrc*2, ncol=nrc)
pval <- matrix(NA, nrow=nrc*2, ncol=nrc)
mylist <- rep(list(NULL), nrc)
names <- NULL
if(order[1] > 0) names <- paste('ar',1:order[1],sep='')
if(order[3] > 0) names <- c( names , paste('ma',1:order[3],sep='') )
if(seasonal$order[1] > 0) names <- c(names, paste('sar',1:seasonal$order[1],sep=''))
if(seasonal$order[3] > 0) names <- c(names, paste('sma',1:seasonal$order[3],sep=''))
arima.out <- arima(series, order=order, seasonal=seasonal, include.mean=include.mean, method='ML')
mylist[[1]] <- arima.out
last.arma <- armaGR(arima.out, names, length(series))
mystop <- FALSE
i <- 1
coeff[i,] <- last.arma[[1]][,1]
pval [i,] <- last.arma[[1]][,4]
i <- 2
aic <- arima.out$aic
while(!mystop){
mylist[[i]] <- arima.out
arima.out <- arima(series, order=order, seasonal=seasonal, include.mean=include.mean, method='ML', fixed=last.arma$next.vector)
aic <- c(aic, arima.out$aic)
last.arma <- armaGR(arima.out, names, length(series))
mystop <- !last.arma$continue
coeff[i,] <- last.arma[[1]][,1]
pval [i,] <- last.arma[[1]][,4]
i <- i+1
}
list(coeff, pval, mylist, aic=aic)
}
arimaSelectplot <- function(arimaSelect.out,noms,choix){
noms <- names(arimaSelect.out[[3]][[1]]$coef)
coeff <- arimaSelect.out[[1]]
k <- min(which(is.na(coeff[,1])))-1
coeff <- coeff[1:k,]
pval <- arimaSelect.out[[2]][1:k,]
aic <- arimaSelect.out$aic[1:k]
coeff[coeff==0] <- NA
n <- ncol(coeff)
if(missing(choix)) choix <- k
layout(matrix(c(1,1,1,2,
3,3,3,2,
3,3,3,4,
5,6,7,7),nr=4),
widths=c(10,35,45,15),
heights=c(30,30,15,15))
couleurs <- rainbow(75)[1:50]#(50)
ticks <- pretty(coeff)
par(mar=c(1,1,3,1))
plot(aic,k:1-.5,type='o',pch=21,bg='blue',cex=2,axes=F,lty=2,xpd=NA)
points(aic[choix],k-choix+.5,pch=21,cex=4,bg=2,xpd=NA)
title('aic',line=2)
par(mar=c(3,0,0,0))
plot(0,axes=F,xlab='',ylab='',xlim=range(ticks),ylim=c(.1,1))
rect(xleft = min(ticks) + (0:49)/50*(max(ticks)-min(ticks)),
xright = min(ticks) + (1:50)/50*(max(ticks)-min(ticks)),
ytop = rep(1,50),
ybottom= rep(0,50),col=couleurs,border=NA)
axis(1,ticks)
rect(xleft=min(ticks),xright=max(ticks),ytop=1,ybottom=0)
text(mean(coeff,na.rm=T),.5,'coefficients',cex=2,font=2)
par(mar=c(1,1,3,1))
image(1:n,1:k,t(coeff[k:1,]),axes=F,col=couleurs,zlim=range(ticks))
for(i in 1:n) for(j in 1:k) if(!is.na(coeff[j,i])) {
if(pval[j,i]<.01) symb = 'green'
else if( (pval[j,i]<.05) & (pval[j,i]>=.01)) symb = 'orange'
else if( (pval[j,i]<.1) & (pval[j,i]>=.05)) symb = 'red'
else symb = 'black'
polygon(c(i+.5 ,i+.2 ,i+.5 ,i+.5),
c(k-j+0.5,k-j+0.5,k-j+0.8,k-j+0.5),
col=symb)
if(j==choix) {
rect(xleft=i-.5,
xright=i+.5,
ybottom=k-j+1.5,
ytop=k-j+.5,
lwd=4)
text(i,
k-j+1,
round(coeff[j,i],2),
cex=1.2,
font=2)
}
else{
rect(xleft=i-.5,xright=i+.5,ybottom=k-j+1.5,ytop=k-j+.5)
text(i,k-j+1,round(coeff[j,i],2),cex=1.2,font=1)
}
}
axis(3,1:n,noms)
par(mar=c(0.5,0,0,0.5))
plot(0,axes=F,xlab='',ylab='',type='n',xlim=c(0,8),ylim=c(-.2,.8))
cols <- c('green','orange','red','black')
niv <- c('0','0.01','0.05','0.1')
for(i in 0:3){
polygon(c(1+2*i ,1+2*i ,1+2*i-.5 ,1+2*i),
c(.4 ,.7 , .4 , .4),
col=cols[i+1])
text(2*i,0.5,niv[i+1],cex=1.5)
}
text(8,.5,1,cex=1.5)
text(4,0,'p-value',cex=2)
box()
residus <- arimaSelect.out[[3]][[choix]]$res
par(mar=c(1,2,4,1))
acf(residus,main='')
title('acf',line=.5)
par(mar=c(1,2,4,1))
pacf(residus,main='')
title('pacf',line=.5)
par(mar=c(2,2,4,1))
qqnorm(residus,main='')
title('qq-norm',line=.5)
qqline(residus)
residus
}
if (par2 == 0) x <- log(x)
if (par2 != 0) x <- x^par2
(selection <- arimaSelect(x, order=c(par6,par3,par7), seasonal=list(order=c(par8,par4,par9), period=par5)))
bitmap(file='test1.png')
resid <- arimaSelectplot(selection)
dev.off()
resid
bitmap(file='test2.png')
acf(resid,length(resid)/2, main='Residual Autocorrelation Function')
dev.off()
bitmap(file='test3.png')
pacf(resid,length(resid)/2, main='Residual Partial Autocorrelation Function')
dev.off()
bitmap(file='test4.png')
cpgram(resid, main='Residual Cumulative Periodogram')
dev.off()
bitmap(file='test5.png')
hist(resid, main='Residual Histogram', xlab='values of Residuals')
dev.off()
bitmap(file='test6.png')
densityplot(~resid,col='black',main='Residual Density Plot', xlab='values of Residuals')
dev.off()
bitmap(file='test7.png')
qqnorm(resid, main='Residual Normal Q-Q Plot')
qqline(resid)
dev.off()
ncols <- length(selection[[1]][1,])
nrows <- length(selection[[2]][,1])-1
load(file='createtable')
a<-table.start()
a<-table.row.start(a)
a<-table.element(a,'ARIMA Parameter Estimation and Backward Selection', ncols+1,TRUE)
a<-table.row.end(a)
a<-table.row.start(a)
a<-table.element(a,'Iteration', header=TRUE)
for (i in 1:ncols) {
a<-table.element(a,names(selection[[3]][[1]]$coef)[i],header=TRUE)
}
a<-table.row.end(a)
for (j in 1:nrows) {
a<-table.row.start(a)
mydum <- 'Estimates ('
mydum <- paste(mydum,j)
mydum <- paste(mydum,')')
a<-table.element(a,mydum, header=TRUE)
for (i in 1:ncols) {
a<-table.element(a,round(selection[[1]][j,i],4))
}
a<-table.row.end(a)
a<-table.row.start(a)
a<-table.element(a,'(p-val)', header=TRUE)
for (i in 1:ncols) {
mydum <- '('
mydum <- paste(mydum,round(selection[[2]][j,i],4),sep='')
mydum <- paste(mydum,')')
a<-table.element(a,mydum)
}
a<-table.row.end(a)
}
a<-table.end(a)
table.save(a,file='mytable.tab')
a<-table.start()
a<-table.row.start(a)
a<-table.element(a,'Estimated ARIMA Residuals', 1,TRUE)
a<-table.row.end(a)
a<-table.row.start(a)
a<-table.element(a,'Value', 1,TRUE)
a<-table.row.end(a)
for (i in (par4*par5+par3):length(resid)) {
a<-table.row.start(a)
a<-table.element(a,resid[i])
a<-table.row.end(a)
}
a<-table.end(a)
table.save(a,file='mytable1.tab')