Free Statistics

of Irreproducible Research!

Author's title

Author*The author of this computation has been verified*
R Software Modulerwasp_centraltendency.wasp
Title produced by softwareCentral Tendency
Date of computationSun, 14 Dec 2008 09:45:25 -0700
Cite this page as followsStatistical Computations at FreeStatistics.org, Office for Research Development and Education, URL https://freestatistics.org/blog/index.php?v=date/2008/Dec/14/t1229273191w0om2wiemqfai22.htm/, Retrieved Wed, 15 May 2024 12:53:20 +0000
Statistical Computations at FreeStatistics.org, Office for Research Development and Education, URL https://freestatistics.org/blog/index.php?pk=33475, Retrieved Wed, 15 May 2024 12:53:20 +0000
QR Codes:

Original text written by user:
IsPrivate?No (this computation is public)
User-defined keywordsgdm
Estimated Impact160
Family? (F = Feedback message, R = changed R code, M = changed R Module, P = changed Parameters, D = changed Data)
-       [Central Tendency] [Jongerenwerkloosheid] [2008-12-14 16:45:25] [99f79d508deef838ee89a56fb32f134e] [Current]
-    D    [Central Tendency] [Werkloosheid bij 50+] [2008-12-14 17:33:27] [11ac052cc87d77b9933b02bea117068e]
Feedback Forum

Post a new message
Dataseries X:
51978
50330
48538
46636
44574
43028
56924
65193
67132
64398
57591
56279
56331
55015
53405
51200
48695
48057
65964
71371
72184
69400
65605
64727
64506
62751
59938
57870
55263
55777
73944
78201
78715
75009
69705
69979
69755
68155
64211
61110
58373
58288
74822
79606
80232
75631
70996
69144
67141
65413
63391
60964
58412
57539
73377
77413
78932
74789
70076
67944
64076
63136
60198
59057
57388
56708
70019
72263
74152
67057
61941
58331


Summary of computational transaction
Raw Inputview raw input (R code)
Raw Outputview raw output of R engine
Computing time1 seconds
R Server'George Udny Yule' @ 72.249.76.132

\begin{tabular}{lllllllll}
\hline
Summary of computational transaction \tabularnewline
Raw Input & view raw input (R code)  \tabularnewline
Raw Output & view raw output of R engine  \tabularnewline
Computing time & 1 seconds \tabularnewline
R Server & 'George Udny Yule' @ 72.249.76.132 \tabularnewline
\hline
\end{tabular}
%Source: https://freestatistics.org/blog/index.php?pk=33475&T=0

[TABLE]
[ROW][C]Summary of computational transaction[/C][/ROW]
[ROW][C]Raw Input[/C][C]view raw input (R code) [/C][/ROW]
[ROW][C]Raw Output[/C][C]view raw output of R engine [/C][/ROW]
[ROW][C]Computing time[/C][C]1 seconds[/C][/ROW]
[ROW][C]R Server[/C][C]'George Udny Yule' @ 72.249.76.132[/C][/ROW]
[/TABLE]
Source: https://freestatistics.org/blog/index.php?pk=33475&T=0

Globally Unique Identifier (entire table): ba.freestatistics.org/blog/index.php?pk=33475&T=0

As an alternative you can also use a QR Code:  

The GUIDs for individual cells are displayed in the table below:

Summary of computational transaction
Raw Inputview raw input (R code)
Raw Outputview raw output of R engine
Computing time1 seconds
R Server'George Udny Yule' @ 72.249.76.132


Central Tendency - Ungrouped Data
MeasureValueS.E.Value/S.E.
Arithmetic Mean63697.95833333331075.6304321012159.2191857280396
Geometric Mean63028.9917119406
Harmonic Mean62335.4980309893
Quadratic Mean64339.533216475
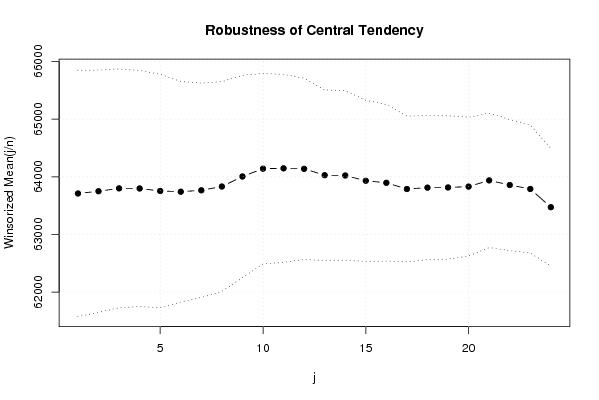
Winsorized Mean ( 1 / 24 )63710.73611111111068.1624717786259.6451736457515
Winsorized Mean ( 2 / 24 )63749.29166666671050.4913401483760.6852138901618
Winsorized Mean ( 3 / 24 )63799.45833333331035.519216672361.6110809979524
Winsorized Mean ( 4 / 24 )63797.6251024.1289043332062.294526333614
Winsorized Mean ( 5 / 24 )63753.80555555561011.2148573524863.0467453004727
Winsorized Mean ( 6 / 24 )63741.5555555556956.28668614130366.6552786725057
Winsorized Mean ( 7 / 24 )63765.6666666667929.4269742111268.607505953644
Winsorized Mean ( 8 / 24 )63831.3333333333909.72360396029370.165633886443
Winsorized Mean ( 9 / 24 )64005.5833333333877.4511265921972.9448984605168
Winsorized Mean ( 10 / 24 )64140.7222222222825.76110958472277.6746706495766
Winsorized Mean ( 11 / 24 )64146.8333333333814.49673152511978.7564036177536
Winsorized Mean ( 12 / 24 )64138785.65953798347981.6358701182709
Winsorized Mean ( 13 / 24 )64027.5739.72373877188886.5559622384168
Winsorized Mean ( 14 / 24 )64022.25735.82934796266587.0069265071612
Winsorized Mean ( 15 / 24 )63931.4166666667698.37521968962191.5430772229859
Winsorized Mean ( 16 / 24 )63896.0833333333679.01829790144694.1006796588674
Winsorized Mean ( 17 / 24 )63788.4166666667632.038743510334100.924852031043
Winsorized Mean ( 18 / 24 )63811.9166666667624.681482452281102.151125748379
Winsorized Mean ( 19 / 24 )63815.0833333333621.266815533974102.71767578393
Winsorized Mean ( 20 / 24 )63830.3611111111601.729586303908106.078149660524
Winsorized Mean ( 21 / 24 )63937.6944444444582.873000337344109.694040395489
Winsorized Mean ( 22 / 24 )63857.6388888889568.17924724976112.389952991047
Winsorized Mean ( 23 / 24 )63789.2777777778555.165334120393114.901406585204
Winsorized Mean ( 24 / 24 )63472.6111111111509.593961595565124.555265357492
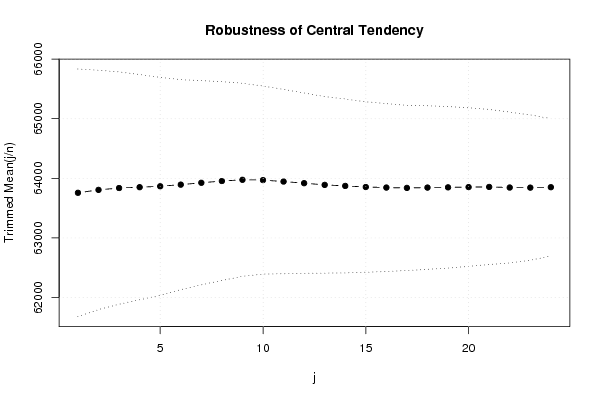
Trimmed Mean ( 1 / 24 )63757.04285714291038.9535172212861.366598024196
Trimmed Mean ( 2 / 24 )63806.07352941181004.1920317658763.5397130339792
Trimmed Mean ( 3 / 24 )63837.0454545455974.09445951207965.5347588020583
Trimmed Mean ( 4 / 24 )63851.140625944.94181128778267.5715053162719
Trimmed Mean ( 5 / 24 )63866.6774193548914.04917922875169.8722550938055
Trimmed Mean ( 6 / 24 )63893.7666666667880.7548445806972.544326108232
Trimmed Mean ( 7 / 24 )63925.2586206897856.32853998746574.6503889986260
Trimmed Mean ( 8 / 24 )63954.5714285714833.4436891740976.735323884866
Trimmed Mean ( 9 / 24 )63975.1111111111810.02915359647278.978776044129
Trimmed Mean ( 10 / 24 )63970.4230769231788.59345228772181.119647761903
Trimmed Mean ( 11 / 24 )63945.9773.36545378109682.6852294569911
Trimmed Mean ( 12 / 24 )63918.5756.1625701175784.5301030836025
Trimmed Mean ( 13 / 24 )63889.8695652174740.20328296017486.3139505538439
Trimmed Mean ( 14 / 24 )63872.5454545455729.22495307892987.5896322319515
Trimmed Mean ( 15 / 24 )63854.2142857143714.92213097062889.3163206446293
Trimmed Mean ( 16 / 24 )63844.95703.72809065499490.7238901612929
Trimmed Mean ( 17 / 24 )63838.8947368421692.12465554883892.236122821285
Trimmed Mean ( 18 / 24 )63844.8333333333686.03332963135293.0637486193872
Trimmed Mean ( 19 / 24 )63848.705882353677.57839300117494.230728933888
Trimmed Mean ( 20 / 24 )63852.6875664.77038304393496.0522446978208
Trimmed Mean ( 21 / 24 )63855.3666666667650.15846606513498.2150813987393
Trimmed Mean ( 22 / 24 )63845.2857142857632.59942827915100.925297842843
Trimmed Mean ( 23 / 24 )63843.7307692308609.255989037051104.789664636925
Trimmed Mean ( 24 / 24 )63850.8333333333576.176174706588110.818246460553
Median64304.5
Midrange61630
Midmean - Weighted Average at Xnp63670.3243243243
Midmean - Weighted Average at X(n+1)p63844.8333333333
Midmean - Empirical Distribution Function63670.3243243243
Midmean - Empirical Distribution Function - Averaging63844.8333333333
Midmean - Empirical Distribution Function - Interpolation63844.8333333333
Midmean - Closest Observation63670.3243243243
Midmean - True Basic - Statistics Graphics Toolkit63844.8333333333
Midmean - MS Excel (old versions)63838.8947368421
Number of observations72

\begin{tabular}{lllllllll}
\hline
Central Tendency - Ungrouped Data \tabularnewline
Measure & Value & S.E. & Value/S.E. \tabularnewline
Arithmetic Mean & 63697.9583333333 & 1075.63043210121 & 59.2191857280396 \tabularnewline
Geometric Mean & 63028.9917119406 &  &  \tabularnewline
Harmonic Mean & 62335.4980309893 &  &  \tabularnewline
Quadratic Mean & 64339.533216475 &  &  \tabularnewline
Winsorized Mean ( 1 / 24 ) & 63710.7361111111 & 1068.16247177862 & 59.6451736457515 \tabularnewline
Winsorized Mean ( 2 / 24 ) & 63749.2916666667 & 1050.49134014837 & 60.6852138901618 \tabularnewline
Winsorized Mean ( 3 / 24 ) & 63799.4583333333 & 1035.5192166723 & 61.6110809979524 \tabularnewline
Winsorized Mean ( 4 / 24 ) & 63797.625 & 1024.12890433320 & 62.294526333614 \tabularnewline
Winsorized Mean ( 5 / 24 ) & 63753.8055555556 & 1011.21485735248 & 63.0467453004727 \tabularnewline
Winsorized Mean ( 6 / 24 ) & 63741.5555555556 & 956.286686141303 & 66.6552786725057 \tabularnewline
Winsorized Mean ( 7 / 24 ) & 63765.6666666667 & 929.42697421112 & 68.607505953644 \tabularnewline
Winsorized Mean ( 8 / 24 ) & 63831.3333333333 & 909.723603960293 & 70.165633886443 \tabularnewline
Winsorized Mean ( 9 / 24 ) & 64005.5833333333 & 877.45112659219 & 72.9448984605168 \tabularnewline
Winsorized Mean ( 10 / 24 ) & 64140.7222222222 & 825.761109584722 & 77.6746706495766 \tabularnewline
Winsorized Mean ( 11 / 24 ) & 64146.8333333333 & 814.496731525119 & 78.7564036177536 \tabularnewline
Winsorized Mean ( 12 / 24 ) & 64138 & 785.659537983479 & 81.6358701182709 \tabularnewline
Winsorized Mean ( 13 / 24 ) & 64027.5 & 739.723738771888 & 86.5559622384168 \tabularnewline
Winsorized Mean ( 14 / 24 ) & 64022.25 & 735.829347962665 & 87.0069265071612 \tabularnewline
Winsorized Mean ( 15 / 24 ) & 63931.4166666667 & 698.375219689621 & 91.5430772229859 \tabularnewline
Winsorized Mean ( 16 / 24 ) & 63896.0833333333 & 679.018297901446 & 94.1006796588674 \tabularnewline
Winsorized Mean ( 17 / 24 ) & 63788.4166666667 & 632.038743510334 & 100.924852031043 \tabularnewline
Winsorized Mean ( 18 / 24 ) & 63811.9166666667 & 624.681482452281 & 102.151125748379 \tabularnewline
Winsorized Mean ( 19 / 24 ) & 63815.0833333333 & 621.266815533974 & 102.71767578393 \tabularnewline
Winsorized Mean ( 20 / 24 ) & 63830.3611111111 & 601.729586303908 & 106.078149660524 \tabularnewline
Winsorized Mean ( 21 / 24 ) & 63937.6944444444 & 582.873000337344 & 109.694040395489 \tabularnewline
Winsorized Mean ( 22 / 24 ) & 63857.6388888889 & 568.17924724976 & 112.389952991047 \tabularnewline
Winsorized Mean ( 23 / 24 ) & 63789.2777777778 & 555.165334120393 & 114.901406585204 \tabularnewline
Winsorized Mean ( 24 / 24 ) & 63472.6111111111 & 509.593961595565 & 124.555265357492 \tabularnewline
Trimmed Mean ( 1 / 24 ) & 63757.0428571429 & 1038.95351722128 & 61.366598024196 \tabularnewline
Trimmed Mean ( 2 / 24 ) & 63806.0735294118 & 1004.19203176587 & 63.5397130339792 \tabularnewline
Trimmed Mean ( 3 / 24 ) & 63837.0454545455 & 974.094459512079 & 65.5347588020583 \tabularnewline
Trimmed Mean ( 4 / 24 ) & 63851.140625 & 944.941811287782 & 67.5715053162719 \tabularnewline
Trimmed Mean ( 5 / 24 ) & 63866.6774193548 & 914.049179228751 & 69.8722550938055 \tabularnewline
Trimmed Mean ( 6 / 24 ) & 63893.7666666667 & 880.75484458069 & 72.544326108232 \tabularnewline
Trimmed Mean ( 7 / 24 ) & 63925.2586206897 & 856.328539987465 & 74.6503889986260 \tabularnewline
Trimmed Mean ( 8 / 24 ) & 63954.5714285714 & 833.44368917409 & 76.735323884866 \tabularnewline
Trimmed Mean ( 9 / 24 ) & 63975.1111111111 & 810.029153596472 & 78.978776044129 \tabularnewline
Trimmed Mean ( 10 / 24 ) & 63970.4230769231 & 788.593452287721 & 81.119647761903 \tabularnewline
Trimmed Mean ( 11 / 24 ) & 63945.9 & 773.365453781096 & 82.6852294569911 \tabularnewline
Trimmed Mean ( 12 / 24 ) & 63918.5 & 756.16257011757 & 84.5301030836025 \tabularnewline
Trimmed Mean ( 13 / 24 ) & 63889.8695652174 & 740.203282960174 & 86.3139505538439 \tabularnewline
Trimmed Mean ( 14 / 24 ) & 63872.5454545455 & 729.224953078929 & 87.5896322319515 \tabularnewline
Trimmed Mean ( 15 / 24 ) & 63854.2142857143 & 714.922130970628 & 89.3163206446293 \tabularnewline
Trimmed Mean ( 16 / 24 ) & 63844.95 & 703.728090654994 & 90.7238901612929 \tabularnewline
Trimmed Mean ( 17 / 24 ) & 63838.8947368421 & 692.124655548838 & 92.236122821285 \tabularnewline
Trimmed Mean ( 18 / 24 ) & 63844.8333333333 & 686.033329631352 & 93.0637486193872 \tabularnewline
Trimmed Mean ( 19 / 24 ) & 63848.705882353 & 677.578393001174 & 94.230728933888 \tabularnewline
Trimmed Mean ( 20 / 24 ) & 63852.6875 & 664.770383043934 & 96.0522446978208 \tabularnewline
Trimmed Mean ( 21 / 24 ) & 63855.3666666667 & 650.158466065134 & 98.2150813987393 \tabularnewline
Trimmed Mean ( 22 / 24 ) & 63845.2857142857 & 632.59942827915 & 100.925297842843 \tabularnewline
Trimmed Mean ( 23 / 24 ) & 63843.7307692308 & 609.255989037051 & 104.789664636925 \tabularnewline
Trimmed Mean ( 24 / 24 ) & 63850.8333333333 & 576.176174706588 & 110.818246460553 \tabularnewline
Median & 64304.5 &  &  \tabularnewline
Midrange & 61630 &  &  \tabularnewline
Midmean - Weighted Average at Xnp & 63670.3243243243 &  &  \tabularnewline
Midmean - Weighted Average at X(n+1)p & 63844.8333333333 &  &  \tabularnewline
Midmean - Empirical Distribution Function & 63670.3243243243 &  &  \tabularnewline
Midmean - Empirical Distribution Function - Averaging & 63844.8333333333 &  &  \tabularnewline
Midmean - Empirical Distribution Function - Interpolation & 63844.8333333333 &  &  \tabularnewline
Midmean - Closest Observation & 63670.3243243243 &  &  \tabularnewline
Midmean - True Basic - Statistics Graphics Toolkit & 63844.8333333333 &  &  \tabularnewline
Midmean - MS Excel (old versions) & 63838.8947368421 &  &  \tabularnewline
Number of observations & 72 &  &  \tabularnewline
\hline
\end{tabular}
%Source: https://freestatistics.org/blog/index.php?pk=33475&T=1

[TABLE]
[ROW][C]Central Tendency - Ungrouped Data[/C][/ROW]
[ROW][C]Measure[/C][C]Value[/C][C]S.E.[/C][C]Value/S.E.[/C][/ROW]
[ROW][C]Arithmetic Mean[/C][C]63697.9583333333[/C][C]1075.63043210121[/C][C]59.2191857280396[/C][/ROW]
[ROW][C]Geometric Mean[/C][C]63028.9917119406[/C][C][/C][C][/C][/ROW]
[ROW][C]Harmonic Mean[/C][C]62335.4980309893[/C][C][/C][C][/C][/ROW]
[ROW][C]Quadratic Mean[/C][C]64339.533216475[/C][C][/C][C][/C][/ROW]
[ROW][C]Winsorized Mean ( 1 / 24 )[/C][C]63710.7361111111[/C][C]1068.16247177862[/C][C]59.6451736457515[/C][/ROW]
[ROW][C]Winsorized Mean ( 2 / 24 )[/C][C]63749.2916666667[/C][C]1050.49134014837[/C][C]60.6852138901618[/C][/ROW]
[ROW][C]Winsorized Mean ( 3 / 24 )[/C][C]63799.4583333333[/C][C]1035.5192166723[/C][C]61.6110809979524[/C][/ROW]
[ROW][C]Winsorized Mean ( 4 / 24 )[/C][C]63797.625[/C][C]1024.12890433320[/C][C]62.294526333614[/C][/ROW]
[ROW][C]Winsorized Mean ( 5 / 24 )[/C][C]63753.8055555556[/C][C]1011.21485735248[/C][C]63.0467453004727[/C][/ROW]
[ROW][C]Winsorized Mean ( 6 / 24 )[/C][C]63741.5555555556[/C][C]956.286686141303[/C][C]66.6552786725057[/C][/ROW]
[ROW][C]Winsorized Mean ( 7 / 24 )[/C][C]63765.6666666667[/C][C]929.42697421112[/C][C]68.607505953644[/C][/ROW]
[ROW][C]Winsorized Mean ( 8 / 24 )[/C][C]63831.3333333333[/C][C]909.723603960293[/C][C]70.165633886443[/C][/ROW]
[ROW][C]Winsorized Mean ( 9 / 24 )[/C][C]64005.5833333333[/C][C]877.45112659219[/C][C]72.9448984605168[/C][/ROW]
[ROW][C]Winsorized Mean ( 10 / 24 )[/C][C]64140.7222222222[/C][C]825.761109584722[/C][C]77.6746706495766[/C][/ROW]
[ROW][C]Winsorized Mean ( 11 / 24 )[/C][C]64146.8333333333[/C][C]814.496731525119[/C][C]78.7564036177536[/C][/ROW]
[ROW][C]Winsorized Mean ( 12 / 24 )[/C][C]64138[/C][C]785.659537983479[/C][C]81.6358701182709[/C][/ROW]
[ROW][C]Winsorized Mean ( 13 / 24 )[/C][C]64027.5[/C][C]739.723738771888[/C][C]86.5559622384168[/C][/ROW]
[ROW][C]Winsorized Mean ( 14 / 24 )[/C][C]64022.25[/C][C]735.829347962665[/C][C]87.0069265071612[/C][/ROW]
[ROW][C]Winsorized Mean ( 15 / 24 )[/C][C]63931.4166666667[/C][C]698.375219689621[/C][C]91.5430772229859[/C][/ROW]
[ROW][C]Winsorized Mean ( 16 / 24 )[/C][C]63896.0833333333[/C][C]679.018297901446[/C][C]94.1006796588674[/C][/ROW]
[ROW][C]Winsorized Mean ( 17 / 24 )[/C][C]63788.4166666667[/C][C]632.038743510334[/C][C]100.924852031043[/C][/ROW]
[ROW][C]Winsorized Mean ( 18 / 24 )[/C][C]63811.9166666667[/C][C]624.681482452281[/C][C]102.151125748379[/C][/ROW]
[ROW][C]Winsorized Mean ( 19 / 24 )[/C][C]63815.0833333333[/C][C]621.266815533974[/C][C]102.71767578393[/C][/ROW]
[ROW][C]Winsorized Mean ( 20 / 24 )[/C][C]63830.3611111111[/C][C]601.729586303908[/C][C]106.078149660524[/C][/ROW]
[ROW][C]Winsorized Mean ( 21 / 24 )[/C][C]63937.6944444444[/C][C]582.873000337344[/C][C]109.694040395489[/C][/ROW]
[ROW][C]Winsorized Mean ( 22 / 24 )[/C][C]63857.6388888889[/C][C]568.17924724976[/C][C]112.389952991047[/C][/ROW]
[ROW][C]Winsorized Mean ( 23 / 24 )[/C][C]63789.2777777778[/C][C]555.165334120393[/C][C]114.901406585204[/C][/ROW]
[ROW][C]Winsorized Mean ( 24 / 24 )[/C][C]63472.6111111111[/C][C]509.593961595565[/C][C]124.555265357492[/C][/ROW]
[ROW][C]Trimmed Mean ( 1 / 24 )[/C][C]63757.0428571429[/C][C]1038.95351722128[/C][C]61.366598024196[/C][/ROW]
[ROW][C]Trimmed Mean ( 2 / 24 )[/C][C]63806.0735294118[/C][C]1004.19203176587[/C][C]63.5397130339792[/C][/ROW]
[ROW][C]Trimmed Mean ( 3 / 24 )[/C][C]63837.0454545455[/C][C]974.094459512079[/C][C]65.5347588020583[/C][/ROW]
[ROW][C]Trimmed Mean ( 4 / 24 )[/C][C]63851.140625[/C][C]944.941811287782[/C][C]67.5715053162719[/C][/ROW]
[ROW][C]Trimmed Mean ( 5 / 24 )[/C][C]63866.6774193548[/C][C]914.049179228751[/C][C]69.8722550938055[/C][/ROW]
[ROW][C]Trimmed Mean ( 6 / 24 )[/C][C]63893.7666666667[/C][C]880.75484458069[/C][C]72.544326108232[/C][/ROW]
[ROW][C]Trimmed Mean ( 7 / 24 )[/C][C]63925.2586206897[/C][C]856.328539987465[/C][C]74.6503889986260[/C][/ROW]
[ROW][C]Trimmed Mean ( 8 / 24 )[/C][C]63954.5714285714[/C][C]833.44368917409[/C][C]76.735323884866[/C][/ROW]
[ROW][C]Trimmed Mean ( 9 / 24 )[/C][C]63975.1111111111[/C][C]810.029153596472[/C][C]78.978776044129[/C][/ROW]
[ROW][C]Trimmed Mean ( 10 / 24 )[/C][C]63970.4230769231[/C][C]788.593452287721[/C][C]81.119647761903[/C][/ROW]
[ROW][C]Trimmed Mean ( 11 / 24 )[/C][C]63945.9[/C][C]773.365453781096[/C][C]82.6852294569911[/C][/ROW]
[ROW][C]Trimmed Mean ( 12 / 24 )[/C][C]63918.5[/C][C]756.16257011757[/C][C]84.5301030836025[/C][/ROW]
[ROW][C]Trimmed Mean ( 13 / 24 )[/C][C]63889.8695652174[/C][C]740.203282960174[/C][C]86.3139505538439[/C][/ROW]
[ROW][C]Trimmed Mean ( 14 / 24 )[/C][C]63872.5454545455[/C][C]729.224953078929[/C][C]87.5896322319515[/C][/ROW]
[ROW][C]Trimmed Mean ( 15 / 24 )[/C][C]63854.2142857143[/C][C]714.922130970628[/C][C]89.3163206446293[/C][/ROW]
[ROW][C]Trimmed Mean ( 16 / 24 )[/C][C]63844.95[/C][C]703.728090654994[/C][C]90.7238901612929[/C][/ROW]
[ROW][C]Trimmed Mean ( 17 / 24 )[/C][C]63838.8947368421[/C][C]692.124655548838[/C][C]92.236122821285[/C][/ROW]
[ROW][C]Trimmed Mean ( 18 / 24 )[/C][C]63844.8333333333[/C][C]686.033329631352[/C][C]93.0637486193872[/C][/ROW]
[ROW][C]Trimmed Mean ( 19 / 24 )[/C][C]63848.705882353[/C][C]677.578393001174[/C][C]94.230728933888[/C][/ROW]
[ROW][C]Trimmed Mean ( 20 / 24 )[/C][C]63852.6875[/C][C]664.770383043934[/C][C]96.0522446978208[/C][/ROW]
[ROW][C]Trimmed Mean ( 21 / 24 )[/C][C]63855.3666666667[/C][C]650.158466065134[/C][C]98.2150813987393[/C][/ROW]
[ROW][C]Trimmed Mean ( 22 / 24 )[/C][C]63845.2857142857[/C][C]632.59942827915[/C][C]100.925297842843[/C][/ROW]
[ROW][C]Trimmed Mean ( 23 / 24 )[/C][C]63843.7307692308[/C][C]609.255989037051[/C][C]104.789664636925[/C][/ROW]
[ROW][C]Trimmed Mean ( 24 / 24 )[/C][C]63850.8333333333[/C][C]576.176174706588[/C][C]110.818246460553[/C][/ROW]
[ROW][C]Median[/C][C]64304.5[/C][C][/C][C][/C][/ROW]
[ROW][C]Midrange[/C][C]61630[/C][C][/C][C][/C][/ROW]
[ROW][C]Midmean - Weighted Average at Xnp[/C][C]63670.3243243243[/C][C][/C][C][/C][/ROW]
[ROW][C]Midmean - Weighted Average at X(n+1)p[/C][C]63844.8333333333[/C][C][/C][C][/C][/ROW]
[ROW][C]Midmean - Empirical Distribution Function[/C][C]63670.3243243243[/C][C][/C][C][/C][/ROW]
[ROW][C]Midmean - Empirical Distribution Function - Averaging[/C][C]63844.8333333333[/C][C][/C][C][/C][/ROW]
[ROW][C]Midmean - Empirical Distribution Function - Interpolation[/C][C]63844.8333333333[/C][C][/C][C][/C][/ROW]
[ROW][C]Midmean - Closest Observation[/C][C]63670.3243243243[/C][C][/C][C][/C][/ROW]
[ROW][C]Midmean - True Basic - Statistics Graphics Toolkit[/C][C]63844.8333333333[/C][C][/C][C][/C][/ROW]
[ROW][C]Midmean - MS Excel (old versions)[/C][C]63838.8947368421[/C][C][/C][C][/C][/ROW]
[ROW][C]Number of observations[/C][C]72[/C][C][/C][C][/C][/ROW]
[/TABLE]
Source: https://freestatistics.org/blog/index.php?pk=33475&T=1

Globally Unique Identifier (entire table): ba.freestatistics.org/blog/index.php?pk=33475&T=1

As an alternative you can also use a QR Code:  

The GUIDs for individual cells are displayed in the table below:

Central Tendency - Ungrouped Data
MeasureValueS.E.Value/S.E.
Arithmetic Mean63697.95833333331075.6304321012159.2191857280396
Geometric Mean63028.9917119406
Harmonic Mean62335.4980309893
Quadratic Mean64339.533216475
Winsorized Mean ( 1 / 24 )63710.73611111111068.1624717786259.6451736457515
Winsorized Mean ( 2 / 24 )63749.29166666671050.4913401483760.6852138901618
Winsorized Mean ( 3 / 24 )63799.45833333331035.519216672361.6110809979524
Winsorized Mean ( 4 / 24 )63797.6251024.1289043332062.294526333614
Winsorized Mean ( 5 / 24 )63753.80555555561011.2148573524863.0467453004727
Winsorized Mean ( 6 / 24 )63741.5555555556956.28668614130366.6552786725057
Winsorized Mean ( 7 / 24 )63765.6666666667929.4269742111268.607505953644
Winsorized Mean ( 8 / 24 )63831.3333333333909.72360396029370.165633886443
Winsorized Mean ( 9 / 24 )64005.5833333333877.4511265921972.9448984605168
Winsorized Mean ( 10 / 24 )64140.7222222222825.76110958472277.6746706495766
Winsorized Mean ( 11 / 24 )64146.8333333333814.49673152511978.7564036177536
Winsorized Mean ( 12 / 24 )64138785.65953798347981.6358701182709
Winsorized Mean ( 13 / 24 )64027.5739.72373877188886.5559622384168
Winsorized Mean ( 14 / 24 )64022.25735.82934796266587.0069265071612
Winsorized Mean ( 15 / 24 )63931.4166666667698.37521968962191.5430772229859
Winsorized Mean ( 16 / 24 )63896.0833333333679.01829790144694.1006796588674
Winsorized Mean ( 17 / 24 )63788.4166666667632.038743510334100.924852031043
Winsorized Mean ( 18 / 24 )63811.9166666667624.681482452281102.151125748379
Winsorized Mean ( 19 / 24 )63815.0833333333621.266815533974102.71767578393
Winsorized Mean ( 20 / 24 )63830.3611111111601.729586303908106.078149660524
Winsorized Mean ( 21 / 24 )63937.6944444444582.873000337344109.694040395489
Winsorized Mean ( 22 / 24 )63857.6388888889568.17924724976112.389952991047
Winsorized Mean ( 23 / 24 )63789.2777777778555.165334120393114.901406585204
Winsorized Mean ( 24 / 24 )63472.6111111111509.593961595565124.555265357492
Trimmed Mean ( 1 / 24 )63757.04285714291038.9535172212861.366598024196
Trimmed Mean ( 2 / 24 )63806.07352941181004.1920317658763.5397130339792
Trimmed Mean ( 3 / 24 )63837.0454545455974.09445951207965.5347588020583
Trimmed Mean ( 4 / 24 )63851.140625944.94181128778267.5715053162719
Trimmed Mean ( 5 / 24 )63866.6774193548914.04917922875169.8722550938055
Trimmed Mean ( 6 / 24 )63893.7666666667880.7548445806972.544326108232
Trimmed Mean ( 7 / 24 )63925.2586206897856.32853998746574.6503889986260
Trimmed Mean ( 8 / 24 )63954.5714285714833.4436891740976.735323884866
Trimmed Mean ( 9 / 24 )63975.1111111111810.02915359647278.978776044129
Trimmed Mean ( 10 / 24 )63970.4230769231788.59345228772181.119647761903
Trimmed Mean ( 11 / 24 )63945.9773.36545378109682.6852294569911
Trimmed Mean ( 12 / 24 )63918.5756.1625701175784.5301030836025
Trimmed Mean ( 13 / 24 )63889.8695652174740.20328296017486.3139505538439
Trimmed Mean ( 14 / 24 )63872.5454545455729.22495307892987.5896322319515
Trimmed Mean ( 15 / 24 )63854.2142857143714.92213097062889.3163206446293
Trimmed Mean ( 16 / 24 )63844.95703.72809065499490.7238901612929
Trimmed Mean ( 17 / 24 )63838.8947368421692.12465554883892.236122821285
Trimmed Mean ( 18 / 24 )63844.8333333333686.03332963135293.0637486193872
Trimmed Mean ( 19 / 24 )63848.705882353677.57839300117494.230728933888
Trimmed Mean ( 20 / 24 )63852.6875664.77038304393496.0522446978208
Trimmed Mean ( 21 / 24 )63855.3666666667650.15846606513498.2150813987393
Trimmed Mean ( 22 / 24 )63845.2857142857632.59942827915100.925297842843
Trimmed Mean ( 23 / 24 )63843.7307692308609.255989037051104.789664636925
Trimmed Mean ( 24 / 24 )63850.8333333333576.176174706588110.818246460553
Median64304.5
Midrange61630
Midmean - Weighted Average at Xnp63670.3243243243
Midmean - Weighted Average at X(n+1)p63844.8333333333
Midmean - Empirical Distribution Function63670.3243243243
Midmean - Empirical Distribution Function - Averaging63844.8333333333
Midmean - Empirical Distribution Function - Interpolation63844.8333333333
Midmean - Closest Observation63670.3243243243
Midmean - True Basic - Statistics Graphics Toolkit63844.8333333333
Midmean - MS Excel (old versions)63838.8947368421
Number of observations72


Parameters (Session):
Parameters (R input):
R code (references can be found in the software module):
geomean <- function(x) {
return(exp(mean(log(x))))
}
harmean <- function(x) {
return(1/mean(1/x))
}
quamean <- function(x) {
return(sqrt(mean(x*x)))
}
winmean <- function(x) {
x <-sort(x[!is.na(x)])
n<-length(x)
denom <- 3
nodenom <- n/denom
if (nodenom>40) denom <- n/40
sqrtn = sqrt(n)
roundnodenom = floor(nodenom)
win <- array(NA,dim=c(roundnodenom,2))
for (j in 1:roundnodenom) {
win[j,1] <- (j*x[j+1]+sum(x[(j+1):(n-j)])+j*x[n-j])/n
win[j,2] <- sd(c(rep(x[j+1],j),x[(j+1):(n-j)],rep(x[n-j],j)))/sqrtn
}
return(win)
}
trimean <- function(x) {
x <-sort(x[!is.na(x)])
n<-length(x)
denom <- 3
nodenom <- n/denom
if (nodenom>40) denom <- n/40
sqrtn = sqrt(n)
roundnodenom = floor(nodenom)
tri <- array(NA,dim=c(roundnodenom,2))
for (j in 1:roundnodenom) {
tri[j,1] <- mean(x,trim=j/n)
tri[j,2] <- sd(x[(j+1):(n-j)]) / sqrt(n-j*2)
}
return(tri)
}
midrange <- function(x) {
return((max(x)+min(x))/2)
}
q1 <- function(data,n,p,i,f) {
np <- n*p;
i <<- floor(np)
f <<- np - i
qvalue <- (1-f)*data[i] + f*data[i+1]
}
q2 <- function(data,n,p,i,f) {
np <- (n+1)*p
i <<- floor(np)
f <<- np - i
qvalue <- (1-f)*data[i] + f*data[i+1]
}
q3 <- function(data,n,p,i,f) {
np <- n*p
i <<- floor(np)
f <<- np - i
if (f==0) {
qvalue <- data[i]
} else {
qvalue <- data[i+1]
}
}
q4 <- function(data,n,p,i,f) {
np <- n*p
i <<- floor(np)
f <<- np - i
if (f==0) {
qvalue <- (data[i]+data[i+1])/2
} else {
qvalue <- data[i+1]
}
}
q5 <- function(data,n,p,i,f) {
np <- (n-1)*p
i <<- floor(np)
f <<- np - i
if (f==0) {
qvalue <- data[i+1]
} else {
qvalue <- data[i+1] + f*(data[i+2]-data[i+1])
}
}
q6 <- function(data,n,p,i,f) {
np <- n*p+0.5
i <<- floor(np)
f <<- np - i
qvalue <- data[i]
}
q7 <- function(data,n,p,i,f) {
np <- (n+1)*p
i <<- floor(np)
f <<- np - i
if (f==0) {
qvalue <- data[i]
} else {
qvalue <- f*data[i] + (1-f)*data[i+1]
}
}
q8 <- function(data,n,p,i,f) {
np <- (n+1)*p
i <<- floor(np)
f <<- np - i
if (f==0) {
qvalue <- data[i]
} else {
if (f == 0.5) {
qvalue <- (data[i]+data[i+1])/2
} else {
if (f < 0.5) {
qvalue <- data[i]
} else {
qvalue <- data[i+1]
}
}
}
}
midmean <- function(x,def) {
x <-sort(x[!is.na(x)])
n<-length(x)
if (def==1) {
qvalue1 <- q1(x,n,0.25,i,f)
qvalue3 <- q1(x,n,0.75,i,f)
}
if (def==2) {
qvalue1 <- q2(x,n,0.25,i,f)
qvalue3 <- q2(x,n,0.75,i,f)
}
if (def==3) {
qvalue1 <- q3(x,n,0.25,i,f)
qvalue3 <- q3(x,n,0.75,i,f)
}
if (def==4) {
qvalue1 <- q4(x,n,0.25,i,f)
qvalue3 <- q4(x,n,0.75,i,f)
}
if (def==5) {
qvalue1 <- q5(x,n,0.25,i,f)
qvalue3 <- q5(x,n,0.75,i,f)
}
if (def==6) {
qvalue1 <- q6(x,n,0.25,i,f)
qvalue3 <- q6(x,n,0.75,i,f)
}
if (def==7) {
qvalue1 <- q7(x,n,0.25,i,f)
qvalue3 <- q7(x,n,0.75,i,f)
}
if (def==8) {
qvalue1 <- q8(x,n,0.25,i,f)
qvalue3 <- q8(x,n,0.75,i,f)
}
midm <- 0
myn <- 0
roundno4 <- round(n/4)
round3no4 <- round(3*n/4)
for (i in 1:n) {
if ((x[i]>=qvalue1) & (x[i]<=qvalue3)){
midm = midm + x[i]
myn = myn + 1
}
}
midm = midm / myn
return(midm)
}
(arm <- mean(x))
sqrtn <- sqrt(length(x))
(armse <- sd(x) / sqrtn)
(armose <- arm / armse)
(geo <- geomean(x))
(har <- harmean(x))
(qua <- quamean(x))
(win <- winmean(x))
(tri <- trimean(x))
(midr <- midrange(x))
midm <- array(NA,dim=8)
for (j in 1:8) midm[j] <- midmean(x,j)
midm
bitmap(file='test1.png')
lb <- win[,1] - 2*win[,2]
ub <- win[,1] + 2*win[,2]
if ((ylimmin == '') | (ylimmax == '')) plot(win[,1],type='b',main=main, xlab='j', pch=19, ylab='Winsorized Mean(j/n)', ylim=c(min(lb),max(ub))) else plot(win[,1],type='l',main=main, xlab='j', pch=19, ylab='Winsorized Mean(j/n)', ylim=c(ylimmin,ylimmax))
lines(ub,lty=3)
lines(lb,lty=3)
grid()
dev.off()
bitmap(file='test2.png')
lb <- tri[,1] - 2*tri[,2]
ub <- tri[,1] + 2*tri[,2]
if ((ylimmin == '') | (ylimmax == '')) plot(tri[,1],type='b',main=main, xlab='j', pch=19, ylab='Trimmed Mean(j/n)', ylim=c(min(lb),max(ub))) else plot(tri[,1],type='l',main=main, xlab='j', pch=19, ylab='Trimmed Mean(j/n)', ylim=c(ylimmin,ylimmax))
lines(ub,lty=3)
lines(lb,lty=3)
grid()
dev.off()
load(file='createtable')
a<-table.start()
a<-table.row.start(a)
a<-table.element(a,'Central Tendency - Ungrouped Data',4,TRUE)
a<-table.row.end(a)
a<-table.row.start(a)
a<-table.element(a,'Measure',header=TRUE)
a<-table.element(a,'Value',header=TRUE)
a<-table.element(a,'S.E.',header=TRUE)
a<-table.element(a,'Value/S.E.',header=TRUE)
a<-table.row.end(a)
a<-table.row.start(a)
a<-table.element(a,hyperlink('arithmetic_mean.htm', 'Arithmetic Mean', 'click to view the definition of the Arithmetic Mean'),header=TRUE)
a<-table.element(a,arm)
a<-table.element(a,hyperlink('arithmetic_mean_standard_error.htm', armse, 'click to view the definition of the Standard Error of the Arithmetic Mean'))
a<-table.element(a,armose)
a<-table.row.end(a)
a<-table.row.start(a)
a<-table.element(a,hyperlink('geometric_mean.htm', 'Geometric Mean', 'click to view the definition of the Geometric Mean'),header=TRUE)
a<-table.element(a,geo)
a<-table.element(a,'')
a<-table.row.end(a)
a<-table.row.start(a)
a<-table.element(a,hyperlink('harmonic_mean.htm', 'Harmonic Mean', 'click to view the definition of the Harmonic Mean'),header=TRUE)
a<-table.element(a,har)
a<-table.element(a,'')
a<-table.row.end(a)
a<-table.row.start(a)
a<-table.element(a,hyperlink('quadratic_mean.htm', 'Quadratic Mean', 'click to view the definition of the Quadratic Mean'),header=TRUE)
a<-table.element(a,qua)
a<-table.element(a,'')
a<-table.row.end(a)
for (j in 1:length(win[,1])) {
a<-table.row.start(a)
mylabel <- paste('Winsorized Mean (',j)
mylabel <- paste(mylabel,'/')
mylabel <- paste(mylabel,length(win[,1]))
mylabel <- paste(mylabel,')')
a<-table.element(a,hyperlink('winsorized_mean.htm', mylabel, 'click to view the definition of the Winsorized Mean'),header=TRUE)
a<-table.element(a,win[j,1])
a<-table.element(a,win[j,2])
a<-table.element(a,win[j,1]/win[j,2])
a<-table.row.end(a)
}
for (j in 1:length(tri[,1])) {
a<-table.row.start(a)
mylabel <- paste('Trimmed Mean (',j)
mylabel <- paste(mylabel,'/')
mylabel <- paste(mylabel,length(tri[,1]))
mylabel <- paste(mylabel,')')
a<-table.element(a,hyperlink('arithmetic_mean.htm', mylabel, 'click to view the definition of the Trimmed Mean'),header=TRUE)
a<-table.element(a,tri[j,1])
a<-table.element(a,tri[j,2])
a<-table.element(a,tri[j,1]/tri[j,2])
a<-table.row.end(a)
}
a<-table.row.start(a)
a<-table.element(a,hyperlink('median_1.htm', 'Median', 'click to view the definition of the Median'),header=TRUE)
a<-table.element(a,median(x))
a<-table.element(a,'')
a<-table.row.end(a)
a<-table.row.start(a)
a<-table.element(a,hyperlink('midrange.htm', 'Midrange', 'click to view the definition of the Midrange'),header=TRUE)
a<-table.element(a,midr)
a<-table.element(a,'')
a<-table.row.end(a)
a<-table.row.start(a)
mymid <- hyperlink('midmean.htm', 'Midmean', 'click to view the definition of the Midmean')
mylabel <- paste(mymid,hyperlink('method_1.htm','Weighted Average at Xnp',''),sep=' - ')
a<-table.element(a,mylabel,header=TRUE)
a<-table.element(a,midm[1])
a<-table.element(a,'')
a<-table.row.end(a)
a<-table.row.start(a)
mymid <- hyperlink('midmean.htm', 'Midmean', 'click to view the definition of the Midmean')
mylabel <- paste(mymid,hyperlink('method_2.htm','Weighted Average at X(n+1)p',''),sep=' - ')
a<-table.element(a,mylabel,header=TRUE)
a<-table.element(a,midm[2])
a<-table.element(a,'')
a<-table.row.end(a)
a<-table.row.start(a)
mymid <- hyperlink('midmean.htm', 'Midmean', 'click to view the definition of the Midmean')
mylabel <- paste(mymid,hyperlink('method_3.htm','Empirical Distribution Function',''),sep=' - ')
a<-table.element(a,mylabel,header=TRUE)
a<-table.element(a,midm[3])
a<-table.element(a,'')
a<-table.row.end(a)
a<-table.row.start(a)
mymid <- hyperlink('midmean.htm', 'Midmean', 'click to view the definition of the Midmean')
mylabel <- paste(mymid,hyperlink('method_4.htm','Empirical Distribution Function - Averaging',''),sep=' - ')
a<-table.element(a,mylabel,header=TRUE)
a<-table.element(a,midm[4])
a<-table.element(a,'')
a<-table.row.end(a)
a<-table.row.start(a)
mymid <- hyperlink('midmean.htm', 'Midmean', 'click to view the definition of the Midmean')
mylabel <- paste(mymid,hyperlink('method_5.htm','Empirical Distribution Function - Interpolation',''),sep=' - ')
a<-table.element(a,mylabel,header=TRUE)
a<-table.element(a,midm[5])
a<-table.element(a,'')
a<-table.row.end(a)
a<-table.row.start(a)
mymid <- hyperlink('midmean.htm', 'Midmean', 'click to view the definition of the Midmean')
mylabel <- paste(mymid,hyperlink('method_6.htm','Closest Observation',''),sep=' - ')
a<-table.element(a,mylabel,header=TRUE)
a<-table.element(a,midm[6])
a<-table.element(a,'')
a<-table.row.end(a)
a<-table.row.start(a)
mymid <- hyperlink('midmean.htm', 'Midmean', 'click to view the definition of the Midmean')
mylabel <- paste(mymid,hyperlink('method_7.htm','True Basic - Statistics Graphics Toolkit',''),sep=' - ')
a<-table.element(a,mylabel,header=TRUE)
a<-table.element(a,midm[7])
a<-table.element(a,'')
a<-table.row.end(a)
a<-table.row.start(a)
mymid <- hyperlink('midmean.htm', 'Midmean', 'click to view the definition of the Midmean')
mylabel <- paste(mymid,hyperlink('method_8.htm','MS Excel (old versions)',''),sep=' - ')
a<-table.element(a,mylabel,header=TRUE)
a<-table.element(a,midm[8])
a<-table.element(a,'')
a<-table.row.end(a)
a<-table.row.start(a)
a<-table.element(a,'Number of observations',header=TRUE)
a<-table.element(a,length(x))
a<-table.element(a,'')
a<-table.row.end(a)
a<-table.end(a)
table.save(a,file='mytable.tab')