Free Statistics

of Irreproducible Research!

Author's title

Author*Unverified author*
R Software Modulerwasp_autocorrelation.wasp
Title produced by software(Partial) Autocorrelation Function
Date of computationSun, 14 Dec 2008 09:35:41 -0700
Cite this page as followsStatistical Computations at FreeStatistics.org, Office for Research Development and Education, URL https://freestatistics.org/blog/index.php?v=date/2008/Dec/14/t1229272573laraiv7bf35n3rl.htm/, Retrieved Wed, 15 May 2024 15:33:55 +0000
Statistical Computations at FreeStatistics.org, Office for Research Development and Education, URL https://freestatistics.org/blog/index.php?pk=33469, Retrieved Wed, 15 May 2024 15:33:55 +0000
QR Codes:

Original text written by user:
IsPrivate?No (this computation is public)
User-defined keywords
Estimated Impact191
Family? (F = Feedback message, R = changed R code, M = changed R Module, P = changed Parameters, D = changed Data)
-     [(Partial) Autocorrelation Function] [paper autocorrela...] [2008-12-14 16:25:08] [85134b6edb9973b9193450dd2306c65b]
-   P   [(Partial) Autocorrelation Function] [paper autocorrela...] [2008-12-14 16:31:59] [85134b6edb9973b9193450dd2306c65b]
-   P       [(Partial) Autocorrelation Function] [paper autocorrela...] [2008-12-14 16:35:41] [4940af498c7c54f3992f17142bd40069] [Current]
Feedback Forum

Post a new message
Dataseries X:
111078
150739
159129
157928
147768
137507
136919
136151
133001
125554
119647
114158
116193
152803
161761
160942
149470
139208
134588
130322
126611
122401
117352
112135
112879
148729
157230
157221
146681
136524
132111
125326
122716
116615
113719
110737
112093
143565
149946
149147
134339
122683
115614
116566
111272
104609
101802
94542
93051
124129
130374
123946
114971
105531
104919
104782
101281
94545
93248
84031
87486


Summary of computational transaction
Raw Inputview raw input (R code)
Raw Outputview raw output of R engine
Computing time1 seconds
R Server'Gwilym Jenkins' @ 72.249.127.135

\begin{tabular}{lllllllll}
\hline
Summary of computational transaction \tabularnewline
Raw Input & view raw input (R code)  \tabularnewline
Raw Output & view raw output of R engine  \tabularnewline
Computing time & 1 seconds \tabularnewline
R Server & 'Gwilym Jenkins' @ 72.249.127.135 \tabularnewline
\hline
\end{tabular}
%Source: https://freestatistics.org/blog/index.php?pk=33469&T=0

[TABLE]
[ROW][C]Summary of computational transaction[/C][/ROW]
[ROW][C]Raw Input[/C][C]view raw input (R code) [/C][/ROW]
[ROW][C]Raw Output[/C][C]view raw output of R engine [/C][/ROW]
[ROW][C]Computing time[/C][C]1 seconds[/C][/ROW]
[ROW][C]R Server[/C][C]'Gwilym Jenkins' @ 72.249.127.135[/C][/ROW]
[/TABLE]
Source: https://freestatistics.org/blog/index.php?pk=33469&T=0

Globally Unique Identifier (entire table): ba.freestatistics.org/blog/index.php?pk=33469&T=0

As an alternative you can also use a QR Code:  

The GUIDs for individual cells are displayed in the table below:

Summary of computational transaction
Raw Inputview raw input (R code)
Raw Outputview raw output of R engine
Computing time1 seconds
R Server'Gwilym Jenkins' @ 72.249.127.135


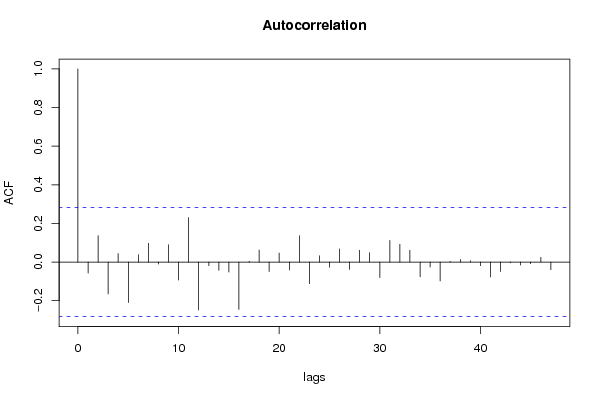
Autocorrelation Function
Time lag kACF(k)T-STATP-value
1-0.056971-0.39470.347405
20.1364040.9450.174687
3-0.165202-1.14460.129035
40.0435990.30210.381955
5-0.210064-1.45540.076039
60.0377620.26160.397365
70.0970220.67220.252343
8-0.010518-0.07290.471106
90.0891360.61760.269895
10-0.093249-0.6460.260663
110.2301471.59450.058694
12-0.24832-1.72040.0459
13-0.019142-0.13260.447525
14-0.04312-0.29870.383213
15-0.051879-0.35940.360424
16-0.245481-1.70070.047731
170.0040690.02820.488812
180.0621880.43090.334253
19-0.049126-0.34040.367538
200.0464050.32150.374612
21-0.040975-0.28390.38886
220.1365230.94590.174478
23-0.11201-0.7760.22077
240.031980.22160.412796
25-0.026872-0.18620.426546
260.0675160.46780.321034
27-0.03853-0.26690.395328
280.0615560.42650.335835
290.0487030.33740.368634
30-0.080729-0.55930.289275
310.1118320.77480.221131
320.0916220.63480.264294
330.0606580.42020.33809
34-0.076725-0.53160.298739
35-0.025138-0.17420.431236
36-0.098116-0.67980.24996
370.0035070.02430.490358
380.0133730.09260.463284
390.0066710.04620.481665
40-0.018974-0.13150.447983
41-0.077454-0.53660.297006
42-0.048514-0.33610.369124
43-0.004084-0.02830.488771
44-0.015602-0.10810.457187
45-0.008565-0.05930.476464
460.024470.16950.433044
47-0.039785-0.27560.392004
48NANANA
49NANANA
50NANANA
51NANANA
52NANANA
53NANANA
54NANANA
55NANANA
56NANANA
57NANANA
58NANANA
59NANANA
60NANANA

\begin{tabular}{lllllllll}
\hline
Autocorrelation Function \tabularnewline
Time lag k & ACF(k) & T-STAT & P-value \tabularnewline
1 & -0.056971 & -0.3947 & 0.347405 \tabularnewline
2 & 0.136404 & 0.945 & 0.174687 \tabularnewline
3 & -0.165202 & -1.1446 & 0.129035 \tabularnewline
4 & 0.043599 & 0.3021 & 0.381955 \tabularnewline
5 & -0.210064 & -1.4554 & 0.076039 \tabularnewline
6 & 0.037762 & 0.2616 & 0.397365 \tabularnewline
7 & 0.097022 & 0.6722 & 0.252343 \tabularnewline
8 & -0.010518 & -0.0729 & 0.471106 \tabularnewline
9 & 0.089136 & 0.6176 & 0.269895 \tabularnewline
10 & -0.093249 & -0.646 & 0.260663 \tabularnewline
11 & 0.230147 & 1.5945 & 0.058694 \tabularnewline
12 & -0.24832 & -1.7204 & 0.0459 \tabularnewline
13 & -0.019142 & -0.1326 & 0.447525 \tabularnewline
14 & -0.04312 & -0.2987 & 0.383213 \tabularnewline
15 & -0.051879 & -0.3594 & 0.360424 \tabularnewline
16 & -0.245481 & -1.7007 & 0.047731 \tabularnewline
17 & 0.004069 & 0.0282 & 0.488812 \tabularnewline
18 & 0.062188 & 0.4309 & 0.334253 \tabularnewline
19 & -0.049126 & -0.3404 & 0.367538 \tabularnewline
20 & 0.046405 & 0.3215 & 0.374612 \tabularnewline
21 & -0.040975 & -0.2839 & 0.38886 \tabularnewline
22 & 0.136523 & 0.9459 & 0.174478 \tabularnewline
23 & -0.11201 & -0.776 & 0.22077 \tabularnewline
24 & 0.03198 & 0.2216 & 0.412796 \tabularnewline
25 & -0.026872 & -0.1862 & 0.426546 \tabularnewline
26 & 0.067516 & 0.4678 & 0.321034 \tabularnewline
27 & -0.03853 & -0.2669 & 0.395328 \tabularnewline
28 & 0.061556 & 0.4265 & 0.335835 \tabularnewline
29 & 0.048703 & 0.3374 & 0.368634 \tabularnewline
30 & -0.080729 & -0.5593 & 0.289275 \tabularnewline
31 & 0.111832 & 0.7748 & 0.221131 \tabularnewline
32 & 0.091622 & 0.6348 & 0.264294 \tabularnewline
33 & 0.060658 & 0.4202 & 0.33809 \tabularnewline
34 & -0.076725 & -0.5316 & 0.298739 \tabularnewline
35 & -0.025138 & -0.1742 & 0.431236 \tabularnewline
36 & -0.098116 & -0.6798 & 0.24996 \tabularnewline
37 & 0.003507 & 0.0243 & 0.490358 \tabularnewline
38 & 0.013373 & 0.0926 & 0.463284 \tabularnewline
39 & 0.006671 & 0.0462 & 0.481665 \tabularnewline
40 & -0.018974 & -0.1315 & 0.447983 \tabularnewline
41 & -0.077454 & -0.5366 & 0.297006 \tabularnewline
42 & -0.048514 & -0.3361 & 0.369124 \tabularnewline
43 & -0.004084 & -0.0283 & 0.488771 \tabularnewline
44 & -0.015602 & -0.1081 & 0.457187 \tabularnewline
45 & -0.008565 & -0.0593 & 0.476464 \tabularnewline
46 & 0.02447 & 0.1695 & 0.433044 \tabularnewline
47 & -0.039785 & -0.2756 & 0.392004 \tabularnewline
48 & NA & NA & NA \tabularnewline
49 & NA & NA & NA \tabularnewline
50 & NA & NA & NA \tabularnewline
51 & NA & NA & NA \tabularnewline
52 & NA & NA & NA \tabularnewline
53 & NA & NA & NA \tabularnewline
54 & NA & NA & NA \tabularnewline
55 & NA & NA & NA \tabularnewline
56 & NA & NA & NA \tabularnewline
57 & NA & NA & NA \tabularnewline
58 & NA & NA & NA \tabularnewline
59 & NA & NA & NA \tabularnewline
60 & NA & NA & NA \tabularnewline
\hline
\end{tabular}
%Source: https://freestatistics.org/blog/index.php?pk=33469&T=1

[TABLE]
[ROW][C]Autocorrelation Function[/C][/ROW]
[ROW][C]Time lag k[/C][C]ACF(k)[/C][C]T-STAT[/C][C]P-value[/C][/ROW]
[ROW][C]1[/C][C]-0.056971[/C][C]-0.3947[/C][C]0.347405[/C][/ROW]
[ROW][C]2[/C][C]0.136404[/C][C]0.945[/C][C]0.174687[/C][/ROW]
[ROW][C]3[/C][C]-0.165202[/C][C]-1.1446[/C][C]0.129035[/C][/ROW]
[ROW][C]4[/C][C]0.043599[/C][C]0.3021[/C][C]0.381955[/C][/ROW]
[ROW][C]5[/C][C]-0.210064[/C][C]-1.4554[/C][C]0.076039[/C][/ROW]
[ROW][C]6[/C][C]0.037762[/C][C]0.2616[/C][C]0.397365[/C][/ROW]
[ROW][C]7[/C][C]0.097022[/C][C]0.6722[/C][C]0.252343[/C][/ROW]
[ROW][C]8[/C][C]-0.010518[/C][C]-0.0729[/C][C]0.471106[/C][/ROW]
[ROW][C]9[/C][C]0.089136[/C][C]0.6176[/C][C]0.269895[/C][/ROW]
[ROW][C]10[/C][C]-0.093249[/C][C]-0.646[/C][C]0.260663[/C][/ROW]
[ROW][C]11[/C][C]0.230147[/C][C]1.5945[/C][C]0.058694[/C][/ROW]
[ROW][C]12[/C][C]-0.24832[/C][C]-1.7204[/C][C]0.0459[/C][/ROW]
[ROW][C]13[/C][C]-0.019142[/C][C]-0.1326[/C][C]0.447525[/C][/ROW]
[ROW][C]14[/C][C]-0.04312[/C][C]-0.2987[/C][C]0.383213[/C][/ROW]
[ROW][C]15[/C][C]-0.051879[/C][C]-0.3594[/C][C]0.360424[/C][/ROW]
[ROW][C]16[/C][C]-0.245481[/C][C]-1.7007[/C][C]0.047731[/C][/ROW]
[ROW][C]17[/C][C]0.004069[/C][C]0.0282[/C][C]0.488812[/C][/ROW]
[ROW][C]18[/C][C]0.062188[/C][C]0.4309[/C][C]0.334253[/C][/ROW]
[ROW][C]19[/C][C]-0.049126[/C][C]-0.3404[/C][C]0.367538[/C][/ROW]
[ROW][C]20[/C][C]0.046405[/C][C]0.3215[/C][C]0.374612[/C][/ROW]
[ROW][C]21[/C][C]-0.040975[/C][C]-0.2839[/C][C]0.38886[/C][/ROW]
[ROW][C]22[/C][C]0.136523[/C][C]0.9459[/C][C]0.174478[/C][/ROW]
[ROW][C]23[/C][C]-0.11201[/C][C]-0.776[/C][C]0.22077[/C][/ROW]
[ROW][C]24[/C][C]0.03198[/C][C]0.2216[/C][C]0.412796[/C][/ROW]
[ROW][C]25[/C][C]-0.026872[/C][C]-0.1862[/C][C]0.426546[/C][/ROW]
[ROW][C]26[/C][C]0.067516[/C][C]0.4678[/C][C]0.321034[/C][/ROW]
[ROW][C]27[/C][C]-0.03853[/C][C]-0.2669[/C][C]0.395328[/C][/ROW]
[ROW][C]28[/C][C]0.061556[/C][C]0.4265[/C][C]0.335835[/C][/ROW]
[ROW][C]29[/C][C]0.048703[/C][C]0.3374[/C][C]0.368634[/C][/ROW]
[ROW][C]30[/C][C]-0.080729[/C][C]-0.5593[/C][C]0.289275[/C][/ROW]
[ROW][C]31[/C][C]0.111832[/C][C]0.7748[/C][C]0.221131[/C][/ROW]
[ROW][C]32[/C][C]0.091622[/C][C]0.6348[/C][C]0.264294[/C][/ROW]
[ROW][C]33[/C][C]0.060658[/C][C]0.4202[/C][C]0.33809[/C][/ROW]
[ROW][C]34[/C][C]-0.076725[/C][C]-0.5316[/C][C]0.298739[/C][/ROW]
[ROW][C]35[/C][C]-0.025138[/C][C]-0.1742[/C][C]0.431236[/C][/ROW]
[ROW][C]36[/C][C]-0.098116[/C][C]-0.6798[/C][C]0.24996[/C][/ROW]
[ROW][C]37[/C][C]0.003507[/C][C]0.0243[/C][C]0.490358[/C][/ROW]
[ROW][C]38[/C][C]0.013373[/C][C]0.0926[/C][C]0.463284[/C][/ROW]
[ROW][C]39[/C][C]0.006671[/C][C]0.0462[/C][C]0.481665[/C][/ROW]
[ROW][C]40[/C][C]-0.018974[/C][C]-0.1315[/C][C]0.447983[/C][/ROW]
[ROW][C]41[/C][C]-0.077454[/C][C]-0.5366[/C][C]0.297006[/C][/ROW]
[ROW][C]42[/C][C]-0.048514[/C][C]-0.3361[/C][C]0.369124[/C][/ROW]
[ROW][C]43[/C][C]-0.004084[/C][C]-0.0283[/C][C]0.488771[/C][/ROW]
[ROW][C]44[/C][C]-0.015602[/C][C]-0.1081[/C][C]0.457187[/C][/ROW]
[ROW][C]45[/C][C]-0.008565[/C][C]-0.0593[/C][C]0.476464[/C][/ROW]
[ROW][C]46[/C][C]0.02447[/C][C]0.1695[/C][C]0.433044[/C][/ROW]
[ROW][C]47[/C][C]-0.039785[/C][C]-0.2756[/C][C]0.392004[/C][/ROW]
[ROW][C]48[/C][C]NA[/C][C]NA[/C][C]NA[/C][/ROW]
[ROW][C]49[/C][C]NA[/C][C]NA[/C][C]NA[/C][/ROW]
[ROW][C]50[/C][C]NA[/C][C]NA[/C][C]NA[/C][/ROW]
[ROW][C]51[/C][C]NA[/C][C]NA[/C][C]NA[/C][/ROW]
[ROW][C]52[/C][C]NA[/C][C]NA[/C][C]NA[/C][/ROW]
[ROW][C]53[/C][C]NA[/C][C]NA[/C][C]NA[/C][/ROW]
[ROW][C]54[/C][C]NA[/C][C]NA[/C][C]NA[/C][/ROW]
[ROW][C]55[/C][C]NA[/C][C]NA[/C][C]NA[/C][/ROW]
[ROW][C]56[/C][C]NA[/C][C]NA[/C][C]NA[/C][/ROW]
[ROW][C]57[/C][C]NA[/C][C]NA[/C][C]NA[/C][/ROW]
[ROW][C]58[/C][C]NA[/C][C]NA[/C][C]NA[/C][/ROW]
[ROW][C]59[/C][C]NA[/C][C]NA[/C][C]NA[/C][/ROW]
[ROW][C]60[/C][C]NA[/C][C]NA[/C][C]NA[/C][/ROW]
[/TABLE]
Source: https://freestatistics.org/blog/index.php?pk=33469&T=1

Globally Unique Identifier (entire table): ba.freestatistics.org/blog/index.php?pk=33469&T=1

As an alternative you can also use a QR Code:  

The GUIDs for individual cells are displayed in the table below:

Autocorrelation Function
Time lag kACF(k)T-STATP-value
1-0.056971-0.39470.347405
20.1364040.9450.174687
3-0.165202-1.14460.129035
40.0435990.30210.381955
5-0.210064-1.45540.076039
60.0377620.26160.397365
70.0970220.67220.252343
8-0.010518-0.07290.471106
90.0891360.61760.269895
10-0.093249-0.6460.260663
110.2301471.59450.058694
12-0.24832-1.72040.0459
13-0.019142-0.13260.447525
14-0.04312-0.29870.383213
15-0.051879-0.35940.360424
16-0.245481-1.70070.047731
170.0040690.02820.488812
180.0621880.43090.334253
19-0.049126-0.34040.367538
200.0464050.32150.374612
21-0.040975-0.28390.38886
220.1365230.94590.174478
23-0.11201-0.7760.22077
240.031980.22160.412796
25-0.026872-0.18620.426546
260.0675160.46780.321034
27-0.03853-0.26690.395328
280.0615560.42650.335835
290.0487030.33740.368634
30-0.080729-0.55930.289275
310.1118320.77480.221131
320.0916220.63480.264294
330.0606580.42020.33809
34-0.076725-0.53160.298739
35-0.025138-0.17420.431236
36-0.098116-0.67980.24996
370.0035070.02430.490358
380.0133730.09260.463284
390.0066710.04620.481665
40-0.018974-0.13150.447983
41-0.077454-0.53660.297006
42-0.048514-0.33610.369124
43-0.004084-0.02830.488771
44-0.015602-0.10810.457187
45-0.008565-0.05930.476464
460.024470.16950.433044
47-0.039785-0.27560.392004
48NANANA
49NANANA
50NANANA
51NANANA
52NANANA
53NANANA
54NANANA
55NANANA
56NANANA
57NANANA
58NANANA
59NANANA
60NANANA


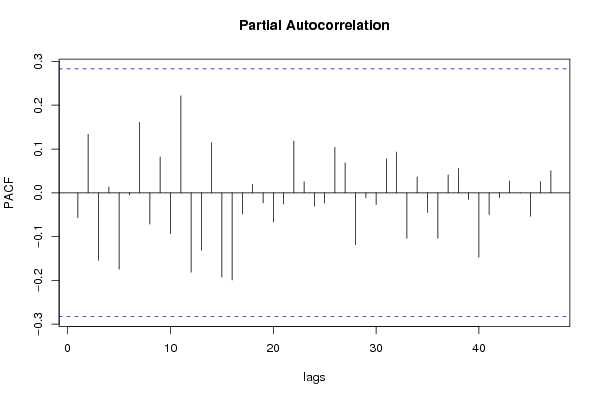
Partial Autocorrelation Function
Time lag kPACF(k)T-STATP-value
1-0.056971-0.39470.347405
20.1335920.92560.179655
3-0.1541-1.06760.145513
40.0134780.09340.462995
5-0.174385-1.20820.116449
6-0.004915-0.0340.486489
70.1611561.11650.134878
8-0.071528-0.49560.311232
90.0819130.56750.286506
10-0.093527-0.6480.260046
110.2214541.53430.065763
12-0.181402-1.25680.107456
13-0.131208-0.9090.183937
140.1147040.79470.215352
15-0.192359-1.33270.094461
16-0.198956-1.37840.087235
17-0.048299-0.33460.369684
180.0194120.13450.446788
19-0.023237-0.1610.436388
20-0.066617-0.46150.323249
21-0.025509-0.17670.430232
220.1185480.82130.207762
230.0252350.17480.430974
24-0.030457-0.2110.416884
25-0.023353-0.16180.436074
260.1038050.71920.237758
270.0685830.47520.318414
28-0.118111-0.81830.208616
29-0.011512-0.07980.468381
30-0.026809-0.18570.426715
310.0773690.5360.297207
320.0929910.64430.261236
33-0.104078-0.72110.23718
340.0363250.25170.401186
35-0.044964-0.31150.378378
36-0.103792-0.71910.237785
370.0409370.28360.388961
380.0557530.38630.350503
39-0.015268-0.10580.458099
40-0.146706-1.01640.157265
41-0.049658-0.3440.36616
42-0.01128-0.07820.469015
430.027050.18740.426065
440.0003720.00260.498976
45-0.053656-0.37170.355862
460.0257280.17820.429638
470.050640.35080.363619
48NANANA
49NANANA
50NANANA
51NANANA
52NANANA
53NANANA
54NANANA
55NANANA
56NANANA
57NANANA
58NANANA
59NANANA
60NANANA

\begin{tabular}{lllllllll}
\hline
Partial Autocorrelation Function \tabularnewline
Time lag k & PACF(k) & T-STAT & P-value \tabularnewline
1 & -0.056971 & -0.3947 & 0.347405 \tabularnewline
2 & 0.133592 & 0.9256 & 0.179655 \tabularnewline
3 & -0.1541 & -1.0676 & 0.145513 \tabularnewline
4 & 0.013478 & 0.0934 & 0.462995 \tabularnewline
5 & -0.174385 & -1.2082 & 0.116449 \tabularnewline
6 & -0.004915 & -0.034 & 0.486489 \tabularnewline
7 & 0.161156 & 1.1165 & 0.134878 \tabularnewline
8 & -0.071528 & -0.4956 & 0.311232 \tabularnewline
9 & 0.081913 & 0.5675 & 0.286506 \tabularnewline
10 & -0.093527 & -0.648 & 0.260046 \tabularnewline
11 & 0.221454 & 1.5343 & 0.065763 \tabularnewline
12 & -0.181402 & -1.2568 & 0.107456 \tabularnewline
13 & -0.131208 & -0.909 & 0.183937 \tabularnewline
14 & 0.114704 & 0.7947 & 0.215352 \tabularnewline
15 & -0.192359 & -1.3327 & 0.094461 \tabularnewline
16 & -0.198956 & -1.3784 & 0.087235 \tabularnewline
17 & -0.048299 & -0.3346 & 0.369684 \tabularnewline
18 & 0.019412 & 0.1345 & 0.446788 \tabularnewline
19 & -0.023237 & -0.161 & 0.436388 \tabularnewline
20 & -0.066617 & -0.4615 & 0.323249 \tabularnewline
21 & -0.025509 & -0.1767 & 0.430232 \tabularnewline
22 & 0.118548 & 0.8213 & 0.207762 \tabularnewline
23 & 0.025235 & 0.1748 & 0.430974 \tabularnewline
24 & -0.030457 & -0.211 & 0.416884 \tabularnewline
25 & -0.023353 & -0.1618 & 0.436074 \tabularnewline
26 & 0.103805 & 0.7192 & 0.237758 \tabularnewline
27 & 0.068583 & 0.4752 & 0.318414 \tabularnewline
28 & -0.118111 & -0.8183 & 0.208616 \tabularnewline
29 & -0.011512 & -0.0798 & 0.468381 \tabularnewline
30 & -0.026809 & -0.1857 & 0.426715 \tabularnewline
31 & 0.077369 & 0.536 & 0.297207 \tabularnewline
32 & 0.092991 & 0.6443 & 0.261236 \tabularnewline
33 & -0.104078 & -0.7211 & 0.23718 \tabularnewline
34 & 0.036325 & 0.2517 & 0.401186 \tabularnewline
35 & -0.044964 & -0.3115 & 0.378378 \tabularnewline
36 & -0.103792 & -0.7191 & 0.237785 \tabularnewline
37 & 0.040937 & 0.2836 & 0.388961 \tabularnewline
38 & 0.055753 & 0.3863 & 0.350503 \tabularnewline
39 & -0.015268 & -0.1058 & 0.458099 \tabularnewline
40 & -0.146706 & -1.0164 & 0.157265 \tabularnewline
41 & -0.049658 & -0.344 & 0.36616 \tabularnewline
42 & -0.01128 & -0.0782 & 0.469015 \tabularnewline
43 & 0.02705 & 0.1874 & 0.426065 \tabularnewline
44 & 0.000372 & 0.0026 & 0.498976 \tabularnewline
45 & -0.053656 & -0.3717 & 0.355862 \tabularnewline
46 & 0.025728 & 0.1782 & 0.429638 \tabularnewline
47 & 0.05064 & 0.3508 & 0.363619 \tabularnewline
48 & NA & NA & NA \tabularnewline
49 & NA & NA & NA \tabularnewline
50 & NA & NA & NA \tabularnewline
51 & NA & NA & NA \tabularnewline
52 & NA & NA & NA \tabularnewline
53 & NA & NA & NA \tabularnewline
54 & NA & NA & NA \tabularnewline
55 & NA & NA & NA \tabularnewline
56 & NA & NA & NA \tabularnewline
57 & NA & NA & NA \tabularnewline
58 & NA & NA & NA \tabularnewline
59 & NA & NA & NA \tabularnewline
60 & NA & NA & NA \tabularnewline
\hline
\end{tabular}
%Source: https://freestatistics.org/blog/index.php?pk=33469&T=2

[TABLE]
[ROW][C]Partial Autocorrelation Function[/C][/ROW]
[ROW][C]Time lag k[/C][C]PACF(k)[/C][C]T-STAT[/C][C]P-value[/C][/ROW]
[ROW][C]1[/C][C]-0.056971[/C][C]-0.3947[/C][C]0.347405[/C][/ROW]
[ROW][C]2[/C][C]0.133592[/C][C]0.9256[/C][C]0.179655[/C][/ROW]
[ROW][C]3[/C][C]-0.1541[/C][C]-1.0676[/C][C]0.145513[/C][/ROW]
[ROW][C]4[/C][C]0.013478[/C][C]0.0934[/C][C]0.462995[/C][/ROW]
[ROW][C]5[/C][C]-0.174385[/C][C]-1.2082[/C][C]0.116449[/C][/ROW]
[ROW][C]6[/C][C]-0.004915[/C][C]-0.034[/C][C]0.486489[/C][/ROW]
[ROW][C]7[/C][C]0.161156[/C][C]1.1165[/C][C]0.134878[/C][/ROW]
[ROW][C]8[/C][C]-0.071528[/C][C]-0.4956[/C][C]0.311232[/C][/ROW]
[ROW][C]9[/C][C]0.081913[/C][C]0.5675[/C][C]0.286506[/C][/ROW]
[ROW][C]10[/C][C]-0.093527[/C][C]-0.648[/C][C]0.260046[/C][/ROW]
[ROW][C]11[/C][C]0.221454[/C][C]1.5343[/C][C]0.065763[/C][/ROW]
[ROW][C]12[/C][C]-0.181402[/C][C]-1.2568[/C][C]0.107456[/C][/ROW]
[ROW][C]13[/C][C]-0.131208[/C][C]-0.909[/C][C]0.183937[/C][/ROW]
[ROW][C]14[/C][C]0.114704[/C][C]0.7947[/C][C]0.215352[/C][/ROW]
[ROW][C]15[/C][C]-0.192359[/C][C]-1.3327[/C][C]0.094461[/C][/ROW]
[ROW][C]16[/C][C]-0.198956[/C][C]-1.3784[/C][C]0.087235[/C][/ROW]
[ROW][C]17[/C][C]-0.048299[/C][C]-0.3346[/C][C]0.369684[/C][/ROW]
[ROW][C]18[/C][C]0.019412[/C][C]0.1345[/C][C]0.446788[/C][/ROW]
[ROW][C]19[/C][C]-0.023237[/C][C]-0.161[/C][C]0.436388[/C][/ROW]
[ROW][C]20[/C][C]-0.066617[/C][C]-0.4615[/C][C]0.323249[/C][/ROW]
[ROW][C]21[/C][C]-0.025509[/C][C]-0.1767[/C][C]0.430232[/C][/ROW]
[ROW][C]22[/C][C]0.118548[/C][C]0.8213[/C][C]0.207762[/C][/ROW]
[ROW][C]23[/C][C]0.025235[/C][C]0.1748[/C][C]0.430974[/C][/ROW]
[ROW][C]24[/C][C]-0.030457[/C][C]-0.211[/C][C]0.416884[/C][/ROW]
[ROW][C]25[/C][C]-0.023353[/C][C]-0.1618[/C][C]0.436074[/C][/ROW]
[ROW][C]26[/C][C]0.103805[/C][C]0.7192[/C][C]0.237758[/C][/ROW]
[ROW][C]27[/C][C]0.068583[/C][C]0.4752[/C][C]0.318414[/C][/ROW]
[ROW][C]28[/C][C]-0.118111[/C][C]-0.8183[/C][C]0.208616[/C][/ROW]
[ROW][C]29[/C][C]-0.011512[/C][C]-0.0798[/C][C]0.468381[/C][/ROW]
[ROW][C]30[/C][C]-0.026809[/C][C]-0.1857[/C][C]0.426715[/C][/ROW]
[ROW][C]31[/C][C]0.077369[/C][C]0.536[/C][C]0.297207[/C][/ROW]
[ROW][C]32[/C][C]0.092991[/C][C]0.6443[/C][C]0.261236[/C][/ROW]
[ROW][C]33[/C][C]-0.104078[/C][C]-0.7211[/C][C]0.23718[/C][/ROW]
[ROW][C]34[/C][C]0.036325[/C][C]0.2517[/C][C]0.401186[/C][/ROW]
[ROW][C]35[/C][C]-0.044964[/C][C]-0.3115[/C][C]0.378378[/C][/ROW]
[ROW][C]36[/C][C]-0.103792[/C][C]-0.7191[/C][C]0.237785[/C][/ROW]
[ROW][C]37[/C][C]0.040937[/C][C]0.2836[/C][C]0.388961[/C][/ROW]
[ROW][C]38[/C][C]0.055753[/C][C]0.3863[/C][C]0.350503[/C][/ROW]
[ROW][C]39[/C][C]-0.015268[/C][C]-0.1058[/C][C]0.458099[/C][/ROW]
[ROW][C]40[/C][C]-0.146706[/C][C]-1.0164[/C][C]0.157265[/C][/ROW]
[ROW][C]41[/C][C]-0.049658[/C][C]-0.344[/C][C]0.36616[/C][/ROW]
[ROW][C]42[/C][C]-0.01128[/C][C]-0.0782[/C][C]0.469015[/C][/ROW]
[ROW][C]43[/C][C]0.02705[/C][C]0.1874[/C][C]0.426065[/C][/ROW]
[ROW][C]44[/C][C]0.000372[/C][C]0.0026[/C][C]0.498976[/C][/ROW]
[ROW][C]45[/C][C]-0.053656[/C][C]-0.3717[/C][C]0.355862[/C][/ROW]
[ROW][C]46[/C][C]0.025728[/C][C]0.1782[/C][C]0.429638[/C][/ROW]
[ROW][C]47[/C][C]0.05064[/C][C]0.3508[/C][C]0.363619[/C][/ROW]
[ROW][C]48[/C][C]NA[/C][C]NA[/C][C]NA[/C][/ROW]
[ROW][C]49[/C][C]NA[/C][C]NA[/C][C]NA[/C][/ROW]
[ROW][C]50[/C][C]NA[/C][C]NA[/C][C]NA[/C][/ROW]
[ROW][C]51[/C][C]NA[/C][C]NA[/C][C]NA[/C][/ROW]
[ROW][C]52[/C][C]NA[/C][C]NA[/C][C]NA[/C][/ROW]
[ROW][C]53[/C][C]NA[/C][C]NA[/C][C]NA[/C][/ROW]
[ROW][C]54[/C][C]NA[/C][C]NA[/C][C]NA[/C][/ROW]
[ROW][C]55[/C][C]NA[/C][C]NA[/C][C]NA[/C][/ROW]
[ROW][C]56[/C][C]NA[/C][C]NA[/C][C]NA[/C][/ROW]
[ROW][C]57[/C][C]NA[/C][C]NA[/C][C]NA[/C][/ROW]
[ROW][C]58[/C][C]NA[/C][C]NA[/C][C]NA[/C][/ROW]
[ROW][C]59[/C][C]NA[/C][C]NA[/C][C]NA[/C][/ROW]
[ROW][C]60[/C][C]NA[/C][C]NA[/C][C]NA[/C][/ROW]
[/TABLE]
Source: https://freestatistics.org/blog/index.php?pk=33469&T=2

Globally Unique Identifier (entire table): ba.freestatistics.org/blog/index.php?pk=33469&T=2

As an alternative you can also use a QR Code:  

The GUIDs for individual cells are displayed in the table below:

Partial Autocorrelation Function
Time lag kPACF(k)T-STATP-value
1-0.056971-0.39470.347405
20.1335920.92560.179655
3-0.1541-1.06760.145513
40.0134780.09340.462995
5-0.174385-1.20820.116449
6-0.004915-0.0340.486489
70.1611561.11650.134878
8-0.071528-0.49560.311232
90.0819130.56750.286506
10-0.093527-0.6480.260046
110.2214541.53430.065763
12-0.181402-1.25680.107456
13-0.131208-0.9090.183937
140.1147040.79470.215352
15-0.192359-1.33270.094461
16-0.198956-1.37840.087235
17-0.048299-0.33460.369684
180.0194120.13450.446788
19-0.023237-0.1610.436388
20-0.066617-0.46150.323249
21-0.025509-0.17670.430232
220.1185480.82130.207762
230.0252350.17480.430974
24-0.030457-0.2110.416884
25-0.023353-0.16180.436074
260.1038050.71920.237758
270.0685830.47520.318414
28-0.118111-0.81830.208616
29-0.011512-0.07980.468381
30-0.026809-0.18570.426715
310.0773690.5360.297207
320.0929910.64430.261236
33-0.104078-0.72110.23718
340.0363250.25170.401186
35-0.044964-0.31150.378378
36-0.103792-0.71910.237785
370.0409370.28360.388961
380.0557530.38630.350503
39-0.015268-0.10580.458099
40-0.146706-1.01640.157265
41-0.049658-0.3440.36616
42-0.01128-0.07820.469015
430.027050.18740.426065
440.0003720.00260.498976
45-0.053656-0.37170.355862
460.0257280.17820.429638
470.050640.35080.363619
48NANANA
49NANANA
50NANANA
51NANANA
52NANANA
53NANANA
54NANANA
55NANANA
56NANANA
57NANANA
58NANANA
59NANANA
60NANANA


Parameters (Session):
par1 = 60 ; par2 = 1 ; par3 = 1 ; par4 = 1 ; par5 = 12 ;
Parameters (R input):
par1 = 60 ; par2 = 1 ; par3 = 1 ; par4 = 1 ; par5 = 12 ;
R code (references can be found in the software module):
if (par1 == 'Default') {
par1 = 10*log10(length(x))
} else {
par1 <- as.numeric(par1)
}
par2 <- as.numeric(par2)
par3 <- as.numeric(par3)
par4 <- as.numeric(par4)
par5 <- as.numeric(par5)
if (par2 == 0) {
x <- log(x)
} else {
x <- (x ^ par2 - 1) / par2
}
if (par3 > 0) x <- diff(x,lag=1,difference=par3)
if (par4 > 0) x <- diff(x,lag=par5,difference=par4)
bitmap(file='pic1.png')
racf <- acf(x,par1,main='Autocorrelation',xlab='lags',ylab='ACF')
dev.off()
bitmap(file='pic2.png')
rpacf <- pacf(x,par1,main='Partial Autocorrelation',xlab='lags',ylab='PACF')
dev.off()
(myacf <- c(racf$acf))
(mypacf <- c(rpacf$acf))
lengthx <- length(x)
sqrtn <- sqrt(lengthx)
load(file='createtable')
a<-table.start()
a<-table.row.start(a)
a<-table.element(a,'Autocorrelation Function',4,TRUE)
a<-table.row.end(a)
a<-table.row.start(a)
a<-table.element(a,'Time lag k',header=TRUE)
a<-table.element(a,hyperlink('basics.htm','ACF(k)','click here for more information about the Autocorrelation Function'),header=TRUE)
a<-table.element(a,'T-STAT',header=TRUE)
a<-table.element(a,'P-value',header=TRUE)
a<-table.row.end(a)
for (i in 2:(par1+1)) {
a<-table.row.start(a)
a<-table.element(a,i-1,header=TRUE)
a<-table.element(a,round(myacf[i],6))
mytstat <- myacf[i]*sqrtn
a<-table.element(a,round(mytstat,4))
a<-table.element(a,round(1-pt(abs(mytstat),lengthx),6))
a<-table.row.end(a)
}
a<-table.end(a)
table.save(a,file='mytable.tab')
a<-table.start()
a<-table.row.start(a)
a<-table.element(a,'Partial Autocorrelation Function',4,TRUE)
a<-table.row.end(a)
a<-table.row.start(a)
a<-table.element(a,'Time lag k',header=TRUE)
a<-table.element(a,hyperlink('basics.htm','PACF(k)','click here for more information about the Partial Autocorrelation Function'),header=TRUE)
a<-table.element(a,'T-STAT',header=TRUE)
a<-table.element(a,'P-value',header=TRUE)
a<-table.row.end(a)
for (i in 1:par1) {
a<-table.row.start(a)
a<-table.element(a,i,header=TRUE)
a<-table.element(a,round(mypacf[i],6))
mytstat <- mypacf[i]*sqrtn
a<-table.element(a,round(mytstat,4))
a<-table.element(a,round(1-pt(abs(mytstat),lengthx),6))
a<-table.row.end(a)
}
a<-table.end(a)
table.save(a,file='mytable1.tab')