Free Statistics

of Irreproducible Research!

Author's title

Author*The author of this computation has been verified*
R Software Modulerwasp_arimaforecasting.wasp
Title produced by softwareARIMA Forecasting
Date of computationSun, 14 Dec 2008 08:58:35 -0700
Cite this page as followsStatistical Computations at FreeStatistics.org, Office for Research Development and Education, URL https://freestatistics.org/blog/index.php?v=date/2008/Dec/14/t12292703619cbeajpgybx59ah.htm/, Retrieved Wed, 15 May 2024 07:24:13 +0000
Statistical Computations at FreeStatistics.org, Office for Research Development and Education, URL https://freestatistics.org/blog/index.php?pk=33450, Retrieved Wed, 15 May 2024 07:24:13 +0000
QR Codes:

Original text written by user:
IsPrivate?No (this computation is public)
User-defined keywords
Estimated Impact220
Family? (F = Feedback message, R = changed R code, M = changed R Module, P = changed Parameters, D = changed Data)
F     [Variance Reduction Matrix] [workshop] [2008-12-14 15:44:19] [3a9fc6d5b5e0e816787b7dbace57e7cd]
F RMP   [Spectral Analysis] [workshop] [2008-12-14 15:45:47] [3a9fc6d5b5e0e816787b7dbace57e7cd]
F   P     [Spectral Analysis] [workshop] [2008-12-14 15:47:26] [3a9fc6d5b5e0e816787b7dbace57e7cd]
F RMP       [Standard Deviation-Mean Plot] [workshop] [2008-12-14 15:48:50] [3a9fc6d5b5e0e816787b7dbace57e7cd]
F RMP         [(Partial) Autocorrelation Function] [workshop] [2008-12-14 15:50:28] [3a9fc6d5b5e0e816787b7dbace57e7cd]
F RMP           [ARIMA Backward Selection] [workshop] [2008-12-14 15:55:32] [3a9fc6d5b5e0e816787b7dbace57e7cd]
F RMP               [ARIMA Forecasting] [workshop] [2008-12-14 15:58:35] [821c4b3d195be8e737cf8c9dc649d3cf] [Current]
Feedback Forum
2008-12-23 15:13:30 [Annemiek Hoofman] [reply
Wat meer uitleg bij stap 3:
De 2de kolom geeft de procentuele standaardfout weer, deze is berekent op basis van een model (een theoretische schatting). De 3de kolom toont de werkelijke fout (ook procentueel gezien). Deze lopen niet exact gelijk, dit is ook normaal aangezien het hier gaat over een voorspelling t.o.v. een echte waarde. De afwijkingen kunnen te wijten zijn aan onvoorzienbare gebeurtenissen (zoals politieke problemen, aanslagen,…)
2008-12-23 23:12:32 [Anouk Greeve] [reply
Interpretatie had wat uitgebreider gemogen, maar ze is wel correct. Evenals de berekeningen.
2008-12-23 23:15:51 [Anouk Greeve] [reply
step 3
Goede berekening en interpretatie.
In deze tabel kunnen we de theoretische schatting van de standaardfout op basis van het model aflezen (% SE). Daarnaast zien we de werkelijke fout (PE). Deze laatste is bijna altijd kleiner dan de voorspelde fout. Dit is een goed teken en wijst op een correct model.
2008-12-23 23:18:43 [Anouk Greeve] [reply
step 5
De verwachte standaardfouten zijn telkens groter dan de werkelijke voorspellingsfouten. Er zijn verschillende redenen waarom dit zou zijn. Bv: door de outliers. Wanneer we naar de tweede kolom kijken, merken we ook op dat hoe langer, hoe groter de standaardfout wordt. Dit is logisch aangezien we steeds verder in de toekomst voorspellen.
2008-12-24 07:36:10 [Gert-Jan Geudens] [reply
STEP 1 : Correct, Je hebt de tabellen goed besproken.

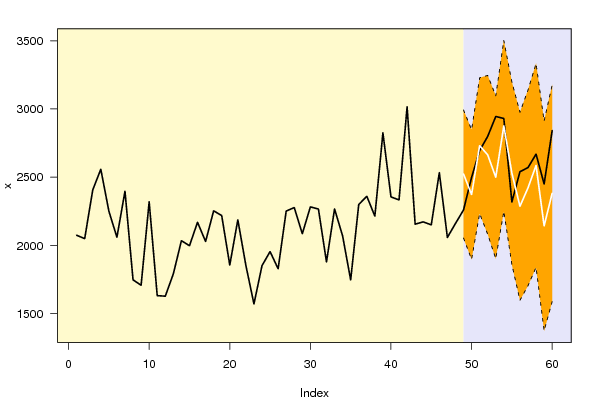
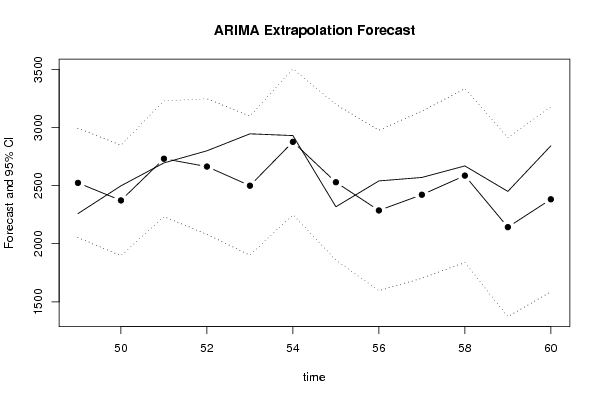
STEP 2 : Correct. We willen nog even het volgende vermelden : Bij de eerste grafiek is het oranje vak op het einde gelijk aan 95% betrouwbaarheidsinterval, de zwarte lijn is de werkelijke waarde en de witte lijn is de voorspelde waarde.

STEP 3 : Correct besproken

STEP 4 : Niet volledig. Of aan de assumpties is voldaan kan je via de residu's bij de ARIMA Backward Selection testen.

STEP 5 : Correct, voldoende argumentatie gegeven waarom dit inderdaad een goede voorspelling is.

Post a new message
Dataseries X:
2074
2049
2406
2558
2251
2059
2397
1747
1707
2319
1631
1627
1791
2034
1997
2169
2028
2253
2218
1855
2187
1852
1570
1851
1954
1828
2251
2277
2085
2282
2266
1878
2267
2069
1746
2299
2360
2214
2825
2355
2333
3016
2155
2172
2150
2533
2058
2160
2259
2498
2695
2799
2945
2930
2318
2540
2570
2669
2450
2842


Summary of computational transaction
Raw Inputview raw input (R code)
Raw Outputview raw output of R engine
Computing time3 seconds
R Server'Sir Ronald Aylmer Fisher' @ 193.190.124.24

\begin{tabular}{lllllllll}
\hline
Summary of computational transaction \tabularnewline
Raw Input & view raw input (R code)  \tabularnewline
Raw Output & view raw output of R engine  \tabularnewline
Computing time & 3 seconds \tabularnewline
R Server & 'Sir Ronald Aylmer Fisher' @ 193.190.124.24 \tabularnewline
\hline
\end{tabular}
%Source: https://freestatistics.org/blog/index.php?pk=33450&T=0

[TABLE]
[ROW][C]Summary of computational transaction[/C][/ROW]
[ROW][C]Raw Input[/C][C]view raw input (R code) [/C][/ROW]
[ROW][C]Raw Output[/C][C]view raw output of R engine [/C][/ROW]
[ROW][C]Computing time[/C][C]3 seconds[/C][/ROW]
[ROW][C]R Server[/C][C]'Sir Ronald Aylmer Fisher' @ 193.190.124.24[/C][/ROW]
[/TABLE]
Source: https://freestatistics.org/blog/index.php?pk=33450&T=0

Globally Unique Identifier (entire table): ba.freestatistics.org/blog/index.php?pk=33450&T=0

As an alternative you can also use a QR Code:  

The GUIDs for individual cells are displayed in the table below:

Summary of computational transaction
Raw Inputview raw input (R code)
Raw Outputview raw output of R engine
Computing time3 seconds
R Server'Sir Ronald Aylmer Fisher' @ 193.190.124.24


Univariate ARIMA Extrapolation Forecast
timeY[t]F[t]95% LB95% UBp-value(H0: Y[t] = F[t])P(F[t]>Y[t-1])P(F[t]>Y[t-s])P(F[t]>Y[48])
362299-------
372360-------
382214-------
392825-------
402355-------
412333-------
423016-------
432155-------
442172-------
452150-------
462533-------
472058-------
482160-------
4922592523.11792053.44982992.78590.13520.93520.7520.9352
5024982372.40241897.02222847.78260.30230.680.74320.8094
5126952730.93292233.23783228.62790.44370.82050.35550.9877
5227992663.48772080.78723246.18820.32430.45780.85030.9548
5329452499.05651901.76213096.35080.07170.16250.70710.8671
5429302876.05552249.32083502.79030.4330.41460.33080.9874
5523182528.77441859.21943198.32940.26860.12010.86310.8598
5625402286.27611596.772975.78220.23540.46410.62730.6402
5725702421.37131703.74783138.99480.34240.3730.77070.7623
5826692585.8321838.2563333.4080.41370.51660.55510.8679
5924502142.48741373.17452911.80040.21670.08990.58520.4822
6028422382.19511587.61893176.77140.12840.43360.70820.7082

\begin{tabular}{lllllllll}
\hline
Univariate ARIMA Extrapolation Forecast \tabularnewline
time & Y[t] & F[t] & 95% LB & 95% UB & p-value(H0: Y[t] = F[t]) & P(F[t]>Y[t-1]) & P(F[t]>Y[t-s]) & P(F[t]>Y[48]) \tabularnewline
36 & 2299 & - & - & - & - & - & - & - \tabularnewline
37 & 2360 & - & - & - & - & - & - & - \tabularnewline
38 & 2214 & - & - & - & - & - & - & - \tabularnewline
39 & 2825 & - & - & - & - & - & - & - \tabularnewline
40 & 2355 & - & - & - & - & - & - & - \tabularnewline
41 & 2333 & - & - & - & - & - & - & - \tabularnewline
42 & 3016 & - & - & - & - & - & - & - \tabularnewline
43 & 2155 & - & - & - & - & - & - & - \tabularnewline
44 & 2172 & - & - & - & - & - & - & - \tabularnewline
45 & 2150 & - & - & - & - & - & - & - \tabularnewline
46 & 2533 & - & - & - & - & - & - & - \tabularnewline
47 & 2058 & - & - & - & - & - & - & - \tabularnewline
48 & 2160 & - & - & - & - & - & - & - \tabularnewline
49 & 2259 & 2523.1179 & 2053.4498 & 2992.7859 & 0.1352 & 0.9352 & 0.752 & 0.9352 \tabularnewline
50 & 2498 & 2372.4024 & 1897.0222 & 2847.7826 & 0.3023 & 0.68 & 0.7432 & 0.8094 \tabularnewline
51 & 2695 & 2730.9329 & 2233.2378 & 3228.6279 & 0.4437 & 0.8205 & 0.3555 & 0.9877 \tabularnewline
52 & 2799 & 2663.4877 & 2080.7872 & 3246.1882 & 0.3243 & 0.4578 & 0.8503 & 0.9548 \tabularnewline
53 & 2945 & 2499.0565 & 1901.7621 & 3096.3508 & 0.0717 & 0.1625 & 0.7071 & 0.8671 \tabularnewline
54 & 2930 & 2876.0555 & 2249.3208 & 3502.7903 & 0.433 & 0.4146 & 0.3308 & 0.9874 \tabularnewline
55 & 2318 & 2528.7744 & 1859.2194 & 3198.3294 & 0.2686 & 0.1201 & 0.8631 & 0.8598 \tabularnewline
56 & 2540 & 2286.2761 & 1596.77 & 2975.7822 & 0.2354 & 0.4641 & 0.6273 & 0.6402 \tabularnewline
57 & 2570 & 2421.3713 & 1703.7478 & 3138.9948 & 0.3424 & 0.373 & 0.7707 & 0.7623 \tabularnewline
58 & 2669 & 2585.832 & 1838.256 & 3333.408 & 0.4137 & 0.5166 & 0.5551 & 0.8679 \tabularnewline
59 & 2450 & 2142.4874 & 1373.1745 & 2911.8004 & 0.2167 & 0.0899 & 0.5852 & 0.4822 \tabularnewline
60 & 2842 & 2382.1951 & 1587.6189 & 3176.7714 & 0.1284 & 0.4336 & 0.7082 & 0.7082 \tabularnewline
\hline
\end{tabular}
%Source: https://freestatistics.org/blog/index.php?pk=33450&T=1

[TABLE]
[ROW][C]Univariate ARIMA Extrapolation Forecast[/C][/ROW]
[ROW][C]time[/C][C]Y[t][/C][C]F[t][/C][C]95% LB[/C][C]95% UB[/C][C]p-value(H0: Y[t] = F[t])[/C][C]P(F[t]>Y[t-1])[/C][C]P(F[t]>Y[t-s])[/C][C]P(F[t]>Y[48])[/C][/ROW]
[ROW][C]36[/C][C]2299[/C][C]-[/C][C]-[/C][C]-[/C][C]-[/C][C]-[/C][C]-[/C][C]-[/C][/ROW]
[ROW][C]37[/C][C]2360[/C][C]-[/C][C]-[/C][C]-[/C][C]-[/C][C]-[/C][C]-[/C][C]-[/C][/ROW]
[ROW][C]38[/C][C]2214[/C][C]-[/C][C]-[/C][C]-[/C][C]-[/C][C]-[/C][C]-[/C][C]-[/C][/ROW]
[ROW][C]39[/C][C]2825[/C][C]-[/C][C]-[/C][C]-[/C][C]-[/C][C]-[/C][C]-[/C][C]-[/C][/ROW]
[ROW][C]40[/C][C]2355[/C][C]-[/C][C]-[/C][C]-[/C][C]-[/C][C]-[/C][C]-[/C][C]-[/C][/ROW]
[ROW][C]41[/C][C]2333[/C][C]-[/C][C]-[/C][C]-[/C][C]-[/C][C]-[/C][C]-[/C][C]-[/C][/ROW]
[ROW][C]42[/C][C]3016[/C][C]-[/C][C]-[/C][C]-[/C][C]-[/C][C]-[/C][C]-[/C][C]-[/C][/ROW]
[ROW][C]43[/C][C]2155[/C][C]-[/C][C]-[/C][C]-[/C][C]-[/C][C]-[/C][C]-[/C][C]-[/C][/ROW]
[ROW][C]44[/C][C]2172[/C][C]-[/C][C]-[/C][C]-[/C][C]-[/C][C]-[/C][C]-[/C][C]-[/C][/ROW]
[ROW][C]45[/C][C]2150[/C][C]-[/C][C]-[/C][C]-[/C][C]-[/C][C]-[/C][C]-[/C][C]-[/C][/ROW]
[ROW][C]46[/C][C]2533[/C][C]-[/C][C]-[/C][C]-[/C][C]-[/C][C]-[/C][C]-[/C][C]-[/C][/ROW]
[ROW][C]47[/C][C]2058[/C][C]-[/C][C]-[/C][C]-[/C][C]-[/C][C]-[/C][C]-[/C][C]-[/C][/ROW]
[ROW][C]48[/C][C]2160[/C][C]-[/C][C]-[/C][C]-[/C][C]-[/C][C]-[/C][C]-[/C][C]-[/C][/ROW]
[ROW][C]49[/C][C]2259[/C][C]2523.1179[/C][C]2053.4498[/C][C]2992.7859[/C][C]0.1352[/C][C]0.9352[/C][C]0.752[/C][C]0.9352[/C][/ROW]
[ROW][C]50[/C][C]2498[/C][C]2372.4024[/C][C]1897.0222[/C][C]2847.7826[/C][C]0.3023[/C][C]0.68[/C][C]0.7432[/C][C]0.8094[/C][/ROW]
[ROW][C]51[/C][C]2695[/C][C]2730.9329[/C][C]2233.2378[/C][C]3228.6279[/C][C]0.4437[/C][C]0.8205[/C][C]0.3555[/C][C]0.9877[/C][/ROW]
[ROW][C]52[/C][C]2799[/C][C]2663.4877[/C][C]2080.7872[/C][C]3246.1882[/C][C]0.3243[/C][C]0.4578[/C][C]0.8503[/C][C]0.9548[/C][/ROW]
[ROW][C]53[/C][C]2945[/C][C]2499.0565[/C][C]1901.7621[/C][C]3096.3508[/C][C]0.0717[/C][C]0.1625[/C][C]0.7071[/C][C]0.8671[/C][/ROW]
[ROW][C]54[/C][C]2930[/C][C]2876.0555[/C][C]2249.3208[/C][C]3502.7903[/C][C]0.433[/C][C]0.4146[/C][C]0.3308[/C][C]0.9874[/C][/ROW]
[ROW][C]55[/C][C]2318[/C][C]2528.7744[/C][C]1859.2194[/C][C]3198.3294[/C][C]0.2686[/C][C]0.1201[/C][C]0.8631[/C][C]0.8598[/C][/ROW]
[ROW][C]56[/C][C]2540[/C][C]2286.2761[/C][C]1596.77[/C][C]2975.7822[/C][C]0.2354[/C][C]0.4641[/C][C]0.6273[/C][C]0.6402[/C][/ROW]
[ROW][C]57[/C][C]2570[/C][C]2421.3713[/C][C]1703.7478[/C][C]3138.9948[/C][C]0.3424[/C][C]0.373[/C][C]0.7707[/C][C]0.7623[/C][/ROW]
[ROW][C]58[/C][C]2669[/C][C]2585.832[/C][C]1838.256[/C][C]3333.408[/C][C]0.4137[/C][C]0.5166[/C][C]0.5551[/C][C]0.8679[/C][/ROW]
[ROW][C]59[/C][C]2450[/C][C]2142.4874[/C][C]1373.1745[/C][C]2911.8004[/C][C]0.2167[/C][C]0.0899[/C][C]0.5852[/C][C]0.4822[/C][/ROW]
[ROW][C]60[/C][C]2842[/C][C]2382.1951[/C][C]1587.6189[/C][C]3176.7714[/C][C]0.1284[/C][C]0.4336[/C][C]0.7082[/C][C]0.7082[/C][/ROW]
[/TABLE]
Source: https://freestatistics.org/blog/index.php?pk=33450&T=1

Globally Unique Identifier (entire table): ba.freestatistics.org/blog/index.php?pk=33450&T=1

As an alternative you can also use a QR Code:  

The GUIDs for individual cells are displayed in the table below:

Univariate ARIMA Extrapolation Forecast
timeY[t]F[t]95% LB95% UBp-value(H0: Y[t] = F[t])P(F[t]>Y[t-1])P(F[t]>Y[t-s])P(F[t]>Y[48])
362299-------
372360-------
382214-------
392825-------
402355-------
412333-------
423016-------
432155-------
442172-------
452150-------
462533-------
472058-------
482160-------
4922592523.11792053.44982992.78590.13520.93520.7520.9352
5024982372.40241897.02222847.78260.30230.680.74320.8094
5126952730.93292233.23783228.62790.44370.82050.35550.9877
5227992663.48772080.78723246.18820.32430.45780.85030.9548
5329452499.05651901.76213096.35080.07170.16250.70710.8671
5429302876.05552249.32083502.79030.4330.41460.33080.9874
5523182528.77441859.21943198.32940.26860.12010.86310.8598
5625402286.27611596.772975.78220.23540.46410.62730.6402
5725702421.37131703.74783138.99480.34240.3730.77070.7623
5826692585.8321838.2563333.4080.41370.51660.55510.8679
5924502142.48741373.17452911.80040.21670.08990.58520.4822
6028422382.19511587.61893176.77140.12840.43360.70820.7082


Univariate ARIMA Extrapolation Forecast Performance
time% S.E.PEMAPESq.EMSERMSE
490.095-0.10470.008769758.2615813.188476.2443
500.10220.05290.004415774.7481314.562336.2569
510.093-0.01320.00111291.1699107.597510.3729
520.11160.05090.004218363.5911530.299339.119
530.12190.17840.0149198865.617316572.1348128.7328
540.11120.01880.00162910.0065242.500515.5724
550.1351-0.08340.006944425.84933702.154160.8453
560.15390.1110.009264375.8345364.652873.2438
570.15120.06140.005122090.49081840.874242.9054
580.14750.03220.00276916.912576.409324.0085
590.18320.14350.01294563.97127880.330988.7712
600.17020.1930.0161211420.518317618.3765132.7342

\begin{tabular}{lllllllll}
\hline
Univariate ARIMA Extrapolation Forecast Performance \tabularnewline
time & % S.E. & PE & MAPE & Sq.E & MSE & RMSE \tabularnewline
49 & 0.095 & -0.1047 & 0.0087 & 69758.261 & 5813.1884 & 76.2443 \tabularnewline
50 & 0.1022 & 0.0529 & 0.0044 & 15774.748 & 1314.5623 & 36.2569 \tabularnewline
51 & 0.093 & -0.0132 & 0.0011 & 1291.1699 & 107.5975 & 10.3729 \tabularnewline
52 & 0.1116 & 0.0509 & 0.0042 & 18363.591 & 1530.2993 & 39.119 \tabularnewline
53 & 0.1219 & 0.1784 & 0.0149 & 198865.6173 & 16572.1348 & 128.7328 \tabularnewline
54 & 0.1112 & 0.0188 & 0.0016 & 2910.0065 & 242.5005 & 15.5724 \tabularnewline
55 & 0.1351 & -0.0834 & 0.0069 & 44425.8493 & 3702.1541 & 60.8453 \tabularnewline
56 & 0.1539 & 0.111 & 0.0092 & 64375.834 & 5364.6528 & 73.2438 \tabularnewline
57 & 0.1512 & 0.0614 & 0.0051 & 22090.4908 & 1840.8742 & 42.9054 \tabularnewline
58 & 0.1475 & 0.0322 & 0.0027 & 6916.912 & 576.4093 & 24.0085 \tabularnewline
59 & 0.1832 & 0.1435 & 0.012 & 94563.9712 & 7880.3309 & 88.7712 \tabularnewline
60 & 0.1702 & 0.193 & 0.0161 & 211420.5183 & 17618.3765 & 132.7342 \tabularnewline
\hline
\end{tabular}
%Source: https://freestatistics.org/blog/index.php?pk=33450&T=2

[TABLE]
[ROW][C]Univariate ARIMA Extrapolation Forecast Performance[/C][/ROW]
[ROW][C]time[/C][C]% S.E.[/C][C]PE[/C][C]MAPE[/C][C]Sq.E[/C][C]MSE[/C][C]RMSE[/C][/ROW]
[ROW][C]49[/C][C]0.095[/C][C]-0.1047[/C][C]0.0087[/C][C]69758.261[/C][C]5813.1884[/C][C]76.2443[/C][/ROW]
[ROW][C]50[/C][C]0.1022[/C][C]0.0529[/C][C]0.0044[/C][C]15774.748[/C][C]1314.5623[/C][C]36.2569[/C][/ROW]
[ROW][C]51[/C][C]0.093[/C][C]-0.0132[/C][C]0.0011[/C][C]1291.1699[/C][C]107.5975[/C][C]10.3729[/C][/ROW]
[ROW][C]52[/C][C]0.1116[/C][C]0.0509[/C][C]0.0042[/C][C]18363.591[/C][C]1530.2993[/C][C]39.119[/C][/ROW]
[ROW][C]53[/C][C]0.1219[/C][C]0.1784[/C][C]0.0149[/C][C]198865.6173[/C][C]16572.1348[/C][C]128.7328[/C][/ROW]
[ROW][C]54[/C][C]0.1112[/C][C]0.0188[/C][C]0.0016[/C][C]2910.0065[/C][C]242.5005[/C][C]15.5724[/C][/ROW]
[ROW][C]55[/C][C]0.1351[/C][C]-0.0834[/C][C]0.0069[/C][C]44425.8493[/C][C]3702.1541[/C][C]60.8453[/C][/ROW]
[ROW][C]56[/C][C]0.1539[/C][C]0.111[/C][C]0.0092[/C][C]64375.834[/C][C]5364.6528[/C][C]73.2438[/C][/ROW]
[ROW][C]57[/C][C]0.1512[/C][C]0.0614[/C][C]0.0051[/C][C]22090.4908[/C][C]1840.8742[/C][C]42.9054[/C][/ROW]
[ROW][C]58[/C][C]0.1475[/C][C]0.0322[/C][C]0.0027[/C][C]6916.912[/C][C]576.4093[/C][C]24.0085[/C][/ROW]
[ROW][C]59[/C][C]0.1832[/C][C]0.1435[/C][C]0.012[/C][C]94563.9712[/C][C]7880.3309[/C][C]88.7712[/C][/ROW]
[ROW][C]60[/C][C]0.1702[/C][C]0.193[/C][C]0.0161[/C][C]211420.5183[/C][C]17618.3765[/C][C]132.7342[/C][/ROW]
[/TABLE]
Source: https://freestatistics.org/blog/index.php?pk=33450&T=2

Globally Unique Identifier (entire table): ba.freestatistics.org/blog/index.php?pk=33450&T=2

As an alternative you can also use a QR Code:  

The GUIDs for individual cells are displayed in the table below:

Univariate ARIMA Extrapolation Forecast Performance
time% S.E.PEMAPESq.EMSERMSE
490.095-0.10470.008769758.2615813.188476.2443
500.10220.05290.004415774.7481314.562336.2569
510.093-0.01320.00111291.1699107.597510.3729
520.11160.05090.004218363.5911530.299339.119
530.12190.17840.0149198865.617316572.1348128.7328
540.11120.01880.00162910.0065242.500515.5724
550.1351-0.08340.006944425.84933702.154160.8453
560.15390.1110.009264375.8345364.652873.2438
570.15120.06140.005122090.49081840.874242.9054
580.14750.03220.00276916.912576.409324.0085
590.18320.14350.01294563.97127880.330988.7712
600.17020.1930.0161211420.518317618.3765132.7342


Parameters (Session):
par1 = 12 ; par2 = 1.0 ; par3 = 1 ; par4 = 1 ; par5 = 12 ; par6 = 2 ; par7 = 0 ; par8 = 0 ; par9 = 1 ; par10 = FALSE ;
Parameters (R input):
par1 = 12 ; par2 = 1.0 ; par3 = 1 ; par4 = 1 ; par5 = 12 ; par6 = 2 ; par7 = 0 ; par8 = 0 ; par9 = 1 ; par10 = FALSE ;
R code (references can be found in the software module):
par1 <- as.numeric(par1) #cut off periods
par2 <- as.numeric(par2) #lambda
par3 <- as.numeric(par3) #degree of non-seasonal differencing
par4 <- as.numeric(par4) #degree of seasonal differencing
par5 <- as.numeric(par5) #seasonal period
par6 <- as.numeric(par6) #p
par7 <- as.numeric(par7) #q
par8 <- as.numeric(par8) #P
par9 <- as.numeric(par9) #Q
if (par10 == 'TRUE') par10 <- TRUE
if (par10 == 'FALSE') par10 <- FALSE
if (par2 == 0) x <- log(x)
if (par2 != 0) x <- x^par2
lx <- length(x)
first <- lx - 2*par1
nx <- lx - par1
nx1 <- nx + 1
fx <- lx - nx
if (fx < 1) {
fx <- par5
nx1 <- lx + fx - 1
first <- lx - 2*fx
}
first <- 1
if (fx < 3) fx <- round(lx/10,0)
(arima.out <- arima(x[1:nx], order=c(par6,par3,par7), seasonal=list(order=c(par8,par4,par9), period=par5), include.mean=par10, method='ML'))
(forecast <- predict(arima.out,fx))
(lb <- forecast$pred - 1.96 * forecast$se)
(ub <- forecast$pred + 1.96 * forecast$se)
if (par2 == 0) {
x <- exp(x)
forecast$pred <- exp(forecast$pred)
lb <- exp(lb)
ub <- exp(ub)
}
if (par2 != 0) {
x <- x^(1/par2)
forecast$pred <- forecast$pred^(1/par2)
lb <- lb^(1/par2)
ub <- ub^(1/par2)
}
if (par2 < 0) {
olb <- lb
lb <- ub
ub <- olb
}
(actandfor <- c(x[1:nx], forecast$pred))
(perc.se <- (ub-forecast$pred)/1.96/forecast$pred)
bitmap(file='test1.png')
opar <- par(mar=c(4,4,2,2),las=1)
ylim <- c( min(x[first:nx],lb), max(x[first:nx],ub))
plot(x,ylim=ylim,type='n',xlim=c(first,lx))
usr <- par('usr')
rect(usr[1],usr[3],nx+1,usr[4],border=NA,col='lemonchiffon')
rect(nx1,usr[3],usr[2],usr[4],border=NA,col='lavender')
abline(h= (-3:3)*2 , col ='gray', lty =3)
polygon( c(nx1:lx,lx:nx1), c(lb,rev(ub)), col = 'orange', lty=2,border=NA)
lines(nx1:lx, lb , lty=2)
lines(nx1:lx, ub , lty=2)
lines(x, lwd=2)
lines(nx1:lx, forecast$pred , lwd=2 , col ='white')
box()
par(opar)
dev.off()
prob.dec <- array(NA, dim=fx)
prob.sdec <- array(NA, dim=fx)
prob.ldec <- array(NA, dim=fx)
prob.pval <- array(NA, dim=fx)
perf.pe <- array(0, dim=fx)
perf.mape <- array(0, dim=fx)
perf.se <- array(0, dim=fx)
perf.mse <- array(0, dim=fx)
perf.rmse <- array(0, dim=fx)
for (i in 1:fx) {
locSD <- (ub[i] - forecast$pred[i]) / 1.96
perf.pe[i] = (x[nx+i] - forecast$pred[i]) / forecast$pred[i]
perf.mape[i] = perf.mape[i] + abs(perf.pe[i])
perf.se[i] = (x[nx+i] - forecast$pred[i])^2
perf.mse[i] = perf.mse[i] + perf.se[i]
prob.dec[i] = pnorm((x[nx+i-1] - forecast$pred[i]) / locSD)
prob.sdec[i] = pnorm((x[nx+i-par5] - forecast$pred[i]) / locSD)
prob.ldec[i] = pnorm((x[nx] - forecast$pred[i]) / locSD)
prob.pval[i] = pnorm(abs(x[nx+i] - forecast$pred[i]) / locSD)
}
perf.mape = perf.mape / fx
perf.mse = perf.mse / fx
perf.rmse = sqrt(perf.mse)
bitmap(file='test2.png')
plot(forecast$pred, pch=19, type='b',main='ARIMA Extrapolation Forecast', ylab='Forecast and 95% CI', xlab='time',ylim=c(min(lb),max(ub)))
dum <- forecast$pred
dum[1:12] <- x[(nx+1):lx]
lines(dum, lty=1)
lines(ub,lty=3)
lines(lb,lty=3)
dev.off()
load(file='createtable')
a<-table.start()
a<-table.row.start(a)
a<-table.element(a,'Univariate ARIMA Extrapolation Forecast',9,TRUE)
a<-table.row.end(a)
a<-table.row.start(a)
a<-table.element(a,'time',1,header=TRUE)
a<-table.element(a,'Y[t]',1,header=TRUE)
a<-table.element(a,'F[t]',1,header=TRUE)
a<-table.element(a,'95% LB',1,header=TRUE)
a<-table.element(a,'95% UB',1,header=TRUE)
a<-table.element(a,'p-value
(H0: Y[t] = F[t])',1,header=TRUE)
a<-table.element(a,'P(F[t]>Y[t-1])',1,header=TRUE)
a<-table.element(a,'P(F[t]>Y[t-s])',1,header=TRUE)
mylab <- paste('P(F[t]>Y[',nx,sep='')
mylab <- paste(mylab,'])',sep='')
a<-table.element(a,mylab,1,header=TRUE)
a<-table.row.end(a)
for (i in (nx-par5):nx) {
a<-table.row.start(a)
a<-table.element(a,i,header=TRUE)
a<-table.element(a,x[i])
a<-table.element(a,'-')
a<-table.row.end(a)
}
for (i in 1:fx) {
a<-table.row.start(a)
a<-table.element(a,nx+i,header=TRUE)
a<-table.element(a,round(x[nx+i],4))
a<-table.element(a,round(forecast$pred[i],4))
a<-table.element(a,round(lb[i],4))
a<-table.element(a,round(ub[i],4))
a<-table.element(a,round((1-prob.pval[i]),4))
a<-table.element(a,round((1-prob.dec[i]),4))
a<-table.element(a,round((1-prob.sdec[i]),4))
a<-table.element(a,round((1-prob.ldec[i]),4))
a<-table.row.end(a)
}
a<-table.end(a)
table.save(a,file='mytable.tab')
a<-table.start()
a<-table.row.start(a)
a<-table.element(a,'Univariate ARIMA Extrapolation Forecast Performance',7,TRUE)
a<-table.row.end(a)
a<-table.row.start(a)
a<-table.element(a,'time',1,header=TRUE)
a<-table.element(a,'% S.E.',1,header=TRUE)
a<-table.element(a,'PE',1,header=TRUE)
a<-table.element(a,'MAPE',1,header=TRUE)
a<-table.element(a,'Sq.E',1,header=TRUE)
a<-table.element(a,'MSE',1,header=TRUE)
a<-table.element(a,'RMSE',1,header=TRUE)
a<-table.row.end(a)
for (i in 1:fx) {
a<-table.row.start(a)
a<-table.element(a,nx+i,header=TRUE)
a<-table.element(a,round(perc.se[i],4))
a<-table.element(a,round(perf.pe[i],4))
a<-table.element(a,round(perf.mape[i],4))
a<-table.element(a,round(perf.se[i],4))
a<-table.element(a,round(perf.mse[i],4))
a<-table.element(a,round(perf.rmse[i],4))
a<-table.row.end(a)
}
a<-table.end(a)
table.save(a,file='mytable1.tab')