Free Statistics

of Irreproducible Research!

Author's title

Author*The author of this computation has been verified*
R Software Modulerwasp_autocorrelation.wasp
Title produced by software(Partial) Autocorrelation Function
Date of computationSun, 14 Dec 2008 08:55:37 -0700
Cite this page as followsStatistical Computations at FreeStatistics.org, Office for Research Development and Education, URL https://freestatistics.org/blog/index.php?v=date/2008/Dec/14/t1229270240hkhyhql9k9i1zup.htm/, Retrieved Wed, 15 May 2024 02:45:11 +0000
Statistical Computations at FreeStatistics.org, Office for Research Development and Education, URL https://freestatistics.org/blog/index.php?pk=33446, Retrieved Wed, 15 May 2024 02:45:11 +0000
QR Codes:

Original text written by user:
IsPrivate?No (this computation is public)
User-defined keywords
Estimated Impact181
Family? (F = Feedback message, R = changed R code, M = changed R Module, P = changed Parameters, D = changed Data)
-     [(Partial) Autocorrelation Function] [(P)ACF Totale omzet] [2007-12-20 14:02:48] [74be16979710d4c4e7c6647856088456]
- R PD    [(Partial) Autocorrelation Function] [werkloosheid] [2008-12-14 15:55:37] [5925747fb2a6bb4cfcd8015825ee5e92] [Current]
Feedback Forum

Post a new message
Dataseries X:
180144
173666
165688
161570
156145
153730
182698
200765
176512
166618
158644
159585
163095
159044
155511
153745
150569
150605
179612
194690
189917
184128
175335
179566
181140
177876
175041
169292
166070
166972
206348
215706
202108
195411
193111
195198
198770
194163
190420
189733
186029
191531
232571
243477
227247
217859
208679
213188
216234
213586
209465
204045
200237
203666
241476
260307
243324
244460
233575
237217
235243
230354
227184
221678
217142
219452
256446
265845
248624
241114
229245
231805
219277
219313
212610
214771
211142
211457
240048
240636
230580
208795
197922
194596


Summary of computational transaction
Raw Inputview raw input (R code)
Raw Outputview raw output of R engine
Computing time1 seconds
R Server'Gwilym Jenkins' @ 72.249.127.135

\begin{tabular}{lllllllll}
\hline
Summary of computational transaction \tabularnewline
Raw Input & view raw input (R code)  \tabularnewline
Raw Output & view raw output of R engine  \tabularnewline
Computing time & 1 seconds \tabularnewline
R Server & 'Gwilym Jenkins' @ 72.249.127.135 \tabularnewline
\hline
\end{tabular}
%Source: https://freestatistics.org/blog/index.php?pk=33446&T=0

[TABLE]
[ROW][C]Summary of computational transaction[/C][/ROW]
[ROW][C]Raw Input[/C][C]view raw input (R code) [/C][/ROW]
[ROW][C]Raw Output[/C][C]view raw output of R engine [/C][/ROW]
[ROW][C]Computing time[/C][C]1 seconds[/C][/ROW]
[ROW][C]R Server[/C][C]'Gwilym Jenkins' @ 72.249.127.135[/C][/ROW]
[/TABLE]
Source: https://freestatistics.org/blog/index.php?pk=33446&T=0

Globally Unique Identifier (entire table): ba.freestatistics.org/blog/index.php?pk=33446&T=0

As an alternative you can also use a QR Code:  

The GUIDs for individual cells are displayed in the table below:

Summary of computational transaction
Raw Inputview raw input (R code)
Raw Outputview raw output of R engine
Computing time1 seconds
R Server'Gwilym Jenkins' @ 72.249.127.135


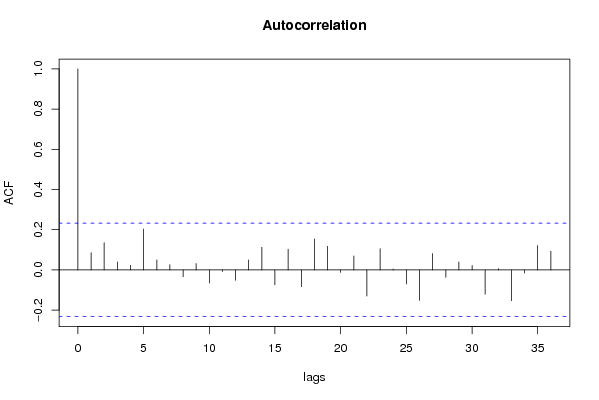
Autocorrelation Function
Time lag kACF(k)T-STATP-value
10.0856730.72190.236364
20.1357371.14370.128286
30.0395020.33280.370115
40.023040.19410.423311
50.2031891.71210.045622
60.0495430.41750.338801
70.026120.22010.413217
8-0.033576-0.28290.389033
90.0313160.26390.396323
10-0.065117-0.54870.29247
11-0.008475-0.07140.471634
12-0.05198-0.4380.33136
130.0495890.41780.338661
140.1123560.94670.173494
15-0.074338-0.62640.266535
160.1028590.86670.194513
17-0.083315-0.7020.24248
180.154331.30040.098833
190.1174430.98960.162866
20-0.012862-0.10840.457
210.0692730.58370.280635
22-0.130317-1.09810.137943
230.1058240.89170.187786
240.0045250.03810.484846
25-0.069809-0.58820.279124
26-0.152084-1.28150.102097
270.0816630.68810.246815
28-0.036779-0.30990.378771
290.0397580.3350.369304
300.0223720.18850.425508
31-0.12115-1.02080.155402
320.0063280.05330.478814
33-0.153296-1.29170.100326
34-0.015254-0.12850.449046
350.1213281.02230.155049
360.0923010.77770.219653

\begin{tabular}{lllllllll}
\hline
Autocorrelation Function \tabularnewline
Time lag k & ACF(k) & T-STAT & P-value \tabularnewline
1 & 0.085673 & 0.7219 & 0.236364 \tabularnewline
2 & 0.135737 & 1.1437 & 0.128286 \tabularnewline
3 & 0.039502 & 0.3328 & 0.370115 \tabularnewline
4 & 0.02304 & 0.1941 & 0.423311 \tabularnewline
5 & 0.203189 & 1.7121 & 0.045622 \tabularnewline
6 & 0.049543 & 0.4175 & 0.338801 \tabularnewline
7 & 0.02612 & 0.2201 & 0.413217 \tabularnewline
8 & -0.033576 & -0.2829 & 0.389033 \tabularnewline
9 & 0.031316 & 0.2639 & 0.396323 \tabularnewline
10 & -0.065117 & -0.5487 & 0.29247 \tabularnewline
11 & -0.008475 & -0.0714 & 0.471634 \tabularnewline
12 & -0.05198 & -0.438 & 0.33136 \tabularnewline
13 & 0.049589 & 0.4178 & 0.338661 \tabularnewline
14 & 0.112356 & 0.9467 & 0.173494 \tabularnewline
15 & -0.074338 & -0.6264 & 0.266535 \tabularnewline
16 & 0.102859 & 0.8667 & 0.194513 \tabularnewline
17 & -0.083315 & -0.702 & 0.24248 \tabularnewline
18 & 0.15433 & 1.3004 & 0.098833 \tabularnewline
19 & 0.117443 & 0.9896 & 0.162866 \tabularnewline
20 & -0.012862 & -0.1084 & 0.457 \tabularnewline
21 & 0.069273 & 0.5837 & 0.280635 \tabularnewline
22 & -0.130317 & -1.0981 & 0.137943 \tabularnewline
23 & 0.105824 & 0.8917 & 0.187786 \tabularnewline
24 & 0.004525 & 0.0381 & 0.484846 \tabularnewline
25 & -0.069809 & -0.5882 & 0.279124 \tabularnewline
26 & -0.152084 & -1.2815 & 0.102097 \tabularnewline
27 & 0.081663 & 0.6881 & 0.246815 \tabularnewline
28 & -0.036779 & -0.3099 & 0.378771 \tabularnewline
29 & 0.039758 & 0.335 & 0.369304 \tabularnewline
30 & 0.022372 & 0.1885 & 0.425508 \tabularnewline
31 & -0.12115 & -1.0208 & 0.155402 \tabularnewline
32 & 0.006328 & 0.0533 & 0.478814 \tabularnewline
33 & -0.153296 & -1.2917 & 0.100326 \tabularnewline
34 & -0.015254 & -0.1285 & 0.449046 \tabularnewline
35 & 0.121328 & 1.0223 & 0.155049 \tabularnewline
36 & 0.092301 & 0.7777 & 0.219653 \tabularnewline
\hline
\end{tabular}
%Source: https://freestatistics.org/blog/index.php?pk=33446&T=1

[TABLE]
[ROW][C]Autocorrelation Function[/C][/ROW]
[ROW][C]Time lag k[/C][C]ACF(k)[/C][C]T-STAT[/C][C]P-value[/C][/ROW]
[ROW][C]1[/C][C]0.085673[/C][C]0.7219[/C][C]0.236364[/C][/ROW]
[ROW][C]2[/C][C]0.135737[/C][C]1.1437[/C][C]0.128286[/C][/ROW]
[ROW][C]3[/C][C]0.039502[/C][C]0.3328[/C][C]0.370115[/C][/ROW]
[ROW][C]4[/C][C]0.02304[/C][C]0.1941[/C][C]0.423311[/C][/ROW]
[ROW][C]5[/C][C]0.203189[/C][C]1.7121[/C][C]0.045622[/C][/ROW]
[ROW][C]6[/C][C]0.049543[/C][C]0.4175[/C][C]0.338801[/C][/ROW]
[ROW][C]7[/C][C]0.02612[/C][C]0.2201[/C][C]0.413217[/C][/ROW]
[ROW][C]8[/C][C]-0.033576[/C][C]-0.2829[/C][C]0.389033[/C][/ROW]
[ROW][C]9[/C][C]0.031316[/C][C]0.2639[/C][C]0.396323[/C][/ROW]
[ROW][C]10[/C][C]-0.065117[/C][C]-0.5487[/C][C]0.29247[/C][/ROW]
[ROW][C]11[/C][C]-0.008475[/C][C]-0.0714[/C][C]0.471634[/C][/ROW]
[ROW][C]12[/C][C]-0.05198[/C][C]-0.438[/C][C]0.33136[/C][/ROW]
[ROW][C]13[/C][C]0.049589[/C][C]0.4178[/C][C]0.338661[/C][/ROW]
[ROW][C]14[/C][C]0.112356[/C][C]0.9467[/C][C]0.173494[/C][/ROW]
[ROW][C]15[/C][C]-0.074338[/C][C]-0.6264[/C][C]0.266535[/C][/ROW]
[ROW][C]16[/C][C]0.102859[/C][C]0.8667[/C][C]0.194513[/C][/ROW]
[ROW][C]17[/C][C]-0.083315[/C][C]-0.702[/C][C]0.24248[/C][/ROW]
[ROW][C]18[/C][C]0.15433[/C][C]1.3004[/C][C]0.098833[/C][/ROW]
[ROW][C]19[/C][C]0.117443[/C][C]0.9896[/C][C]0.162866[/C][/ROW]
[ROW][C]20[/C][C]-0.012862[/C][C]-0.1084[/C][C]0.457[/C][/ROW]
[ROW][C]21[/C][C]0.069273[/C][C]0.5837[/C][C]0.280635[/C][/ROW]
[ROW][C]22[/C][C]-0.130317[/C][C]-1.0981[/C][C]0.137943[/C][/ROW]
[ROW][C]23[/C][C]0.105824[/C][C]0.8917[/C][C]0.187786[/C][/ROW]
[ROW][C]24[/C][C]0.004525[/C][C]0.0381[/C][C]0.484846[/C][/ROW]
[ROW][C]25[/C][C]-0.069809[/C][C]-0.5882[/C][C]0.279124[/C][/ROW]
[ROW][C]26[/C][C]-0.152084[/C][C]-1.2815[/C][C]0.102097[/C][/ROW]
[ROW][C]27[/C][C]0.081663[/C][C]0.6881[/C][C]0.246815[/C][/ROW]
[ROW][C]28[/C][C]-0.036779[/C][C]-0.3099[/C][C]0.378771[/C][/ROW]
[ROW][C]29[/C][C]0.039758[/C][C]0.335[/C][C]0.369304[/C][/ROW]
[ROW][C]30[/C][C]0.022372[/C][C]0.1885[/C][C]0.425508[/C][/ROW]
[ROW][C]31[/C][C]-0.12115[/C][C]-1.0208[/C][C]0.155402[/C][/ROW]
[ROW][C]32[/C][C]0.006328[/C][C]0.0533[/C][C]0.478814[/C][/ROW]
[ROW][C]33[/C][C]-0.153296[/C][C]-1.2917[/C][C]0.100326[/C][/ROW]
[ROW][C]34[/C][C]-0.015254[/C][C]-0.1285[/C][C]0.449046[/C][/ROW]
[ROW][C]35[/C][C]0.121328[/C][C]1.0223[/C][C]0.155049[/C][/ROW]
[ROW][C]36[/C][C]0.092301[/C][C]0.7777[/C][C]0.219653[/C][/ROW]
[/TABLE]
Source: https://freestatistics.org/blog/index.php?pk=33446&T=1

Globally Unique Identifier (entire table): ba.freestatistics.org/blog/index.php?pk=33446&T=1

As an alternative you can also use a QR Code:  

The GUIDs for individual cells are displayed in the table below:

Autocorrelation Function
Time lag kACF(k)T-STATP-value
10.0856730.72190.236364
20.1357371.14370.128286
30.0395020.33280.370115
40.023040.19410.423311
50.2031891.71210.045622
60.0495430.41750.338801
70.026120.22010.413217
8-0.033576-0.28290.389033
90.0313160.26390.396323
10-0.065117-0.54870.29247
11-0.008475-0.07140.471634
12-0.05198-0.4380.33136
130.0495890.41780.338661
140.1123560.94670.173494
15-0.074338-0.62640.266535
160.1028590.86670.194513
17-0.083315-0.7020.24248
180.154331.30040.098833
190.1174430.98960.162866
20-0.012862-0.10840.457
210.0692730.58370.280635
22-0.130317-1.09810.137943
230.1058240.89170.187786
240.0045250.03810.484846
25-0.069809-0.58820.279124
26-0.152084-1.28150.102097
270.0816630.68810.246815
28-0.036779-0.30990.378771
290.0397580.3350.369304
300.0223720.18850.425508
31-0.12115-1.02080.155402
320.0063280.05330.478814
33-0.153296-1.29170.100326
34-0.015254-0.12850.449046
350.1213281.02230.155049
360.0923010.77770.219653


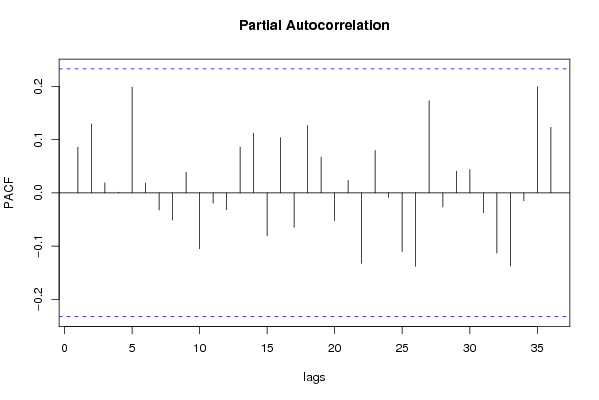
Partial Autocorrelation Function
Time lag kPACF(k)T-STATP-value
10.0856730.72190.236364
20.1293471.08990.139723
30.0187440.15790.437475
40.0012460.01050.495825
50.1986661.6740.049267
60.0182430.15370.439132
7-0.032145-0.27090.393644
8-0.051308-0.43230.333407
90.038430.32380.373514
10-0.10506-0.88530.189505
11-0.019579-0.1650.434716
12-0.031829-0.26820.394663
130.0860080.72470.235504
140.1119660.94340.174327
15-0.080564-0.67880.249722
160.1035650.87270.192898
17-0.064775-0.54580.293457
180.1264481.06550.145137
190.0671320.56570.286704
20-0.052085-0.43890.331042
210.0232370.19580.422663
22-0.132402-1.11560.134169
230.0795220.67010.252495
24-0.008679-0.07310.470955
25-0.110394-0.93020.177711
26-0.137743-1.16060.124838
270.172961.45740.074709
28-0.026666-0.22470.411433
290.0405890.3420.366678
300.0435930.36730.357235
31-0.037592-0.31680.376178
32-0.112871-0.95110.172397
33-0.137624-1.15960.12504
34-0.015117-0.12740.449501
350.199251.67890.048783
360.123091.03720.151588

\begin{tabular}{lllllllll}
\hline
Partial Autocorrelation Function \tabularnewline
Time lag k & PACF(k) & T-STAT & P-value \tabularnewline
1 & 0.085673 & 0.7219 & 0.236364 \tabularnewline
2 & 0.129347 & 1.0899 & 0.139723 \tabularnewline
3 & 0.018744 & 0.1579 & 0.437475 \tabularnewline
4 & 0.001246 & 0.0105 & 0.495825 \tabularnewline
5 & 0.198666 & 1.674 & 0.049267 \tabularnewline
6 & 0.018243 & 0.1537 & 0.439132 \tabularnewline
7 & -0.032145 & -0.2709 & 0.393644 \tabularnewline
8 & -0.051308 & -0.4323 & 0.333407 \tabularnewline
9 & 0.03843 & 0.3238 & 0.373514 \tabularnewline
10 & -0.10506 & -0.8853 & 0.189505 \tabularnewline
11 & -0.019579 & -0.165 & 0.434716 \tabularnewline
12 & -0.031829 & -0.2682 & 0.394663 \tabularnewline
13 & 0.086008 & 0.7247 & 0.235504 \tabularnewline
14 & 0.111966 & 0.9434 & 0.174327 \tabularnewline
15 & -0.080564 & -0.6788 & 0.249722 \tabularnewline
16 & 0.103565 & 0.8727 & 0.192898 \tabularnewline
17 & -0.064775 & -0.5458 & 0.293457 \tabularnewline
18 & 0.126448 & 1.0655 & 0.145137 \tabularnewline
19 & 0.067132 & 0.5657 & 0.286704 \tabularnewline
20 & -0.052085 & -0.4389 & 0.331042 \tabularnewline
21 & 0.023237 & 0.1958 & 0.422663 \tabularnewline
22 & -0.132402 & -1.1156 & 0.134169 \tabularnewline
23 & 0.079522 & 0.6701 & 0.252495 \tabularnewline
24 & -0.008679 & -0.0731 & 0.470955 \tabularnewline
25 & -0.110394 & -0.9302 & 0.177711 \tabularnewline
26 & -0.137743 & -1.1606 & 0.124838 \tabularnewline
27 & 0.17296 & 1.4574 & 0.074709 \tabularnewline
28 & -0.026666 & -0.2247 & 0.411433 \tabularnewline
29 & 0.040589 & 0.342 & 0.366678 \tabularnewline
30 & 0.043593 & 0.3673 & 0.357235 \tabularnewline
31 & -0.037592 & -0.3168 & 0.376178 \tabularnewline
32 & -0.112871 & -0.9511 & 0.172397 \tabularnewline
33 & -0.137624 & -1.1596 & 0.12504 \tabularnewline
34 & -0.015117 & -0.1274 & 0.449501 \tabularnewline
35 & 0.19925 & 1.6789 & 0.048783 \tabularnewline
36 & 0.12309 & 1.0372 & 0.151588 \tabularnewline
\hline
\end{tabular}
%Source: https://freestatistics.org/blog/index.php?pk=33446&T=2

[TABLE]
[ROW][C]Partial Autocorrelation Function[/C][/ROW]
[ROW][C]Time lag k[/C][C]PACF(k)[/C][C]T-STAT[/C][C]P-value[/C][/ROW]
[ROW][C]1[/C][C]0.085673[/C][C]0.7219[/C][C]0.236364[/C][/ROW]
[ROW][C]2[/C][C]0.129347[/C][C]1.0899[/C][C]0.139723[/C][/ROW]
[ROW][C]3[/C][C]0.018744[/C][C]0.1579[/C][C]0.437475[/C][/ROW]
[ROW][C]4[/C][C]0.001246[/C][C]0.0105[/C][C]0.495825[/C][/ROW]
[ROW][C]5[/C][C]0.198666[/C][C]1.674[/C][C]0.049267[/C][/ROW]
[ROW][C]6[/C][C]0.018243[/C][C]0.1537[/C][C]0.439132[/C][/ROW]
[ROW][C]7[/C][C]-0.032145[/C][C]-0.2709[/C][C]0.393644[/C][/ROW]
[ROW][C]8[/C][C]-0.051308[/C][C]-0.4323[/C][C]0.333407[/C][/ROW]
[ROW][C]9[/C][C]0.03843[/C][C]0.3238[/C][C]0.373514[/C][/ROW]
[ROW][C]10[/C][C]-0.10506[/C][C]-0.8853[/C][C]0.189505[/C][/ROW]
[ROW][C]11[/C][C]-0.019579[/C][C]-0.165[/C][C]0.434716[/C][/ROW]
[ROW][C]12[/C][C]-0.031829[/C][C]-0.2682[/C][C]0.394663[/C][/ROW]
[ROW][C]13[/C][C]0.086008[/C][C]0.7247[/C][C]0.235504[/C][/ROW]
[ROW][C]14[/C][C]0.111966[/C][C]0.9434[/C][C]0.174327[/C][/ROW]
[ROW][C]15[/C][C]-0.080564[/C][C]-0.6788[/C][C]0.249722[/C][/ROW]
[ROW][C]16[/C][C]0.103565[/C][C]0.8727[/C][C]0.192898[/C][/ROW]
[ROW][C]17[/C][C]-0.064775[/C][C]-0.5458[/C][C]0.293457[/C][/ROW]
[ROW][C]18[/C][C]0.126448[/C][C]1.0655[/C][C]0.145137[/C][/ROW]
[ROW][C]19[/C][C]0.067132[/C][C]0.5657[/C][C]0.286704[/C][/ROW]
[ROW][C]20[/C][C]-0.052085[/C][C]-0.4389[/C][C]0.331042[/C][/ROW]
[ROW][C]21[/C][C]0.023237[/C][C]0.1958[/C][C]0.422663[/C][/ROW]
[ROW][C]22[/C][C]-0.132402[/C][C]-1.1156[/C][C]0.134169[/C][/ROW]
[ROW][C]23[/C][C]0.079522[/C][C]0.6701[/C][C]0.252495[/C][/ROW]
[ROW][C]24[/C][C]-0.008679[/C][C]-0.0731[/C][C]0.470955[/C][/ROW]
[ROW][C]25[/C][C]-0.110394[/C][C]-0.9302[/C][C]0.177711[/C][/ROW]
[ROW][C]26[/C][C]-0.137743[/C][C]-1.1606[/C][C]0.124838[/C][/ROW]
[ROW][C]27[/C][C]0.17296[/C][C]1.4574[/C][C]0.074709[/C][/ROW]
[ROW][C]28[/C][C]-0.026666[/C][C]-0.2247[/C][C]0.411433[/C][/ROW]
[ROW][C]29[/C][C]0.040589[/C][C]0.342[/C][C]0.366678[/C][/ROW]
[ROW][C]30[/C][C]0.043593[/C][C]0.3673[/C][C]0.357235[/C][/ROW]
[ROW][C]31[/C][C]-0.037592[/C][C]-0.3168[/C][C]0.376178[/C][/ROW]
[ROW][C]32[/C][C]-0.112871[/C][C]-0.9511[/C][C]0.172397[/C][/ROW]
[ROW][C]33[/C][C]-0.137624[/C][C]-1.1596[/C][C]0.12504[/C][/ROW]
[ROW][C]34[/C][C]-0.015117[/C][C]-0.1274[/C][C]0.449501[/C][/ROW]
[ROW][C]35[/C][C]0.19925[/C][C]1.6789[/C][C]0.048783[/C][/ROW]
[ROW][C]36[/C][C]0.12309[/C][C]1.0372[/C][C]0.151588[/C][/ROW]
[/TABLE]
Source: https://freestatistics.org/blog/index.php?pk=33446&T=2

Globally Unique Identifier (entire table): ba.freestatistics.org/blog/index.php?pk=33446&T=2

As an alternative you can also use a QR Code:  

The GUIDs for individual cells are displayed in the table below:

Partial Autocorrelation Function
Time lag kPACF(k)T-STATP-value
10.0856730.72190.236364
20.1293471.08990.139723
30.0187440.15790.437475
40.0012460.01050.495825
50.1986661.6740.049267
60.0182430.15370.439132
7-0.032145-0.27090.393644
8-0.051308-0.43230.333407
90.038430.32380.373514
10-0.10506-0.88530.189505
11-0.019579-0.1650.434716
12-0.031829-0.26820.394663
130.0860080.72470.235504
140.1119660.94340.174327
15-0.080564-0.67880.249722
160.1035650.87270.192898
17-0.064775-0.54580.293457
180.1264481.06550.145137
190.0671320.56570.286704
20-0.052085-0.43890.331042
210.0232370.19580.422663
22-0.132402-1.11560.134169
230.0795220.67010.252495
24-0.008679-0.07310.470955
25-0.110394-0.93020.177711
26-0.137743-1.16060.124838
270.172961.45740.074709
28-0.026666-0.22470.411433
290.0405890.3420.366678
300.0435930.36730.357235
31-0.037592-0.31680.376178
32-0.112871-0.95110.172397
33-0.137624-1.15960.12504
34-0.015117-0.12740.449501
350.199251.67890.048783
360.123091.03720.151588


Parameters (Session):
par1 = 36 ; par2 = 1 ; par3 = 0 ; par4 = 1 ; par5 = 12 ;
Parameters (R input):
par1 = 36 ; par2 = -1.4 ; par3 = 1 ; par4 = 1 ; par5 = 12 ;
R code (references can be found in the software module):
if (par1 == 'Default') {
par1 = 10*log10(length(x))
} else {
par1 <- as.numeric(par1)
}
par2 <- as.numeric(par2)
par3 <- as.numeric(par3)
par4 <- as.numeric(par4)
par5 <- as.numeric(par5)
if (par2 == 0) {
x <- log(x)
} else {
x <- (x ^ par2 - 1) / par2
}
if (par3 > 0) x <- diff(x,lag=1,difference=par3)
if (par4 > 0) x <- diff(x,lag=par5,difference=par4)
bitmap(file='pic1.png')
racf <- acf(x,par1,main='Autocorrelation',xlab='lags',ylab='ACF')
dev.off()
bitmap(file='pic2.png')
rpacf <- pacf(x,par1,main='Partial Autocorrelation',xlab='lags',ylab='PACF')
dev.off()
(myacf <- c(racf$acf))
(mypacf <- c(rpacf$acf))
lengthx <- length(x)
sqrtn <- sqrt(lengthx)
load(file='createtable')
a<-table.start()
a<-table.row.start(a)
a<-table.element(a,'Autocorrelation Function',4,TRUE)
a<-table.row.end(a)
a<-table.row.start(a)
a<-table.element(a,'Time lag k',header=TRUE)
a<-table.element(a,hyperlink('basics.htm','ACF(k)','click here for more information about the Autocorrelation Function'),header=TRUE)
a<-table.element(a,'T-STAT',header=TRUE)
a<-table.element(a,'P-value',header=TRUE)
a<-table.row.end(a)
for (i in 2:(par1+1)) {
a<-table.row.start(a)
a<-table.element(a,i-1,header=TRUE)
a<-table.element(a,round(myacf[i],6))
mytstat <- myacf[i]*sqrtn
a<-table.element(a,round(mytstat,4))
a<-table.element(a,round(1-pt(abs(mytstat),lengthx),6))
a<-table.row.end(a)
}
a<-table.end(a)
table.save(a,file='mytable.tab')
a<-table.start()
a<-table.row.start(a)
a<-table.element(a,'Partial Autocorrelation Function',4,TRUE)
a<-table.row.end(a)
a<-table.row.start(a)
a<-table.element(a,'Time lag k',header=TRUE)
a<-table.element(a,hyperlink('basics.htm','PACF(k)','click here for more information about the Partial Autocorrelation Function'),header=TRUE)
a<-table.element(a,'T-STAT',header=TRUE)
a<-table.element(a,'P-value',header=TRUE)
a<-table.row.end(a)
for (i in 1:par1) {
a<-table.row.start(a)
a<-table.element(a,i,header=TRUE)
a<-table.element(a,round(mypacf[i],6))
mytstat <- mypacf[i]*sqrtn
a<-table.element(a,round(mytstat,4))
a<-table.element(a,round(1-pt(abs(mytstat),lengthx),6))
a<-table.row.end(a)
}
a<-table.end(a)
table.save(a,file='mytable1.tab')