Free Statistics

of Irreproducible Research!

Author's title

Author*The author of this computation has been verified*
R Software Modulerwasp_arimabackwardselection.wasp
Title produced by softwareARIMA Backward Selection
Date of computationSun, 14 Dec 2008 08:55:32 -0700
Cite this page as followsStatistical Computations at FreeStatistics.org, Office for Research Development and Education, URL https://freestatistics.org/blog/index.php?v=date/2008/Dec/14/t12292701928r3cn2xf2fy7a1h.htm/, Retrieved Wed, 15 May 2024 04:10:47 +0000
Statistical Computations at FreeStatistics.org, Office for Research Development and Education, URL https://freestatistics.org/blog/index.php?pk=33445, Retrieved Wed, 15 May 2024 04:10:47 +0000
QR Codes:

Original text written by user:
IsPrivate?No (this computation is public)
User-defined keywords
Estimated Impact202
Family? (F = Feedback message, R = changed R code, M = changed R Module, P = changed Parameters, D = changed Data)
F     [Variance Reduction Matrix] [workshop] [2008-12-14 15:44:19] [3a9fc6d5b5e0e816787b7dbace57e7cd]
F RMP   [Spectral Analysis] [workshop] [2008-12-14 15:45:47] [3a9fc6d5b5e0e816787b7dbace57e7cd]
F   P     [Spectral Analysis] [workshop] [2008-12-14 15:47:26] [3a9fc6d5b5e0e816787b7dbace57e7cd]
F RMP       [Standard Deviation-Mean Plot] [workshop] [2008-12-14 15:48:50] [3a9fc6d5b5e0e816787b7dbace57e7cd]
F RMP         [(Partial) Autocorrelation Function] [workshop] [2008-12-14 15:50:28] [3a9fc6d5b5e0e816787b7dbace57e7cd]
F RMP             [ARIMA Backward Selection] [workshop] [2008-12-14 15:55:32] [821c4b3d195be8e737cf8c9dc649d3cf] [Current]
F RMP               [ARIMA Forecasting] [workshop] [2008-12-14 15:58:35] [3a9fc6d5b5e0e816787b7dbace57e7cd]
Feedback Forum
2008-12-24 07:30:48 [Gert-Jan Geudens] [reply
Correcte conclusie. Voor meer informatie in verband met deze ARIMA Backward selection verwijzen we graag naar de vorige workshops waar dit reeds uitvoerig is besproken.

Post a new message
Dataseries X:
2074
2049
2406
2558
2251
2059
2397
1747
1707
2319
1631
1627
1791
2034
1997
2169
2028
2253
2218
1855
2187
1852
1570
1851
1954
1828
2251
2277
2085
2282
2266
1878
2267
2069
1746
2299
2360
2214
2825
2355
2333
3016
2155
2172
2150
2533
2058
2160
2259
2498
2695
2799
2945
2930
2318
2540
2570
2669
2450
2842


Summary of computational transaction
Raw Inputview raw input (R code)
Raw Outputview raw output of R engine
Computing time9 seconds
R Server'George Udny Yule' @ 72.249.76.132

\begin{tabular}{lllllllll}
\hline
Summary of computational transaction \tabularnewline
Raw Input & view raw input (R code)  \tabularnewline
Raw Output & view raw output of R engine  \tabularnewline
Computing time & 9 seconds \tabularnewline
R Server & 'George Udny Yule' @ 72.249.76.132 \tabularnewline
\hline
\end{tabular}
%Source: https://freestatistics.org/blog/index.php?pk=33445&T=0

[TABLE]
[ROW][C]Summary of computational transaction[/C][/ROW]
[ROW][C]Raw Input[/C][C]view raw input (R code) [/C][/ROW]
[ROW][C]Raw Output[/C][C]view raw output of R engine [/C][/ROW]
[ROW][C]Computing time[/C][C]9 seconds[/C][/ROW]
[ROW][C]R Server[/C][C]'George Udny Yule' @ 72.249.76.132[/C][/ROW]
[/TABLE]
Source: https://freestatistics.org/blog/index.php?pk=33445&T=0

Globally Unique Identifier (entire table): ba.freestatistics.org/blog/index.php?pk=33445&T=0

As an alternative you can also use a QR Code:  

The GUIDs for individual cells are displayed in the table below:

Summary of computational transaction
Raw Inputview raw input (R code)
Raw Outputview raw output of R engine
Computing time9 seconds
R Server'George Udny Yule' @ 72.249.76.132


ARIMA Parameter Estimation and Backward Selection
Iterationar1ar2ar3ma1sar1sar2sma1
Estimates ( 1 )-0.4813-0.40670.0249-0.4199-0.0696-0.157-0.4106
(p-val)(0 )(0 )(0.0474 )(0 )(0 )(0 )(0 )
Estimates ( 2 )-0.5255-0.44610-0.37050.1043-0.0931-0.61
(p-val)(0.0237 )(0.0208 )(NA )(0.1391 )(0.9255 )(0.8406 )(0.6545 )
Estimates ( 3 )-0.5199-0.43870-0.37640-0.1291-0.4894
(p-val)(0.0224 )(0.0132 )(NA )(0.1268 )(NA )(0.5672 )(0.0295 )
Estimates ( 4 )-0.5168-0.42740-0.380800-0.5057
(p-val)(0.0237 )(0.0153 )(NA )(0.1212 )(NA )(NA )(0.0197 )
Estimates ( 5 )-0.7689-0.55130000-0.5647
(p-val)(0 )(0 )(NA )(NA )(NA )(NA )(0.012 )
Estimates ( 6 )NANANANANANANA
(p-val)(NA )(NA )(NA )(NA )(NA )(NA )(NA )
Estimates ( 7 )NANANANANANANA
(p-val)(NA )(NA )(NA )(NA )(NA )(NA )(NA )
Estimates ( 8 )NANANANANANANA
(p-val)(NA )(NA )(NA )(NA )(NA )(NA )(NA )
Estimates ( 9 )NANANANANANANA
(p-val)(NA )(NA )(NA )(NA )(NA )(NA )(NA )
Estimates ( 10 )NANANANANANANA
(p-val)(NA )(NA )(NA )(NA )(NA )(NA )(NA )
Estimates ( 11 )NANANANANANANA
(p-val)(NA )(NA )(NA )(NA )(NA )(NA )(NA )
Estimates ( 12 )NANANANANANANA
(p-val)(NA )(NA )(NA )(NA )(NA )(NA )(NA )
Estimates ( 13 )NANANANANANANA
(p-val)(NA )(NA )(NA )(NA )(NA )(NA )(NA )

\begin{tabular}{lllllllll}
\hline
ARIMA Parameter Estimation and Backward Selection \tabularnewline
Iteration & ar1 & ar2 & ar3 & ma1 & sar1 & sar2 & sma1 \tabularnewline
Estimates ( 1 ) & -0.4813 & -0.4067 & 0.0249 & -0.4199 & -0.0696 & -0.157 & -0.4106 \tabularnewline
(p-val) & (0 ) & (0 ) & (0.0474 ) & (0 ) & (0 ) & (0 ) & (0 ) \tabularnewline
Estimates ( 2 ) & -0.5255 & -0.4461 & 0 & -0.3705 & 0.1043 & -0.0931 & -0.61 \tabularnewline
(p-val) & (0.0237 ) & (0.0208 ) & (NA ) & (0.1391 ) & (0.9255 ) & (0.8406 ) & (0.6545 ) \tabularnewline
Estimates ( 3 ) & -0.5199 & -0.4387 & 0 & -0.3764 & 0 & -0.1291 & -0.4894 \tabularnewline
(p-val) & (0.0224 ) & (0.0132 ) & (NA ) & (0.1268 ) & (NA ) & (0.5672 ) & (0.0295 ) \tabularnewline
Estimates ( 4 ) & -0.5168 & -0.4274 & 0 & -0.3808 & 0 & 0 & -0.5057 \tabularnewline
(p-val) & (0.0237 ) & (0.0153 ) & (NA ) & (0.1212 ) & (NA ) & (NA ) & (0.0197 ) \tabularnewline
Estimates ( 5 ) & -0.7689 & -0.5513 & 0 & 0 & 0 & 0 & -0.5647 \tabularnewline
(p-val) & (0 ) & (0 ) & (NA ) & (NA ) & (NA ) & (NA ) & (0.012 ) \tabularnewline
Estimates ( 6 ) & NA & NA & NA & NA & NA & NA & NA \tabularnewline
(p-val) & (NA ) & (NA ) & (NA ) & (NA ) & (NA ) & (NA ) & (NA ) \tabularnewline
Estimates ( 7 ) & NA & NA & NA & NA & NA & NA & NA \tabularnewline
(p-val) & (NA ) & (NA ) & (NA ) & (NA ) & (NA ) & (NA ) & (NA ) \tabularnewline
Estimates ( 8 ) & NA & NA & NA & NA & NA & NA & NA \tabularnewline
(p-val) & (NA ) & (NA ) & (NA ) & (NA ) & (NA ) & (NA ) & (NA ) \tabularnewline
Estimates ( 9 ) & NA & NA & NA & NA & NA & NA & NA \tabularnewline
(p-val) & (NA ) & (NA ) & (NA ) & (NA ) & (NA ) & (NA ) & (NA ) \tabularnewline
Estimates ( 10 ) & NA & NA & NA & NA & NA & NA & NA \tabularnewline
(p-val) & (NA ) & (NA ) & (NA ) & (NA ) & (NA ) & (NA ) & (NA ) \tabularnewline
Estimates ( 11 ) & NA & NA & NA & NA & NA & NA & NA \tabularnewline
(p-val) & (NA ) & (NA ) & (NA ) & (NA ) & (NA ) & (NA ) & (NA ) \tabularnewline
Estimates ( 12 ) & NA & NA & NA & NA & NA & NA & NA \tabularnewline
(p-val) & (NA ) & (NA ) & (NA ) & (NA ) & (NA ) & (NA ) & (NA ) \tabularnewline
Estimates ( 13 ) & NA & NA & NA & NA & NA & NA & NA \tabularnewline
(p-val) & (NA ) & (NA ) & (NA ) & (NA ) & (NA ) & (NA ) & (NA ) \tabularnewline
\hline
\end{tabular}
%Source: https://freestatistics.org/blog/index.php?pk=33445&T=1

[TABLE]
[ROW][C]ARIMA Parameter Estimation and Backward Selection[/C][/ROW]
[ROW][C]Iteration[/C][C]ar1[/C][C]ar2[/C][C]ar3[/C][C]ma1[/C][C]sar1[/C][C]sar2[/C][C]sma1[/C][/ROW]
[ROW][C]Estimates ( 1 )[/C][C]-0.4813[/C][C]-0.4067[/C][C]0.0249[/C][C]-0.4199[/C][C]-0.0696[/C][C]-0.157[/C][C]-0.4106[/C][/ROW]
[ROW][C](p-val)[/C][C](0 )[/C][C](0 )[/C][C](0.0474 )[/C][C](0 )[/C][C](0 )[/C][C](0 )[/C][C](0 )[/C][/ROW]
[ROW][C]Estimates ( 2 )[/C][C]-0.5255[/C][C]-0.4461[/C][C]0[/C][C]-0.3705[/C][C]0.1043[/C][C]-0.0931[/C][C]-0.61[/C][/ROW]
[ROW][C](p-val)[/C][C](0.0237 )[/C][C](0.0208 )[/C][C](NA )[/C][C](0.1391 )[/C][C](0.9255 )[/C][C](0.8406 )[/C][C](0.6545 )[/C][/ROW]
[ROW][C]Estimates ( 3 )[/C][C]-0.5199[/C][C]-0.4387[/C][C]0[/C][C]-0.3764[/C][C]0[/C][C]-0.1291[/C][C]-0.4894[/C][/ROW]
[ROW][C](p-val)[/C][C](0.0224 )[/C][C](0.0132 )[/C][C](NA )[/C][C](0.1268 )[/C][C](NA )[/C][C](0.5672 )[/C][C](0.0295 )[/C][/ROW]
[ROW][C]Estimates ( 4 )[/C][C]-0.5168[/C][C]-0.4274[/C][C]0[/C][C]-0.3808[/C][C]0[/C][C]0[/C][C]-0.5057[/C][/ROW]
[ROW][C](p-val)[/C][C](0.0237 )[/C][C](0.0153 )[/C][C](NA )[/C][C](0.1212 )[/C][C](NA )[/C][C](NA )[/C][C](0.0197 )[/C][/ROW]
[ROW][C]Estimates ( 5 )[/C][C]-0.7689[/C][C]-0.5513[/C][C]0[/C][C]0[/C][C]0[/C][C]0[/C][C]-0.5647[/C][/ROW]
[ROW][C](p-val)[/C][C](0 )[/C][C](0 )[/C][C](NA )[/C][C](NA )[/C][C](NA )[/C][C](NA )[/C][C](0.012 )[/C][/ROW]
[ROW][C]Estimates ( 6 )[/C][C]NA[/C][C]NA[/C][C]NA[/C][C]NA[/C][C]NA[/C][C]NA[/C][C]NA[/C][/ROW]
[ROW][C](p-val)[/C][C](NA )[/C][C](NA )[/C][C](NA )[/C][C](NA )[/C][C](NA )[/C][C](NA )[/C][C](NA )[/C][/ROW]
[ROW][C]Estimates ( 7 )[/C][C]NA[/C][C]NA[/C][C]NA[/C][C]NA[/C][C]NA[/C][C]NA[/C][C]NA[/C][/ROW]
[ROW][C](p-val)[/C][C](NA )[/C][C](NA )[/C][C](NA )[/C][C](NA )[/C][C](NA )[/C][C](NA )[/C][C](NA )[/C][/ROW]
[ROW][C]Estimates ( 8 )[/C][C]NA[/C][C]NA[/C][C]NA[/C][C]NA[/C][C]NA[/C][C]NA[/C][C]NA[/C][/ROW]
[ROW][C](p-val)[/C][C](NA )[/C][C](NA )[/C][C](NA )[/C][C](NA )[/C][C](NA )[/C][C](NA )[/C][C](NA )[/C][/ROW]
[ROW][C]Estimates ( 9 )[/C][C]NA[/C][C]NA[/C][C]NA[/C][C]NA[/C][C]NA[/C][C]NA[/C][C]NA[/C][/ROW]
[ROW][C](p-val)[/C][C](NA )[/C][C](NA )[/C][C](NA )[/C][C](NA )[/C][C](NA )[/C][C](NA )[/C][C](NA )[/C][/ROW]
[ROW][C]Estimates ( 10 )[/C][C]NA[/C][C]NA[/C][C]NA[/C][C]NA[/C][C]NA[/C][C]NA[/C][C]NA[/C][/ROW]
[ROW][C](p-val)[/C][C](NA )[/C][C](NA )[/C][C](NA )[/C][C](NA )[/C][C](NA )[/C][C](NA )[/C][C](NA )[/C][/ROW]
[ROW][C]Estimates ( 11 )[/C][C]NA[/C][C]NA[/C][C]NA[/C][C]NA[/C][C]NA[/C][C]NA[/C][C]NA[/C][/ROW]
[ROW][C](p-val)[/C][C](NA )[/C][C](NA )[/C][C](NA )[/C][C](NA )[/C][C](NA )[/C][C](NA )[/C][C](NA )[/C][/ROW]
[ROW][C]Estimates ( 12 )[/C][C]NA[/C][C]NA[/C][C]NA[/C][C]NA[/C][C]NA[/C][C]NA[/C][C]NA[/C][/ROW]
[ROW][C](p-val)[/C][C](NA )[/C][C](NA )[/C][C](NA )[/C][C](NA )[/C][C](NA )[/C][C](NA )[/C][C](NA )[/C][/ROW]
[ROW][C]Estimates ( 13 )[/C][C]NA[/C][C]NA[/C][C]NA[/C][C]NA[/C][C]NA[/C][C]NA[/C][C]NA[/C][/ROW]
[ROW][C](p-val)[/C][C](NA )[/C][C](NA )[/C][C](NA )[/C][C](NA )[/C][C](NA )[/C][C](NA )[/C][C](NA )[/C][/ROW]
[/TABLE]
Source: https://freestatistics.org/blog/index.php?pk=33445&T=1

Globally Unique Identifier (entire table): ba.freestatistics.org/blog/index.php?pk=33445&T=1

As an alternative you can also use a QR Code:  

The GUIDs for individual cells are displayed in the table below:

ARIMA Parameter Estimation and Backward Selection
Iterationar1ar2ar3ma1sar1sar2sma1
Estimates ( 1 )-0.4813-0.40670.0249-0.4199-0.0696-0.157-0.4106
(p-val)(0 )(0 )(0.0474 )(0 )(0 )(0 )(0 )
Estimates ( 2 )-0.5255-0.44610-0.37050.1043-0.0931-0.61
(p-val)(0.0237 )(0.0208 )(NA )(0.1391 )(0.9255 )(0.8406 )(0.6545 )
Estimates ( 3 )-0.5199-0.43870-0.37640-0.1291-0.4894
(p-val)(0.0224 )(0.0132 )(NA )(0.1268 )(NA )(0.5672 )(0.0295 )
Estimates ( 4 )-0.5168-0.42740-0.380800-0.5057
(p-val)(0.0237 )(0.0153 )(NA )(0.1212 )(NA )(NA )(0.0197 )
Estimates ( 5 )-0.7689-0.55130000-0.5647
(p-val)(0 )(0 )(NA )(NA )(NA )(NA )(0.012 )
Estimates ( 6 )NANANANANANANA
(p-val)(NA )(NA )(NA )(NA )(NA )(NA )(NA )
Estimates ( 7 )NANANANANANANA
(p-val)(NA )(NA )(NA )(NA )(NA )(NA )(NA )
Estimates ( 8 )NANANANANANANA
(p-val)(NA )(NA )(NA )(NA )(NA )(NA )(NA )
Estimates ( 9 )NANANANANANANA
(p-val)(NA )(NA )(NA )(NA )(NA )(NA )(NA )
Estimates ( 10 )NANANANANANANA
(p-val)(NA )(NA )(NA )(NA )(NA )(NA )(NA )
Estimates ( 11 )NANANANANANANA
(p-val)(NA )(NA )(NA )(NA )(NA )(NA )(NA )
Estimates ( 12 )NANANANANANANA
(p-val)(NA )(NA )(NA )(NA )(NA )(NA )(NA )
Estimates ( 13 )NANANANANANANA
(p-val)(NA )(NA )(NA )(NA )(NA )(NA )(NA )


Estimated ARIMA Residuals
Value
-8.1516470487211
169.284779896602
-190.115402559689
-116.694395246429
-35.8460641175606
439.718633167906
92.6431760656578
282.032623635602
419.71326196138
-402.642400239574
-64.4488435879582
29.0217423825902
235.080223676084
-97.8530805996078
111.58510875354
-49.5828013143969
52.6796252803992
106.261068920595
-9.48163867523045
77.5386916007276
219.363319946927
-10.9718424573853
82.6430414574999
359.868485487763
320.02549114262
101.380825108629
269.513541997661
-347.190740983298
-103.004248637935
362.661667979121
-404.302590085213
60.6078044596502
-443.036162094684
323.347032510583
137.816127048039
-66.0202871032303
-193.838983763654
127.882259852774
-34.0722866172165
285.204245121725
410.424518536764
-7.31312051880822
-314.833360665606
23.1388944920931
38.8362462498261
92.2687146628076
174.110743357888
307.397825763947

\begin{tabular}{lllllllll}
\hline
Estimated ARIMA Residuals \tabularnewline
Value \tabularnewline
-8.1516470487211 \tabularnewline
169.284779896602 \tabularnewline
-190.115402559689 \tabularnewline
-116.694395246429 \tabularnewline
-35.8460641175606 \tabularnewline
439.718633167906 \tabularnewline
92.6431760656578 \tabularnewline
282.032623635602 \tabularnewline
419.71326196138 \tabularnewline
-402.642400239574 \tabularnewline
-64.4488435879582 \tabularnewline
29.0217423825902 \tabularnewline
235.080223676084 \tabularnewline
-97.8530805996078 \tabularnewline
111.58510875354 \tabularnewline
-49.5828013143969 \tabularnewline
52.6796252803992 \tabularnewline
106.261068920595 \tabularnewline
-9.48163867523045 \tabularnewline
77.5386916007276 \tabularnewline
219.363319946927 \tabularnewline
-10.9718424573853 \tabularnewline
82.6430414574999 \tabularnewline
359.868485487763 \tabularnewline
320.02549114262 \tabularnewline
101.380825108629 \tabularnewline
269.513541997661 \tabularnewline
-347.190740983298 \tabularnewline
-103.004248637935 \tabularnewline
362.661667979121 \tabularnewline
-404.302590085213 \tabularnewline
60.6078044596502 \tabularnewline
-443.036162094684 \tabularnewline
323.347032510583 \tabularnewline
137.816127048039 \tabularnewline
-66.0202871032303 \tabularnewline
-193.838983763654 \tabularnewline
127.882259852774 \tabularnewline
-34.0722866172165 \tabularnewline
285.204245121725 \tabularnewline
410.424518536764 \tabularnewline
-7.31312051880822 \tabularnewline
-314.833360665606 \tabularnewline
23.1388944920931 \tabularnewline
38.8362462498261 \tabularnewline
92.2687146628076 \tabularnewline
174.110743357888 \tabularnewline
307.397825763947 \tabularnewline
\hline
\end{tabular}
%Source: https://freestatistics.org/blog/index.php?pk=33445&T=2

[TABLE]
[ROW][C]Estimated ARIMA Residuals[/C][/ROW]
[ROW][C]Value[/C][/ROW]
[ROW][C]-8.1516470487211[/C][/ROW]
[ROW][C]169.284779896602[/C][/ROW]
[ROW][C]-190.115402559689[/C][/ROW]
[ROW][C]-116.694395246429[/C][/ROW]
[ROW][C]-35.8460641175606[/C][/ROW]
[ROW][C]439.718633167906[/C][/ROW]
[ROW][C]92.6431760656578[/C][/ROW]
[ROW][C]282.032623635602[/C][/ROW]
[ROW][C]419.71326196138[/C][/ROW]
[ROW][C]-402.642400239574[/C][/ROW]
[ROW][C]-64.4488435879582[/C][/ROW]
[ROW][C]29.0217423825902[/C][/ROW]
[ROW][C]235.080223676084[/C][/ROW]
[ROW][C]-97.8530805996078[/C][/ROW]
[ROW][C]111.58510875354[/C][/ROW]
[ROW][C]-49.5828013143969[/C][/ROW]
[ROW][C]52.6796252803992[/C][/ROW]
[ROW][C]106.261068920595[/C][/ROW]
[ROW][C]-9.48163867523045[/C][/ROW]
[ROW][C]77.5386916007276[/C][/ROW]
[ROW][C]219.363319946927[/C][/ROW]
[ROW][C]-10.9718424573853[/C][/ROW]
[ROW][C]82.6430414574999[/C][/ROW]
[ROW][C]359.868485487763[/C][/ROW]
[ROW][C]320.02549114262[/C][/ROW]
[ROW][C]101.380825108629[/C][/ROW]
[ROW][C]269.513541997661[/C][/ROW]
[ROW][C]-347.190740983298[/C][/ROW]
[ROW][C]-103.004248637935[/C][/ROW]
[ROW][C]362.661667979121[/C][/ROW]
[ROW][C]-404.302590085213[/C][/ROW]
[ROW][C]60.6078044596502[/C][/ROW]
[ROW][C]-443.036162094684[/C][/ROW]
[ROW][C]323.347032510583[/C][/ROW]
[ROW][C]137.816127048039[/C][/ROW]
[ROW][C]-66.0202871032303[/C][/ROW]
[ROW][C]-193.838983763654[/C][/ROW]
[ROW][C]127.882259852774[/C][/ROW]
[ROW][C]-34.0722866172165[/C][/ROW]
[ROW][C]285.204245121725[/C][/ROW]
[ROW][C]410.424518536764[/C][/ROW]
[ROW][C]-7.31312051880822[/C][/ROW]
[ROW][C]-314.833360665606[/C][/ROW]
[ROW][C]23.1388944920931[/C][/ROW]
[ROW][C]38.8362462498261[/C][/ROW]
[ROW][C]92.2687146628076[/C][/ROW]
[ROW][C]174.110743357888[/C][/ROW]
[ROW][C]307.397825763947[/C][/ROW]
[/TABLE]
Source: https://freestatistics.org/blog/index.php?pk=33445&T=2

Globally Unique Identifier (entire table): ba.freestatistics.org/blog/index.php?pk=33445&T=2

As an alternative you can also use a QR Code:  

The GUIDs for individual cells are displayed in the table below:

Estimated ARIMA Residuals
Value
-8.1516470487211
169.284779896602
-190.115402559689
-116.694395246429
-35.8460641175606
439.718633167906
92.6431760656578
282.032623635602
419.71326196138
-402.642400239574
-64.4488435879582
29.0217423825902
235.080223676084
-97.8530805996078
111.58510875354
-49.5828013143969
52.6796252803992
106.261068920595
-9.48163867523045
77.5386916007276
219.363319946927
-10.9718424573853
82.6430414574999
359.868485487763
320.02549114262
101.380825108629
269.513541997661
-347.190740983298
-103.004248637935
362.661667979121
-404.302590085213
60.6078044596502
-443.036162094684
323.347032510583
137.816127048039
-66.0202871032303
-193.838983763654
127.882259852774
-34.0722866172165
285.204245121725
410.424518536764
-7.31312051880822
-314.833360665606
23.1388944920931
38.8362462498261
92.2687146628076
174.110743357888
307.397825763947


Parameters (Session):
par1 = FALSE ; par2 = 1 ; par3 = 1 ; par4 = 1 ; par5 = 12 ; par6 = 3 ; par7 = 1 ; par8 = 2 ; par9 = 1 ;
Parameters (R input):
par1 = FALSE ; par2 = 1 ; par3 = 1 ; par4 = 1 ; par5 = 12 ; par6 = 3 ; par7 = 1 ; par8 = 2 ; par9 = 1 ;
R code (references can be found in the software module):
library(lattice)
if (par1 == 'TRUE') par1 <- TRUE
if (par1 == 'FALSE') par1 <- FALSE
par2 <- as.numeric(par2) #Box-Cox lambda transformation parameter
par3 <- as.numeric(par3) #degree of non-seasonal differencing
par4 <- as.numeric(par4) #degree of seasonal differencing
par5 <- as.numeric(par5) #seasonal period
par6 <- as.numeric(par6) #degree (p) of the non-seasonal AR(p) polynomial
par7 <- as.numeric(par7) #degree (q) of the non-seasonal MA(q) polynomial
par8 <- as.numeric(par8) #degree (P) of the seasonal AR(P) polynomial
par9 <- as.numeric(par9) #degree (Q) of the seasonal MA(Q) polynomial
armaGR <- function(arima.out, names, n){
try1 <- arima.out$coef
try2 <- sqrt(diag(arima.out$var.coef))
try.data.frame <- data.frame(matrix(NA,ncol=4,nrow=length(names)))
dimnames(try.data.frame) <- list(names,c('coef','std','tstat','pv'))
try.data.frame[,1] <- try1
for(i in 1:length(try2)) try.data.frame[which(rownames(try.data.frame)==names(try2)[i]),2] <- try2[i]
try.data.frame[,3] <- try.data.frame[,1] / try.data.frame[,2]
try.data.frame[,4] <- round((1-pt(abs(try.data.frame[,3]),df=n-(length(try2)+1)))*2,5)
vector <- rep(NA,length(names))
vector[is.na(try.data.frame[,4])] <- 0
maxi <- which.max(try.data.frame[,4])
continue <- max(try.data.frame[,4],na.rm=TRUE) > .05
vector[maxi] <- 0
list(summary=try.data.frame,next.vector=vector,continue=continue)
}
arimaSelect <- function(series, order=c(13,0,0), seasonal=list(order=c(2,0,0),period=12), include.mean=F){
nrc <- order[1]+order[3]+seasonal$order[1]+seasonal$order[3]
coeff <- matrix(NA, nrow=nrc*2, ncol=nrc)
pval <- matrix(NA, nrow=nrc*2, ncol=nrc)
mylist <- rep(list(NULL), nrc)
names <- NULL
if(order[1] > 0) names <- paste('ar',1:order[1],sep='')
if(order[3] > 0) names <- c( names , paste('ma',1:order[3],sep='') )
if(seasonal$order[1] > 0) names <- c(names, paste('sar',1:seasonal$order[1],sep=''))
if(seasonal$order[3] > 0) names <- c(names, paste('sma',1:seasonal$order[3],sep=''))
arima.out <- arima(series, order=order, seasonal=seasonal, include.mean=include.mean, method='ML')
mylist[[1]] <- arima.out
last.arma <- armaGR(arima.out, names, length(series))
mystop <- FALSE
i <- 1
coeff[i,] <- last.arma[[1]][,1]
pval [i,] <- last.arma[[1]][,4]
i <- 2
aic <- arima.out$aic
while(!mystop){
mylist[[i]] <- arima.out
arima.out <- arima(series, order=order, seasonal=seasonal, include.mean=include.mean, method='ML', fixed=last.arma$next.vector)
aic <- c(aic, arima.out$aic)
last.arma <- armaGR(arima.out, names, length(series))
mystop <- !last.arma$continue
coeff[i,] <- last.arma[[1]][,1]
pval [i,] <- last.arma[[1]][,4]
i <- i+1
}
list(coeff, pval, mylist, aic=aic)
}
arimaSelectplot <- function(arimaSelect.out,noms,choix){
noms <- names(arimaSelect.out[[3]][[1]]$coef)
coeff <- arimaSelect.out[[1]]
k <- min(which(is.na(coeff[,1])))-1
coeff <- coeff[1:k,]
pval <- arimaSelect.out[[2]][1:k,]
aic <- arimaSelect.out$aic[1:k]
coeff[coeff==0] <- NA
n <- ncol(coeff)
if(missing(choix)) choix <- k
layout(matrix(c(1,1,1,2,
3,3,3,2,
3,3,3,4,
5,6,7,7),nr=4),
widths=c(10,35,45,15),
heights=c(30,30,15,15))
couleurs <- rainbow(75)[1:50]#(50)
ticks <- pretty(coeff)
par(mar=c(1,1,3,1))
plot(aic,k:1-.5,type='o',pch=21,bg='blue',cex=2,axes=F,lty=2,xpd=NA)
points(aic[choix],k-choix+.5,pch=21,cex=4,bg=2,xpd=NA)
title('aic',line=2)
par(mar=c(3,0,0,0))
plot(0,axes=F,xlab='',ylab='',xlim=range(ticks),ylim=c(.1,1))
rect(xleft = min(ticks) + (0:49)/50*(max(ticks)-min(ticks)),
xright = min(ticks) + (1:50)/50*(max(ticks)-min(ticks)),
ytop = rep(1,50),
ybottom= rep(0,50),col=couleurs,border=NA)
axis(1,ticks)
rect(xleft=min(ticks),xright=max(ticks),ytop=1,ybottom=0)
text(mean(coeff,na.rm=T),.5,'coefficients',cex=2,font=2)
par(mar=c(1,1,3,1))
image(1:n,1:k,t(coeff[k:1,]),axes=F,col=couleurs,zlim=range(ticks))
for(i in 1:n) for(j in 1:k) if(!is.na(coeff[j,i])) {
if(pval[j,i]<.01) symb = 'green'
else if( (pval[j,i]<.05) & (pval[j,i]>=.01)) symb = 'orange'
else if( (pval[j,i]<.1) & (pval[j,i]>=.05)) symb = 'red'
else symb = 'black'
polygon(c(i+.5 ,i+.2 ,i+.5 ,i+.5),
c(k-j+0.5,k-j+0.5,k-j+0.8,k-j+0.5),
col=symb)
if(j==choix) {
rect(xleft=i-.5,
xright=i+.5,
ybottom=k-j+1.5,
ytop=k-j+.5,
lwd=4)
text(i,
k-j+1,
round(coeff[j,i],2),
cex=1.2,
font=2)
}
else{
rect(xleft=i-.5,xright=i+.5,ybottom=k-j+1.5,ytop=k-j+.5)
text(i,k-j+1,round(coeff[j,i],2),cex=1.2,font=1)
}
}
axis(3,1:n,noms)
par(mar=c(0.5,0,0,0.5))
plot(0,axes=F,xlab='',ylab='',type='n',xlim=c(0,8),ylim=c(-.2,.8))
cols <- c('green','orange','red','black')
niv <- c('0','0.01','0.05','0.1')
for(i in 0:3){
polygon(c(1+2*i ,1+2*i ,1+2*i-.5 ,1+2*i),
c(.4 ,.7 , .4 , .4),
col=cols[i+1])
text(2*i,0.5,niv[i+1],cex=1.5)
}
text(8,.5,1,cex=1.5)
text(4,0,'p-value',cex=2)
box()
residus <- arimaSelect.out[[3]][[choix]]$res
par(mar=c(1,2,4,1))
acf(residus,main='')
title('acf',line=.5)
par(mar=c(1,2,4,1))
pacf(residus,main='')
title('pacf',line=.5)
par(mar=c(2,2,4,1))
qqnorm(residus,main='')
title('qq-norm',line=.5)
qqline(residus)
residus
}
if (par2 == 0) x <- log(x)
if (par2 != 0) x <- x^par2
(selection <- arimaSelect(x, order=c(par6,par3,par7), seasonal=list(order=c(par8,par4,par9), period=par5)))
bitmap(file='test1.png')
resid <- arimaSelectplot(selection)
dev.off()
resid
bitmap(file='test2.png')
acf(resid,length(resid)/2, main='Residual Autocorrelation Function')
dev.off()
bitmap(file='test3.png')
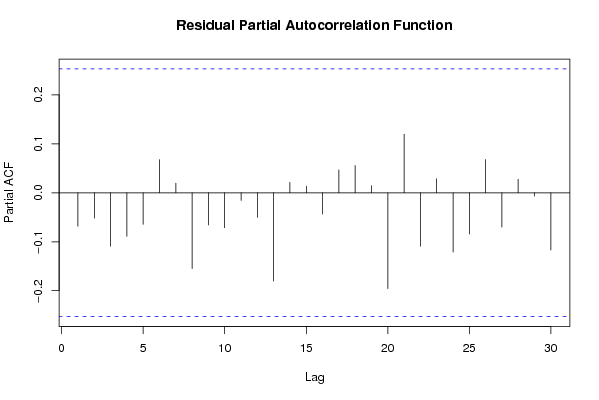
pacf(resid,length(resid)/2, main='Residual Partial Autocorrelation Function')
dev.off()
bitmap(file='test4.png')
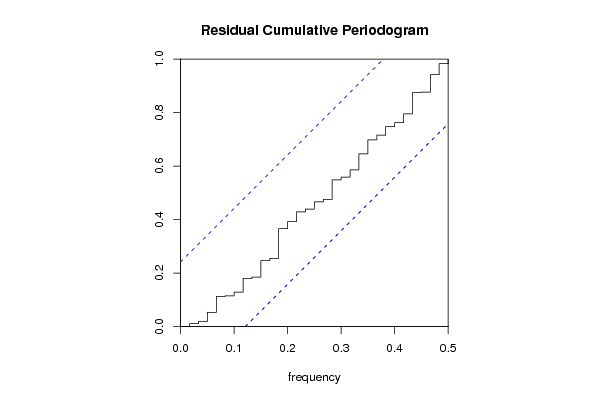
cpgram(resid, main='Residual Cumulative Periodogram')
dev.off()
bitmap(file='test5.png')
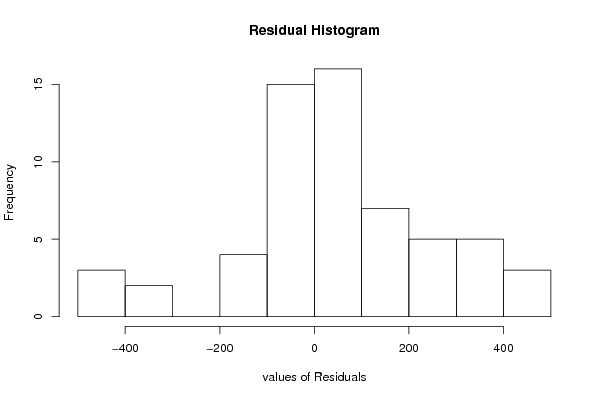
hist(resid, main='Residual Histogram', xlab='values of Residuals')
dev.off()
bitmap(file='test6.png')
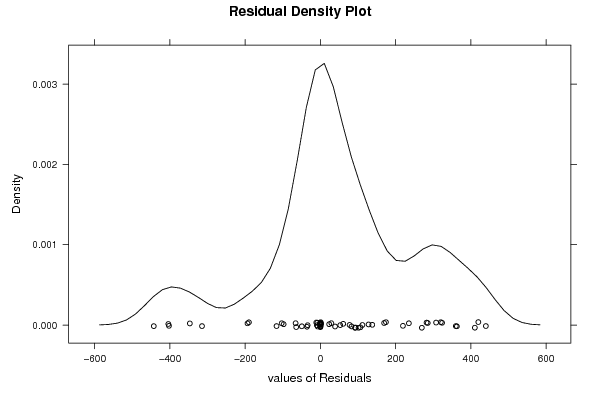
densityplot(~resid,col='black',main='Residual Density Plot', xlab='values of Residuals')
dev.off()
bitmap(file='test7.png')
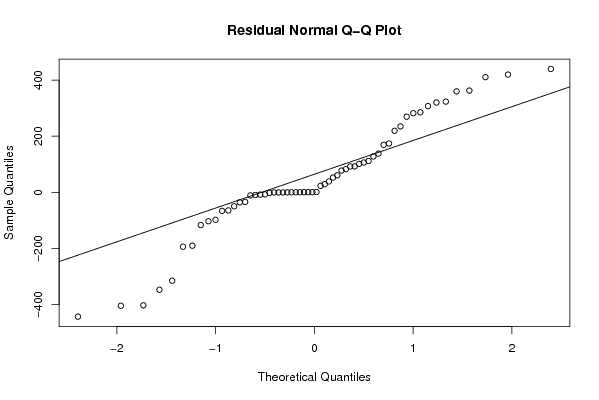
qqnorm(resid, main='Residual Normal Q-Q Plot')
qqline(resid)
dev.off()
ncols <- length(selection[[1]][1,])
nrows <- length(selection[[2]][,1])-1
load(file='createtable')
a<-table.start()
a<-table.row.start(a)
a<-table.element(a,'ARIMA Parameter Estimation and Backward Selection', ncols+1,TRUE)
a<-table.row.end(a)
a<-table.row.start(a)
a<-table.element(a,'Iteration', header=TRUE)
for (i in 1:ncols) {
a<-table.element(a,names(selection[[3]][[1]]$coef)[i],header=TRUE)
}
a<-table.row.end(a)
for (j in 1:nrows) {
a<-table.row.start(a)
mydum <- 'Estimates ('
mydum <- paste(mydum,j)
mydum <- paste(mydum,')')
a<-table.element(a,mydum, header=TRUE)
for (i in 1:ncols) {
a<-table.element(a,round(selection[[1]][j,i],4))
}
a<-table.row.end(a)
a<-table.row.start(a)
a<-table.element(a,'(p-val)', header=TRUE)
for (i in 1:ncols) {
mydum <- '('
mydum <- paste(mydum,round(selection[[2]][j,i],4),sep='')
mydum <- paste(mydum,')')
a<-table.element(a,mydum)
}
a<-table.row.end(a)
}
a<-table.end(a)
table.save(a,file='mytable.tab')
a<-table.start()
a<-table.row.start(a)
a<-table.element(a,'Estimated ARIMA Residuals', 1,TRUE)
a<-table.row.end(a)
a<-table.row.start(a)
a<-table.element(a,'Value', 1,TRUE)
a<-table.row.end(a)
for (i in (par4*par5+par3):length(resid)) {
a<-table.row.start(a)
a<-table.element(a,resid[i])
a<-table.row.end(a)
}
a<-table.end(a)
table.save(a,file='mytable1.tab')