Free Statistics

of Irreproducible Research!

Author's title

Author*The author of this computation has been verified*
R Software Modulerwasp_autocorrelation.wasp
Title produced by software(Partial) Autocorrelation Function
Date of computationSun, 14 Dec 2008 08:47:44 -0700
Cite this page as followsStatistical Computations at FreeStatistics.org, Office for Research Development and Education, URL https://freestatistics.org/blog/index.php?v=date/2008/Dec/14/t12292697777qoc8oip84trx3z.htm/, Retrieved Wed, 15 May 2024 21:42:06 +0000
Statistical Computations at FreeStatistics.org, Office for Research Development and Education, URL https://freestatistics.org/blog/index.php?pk=33441, Retrieved Wed, 15 May 2024 21:42:06 +0000
QR Codes:

Original text written by user:
IsPrivate?No (this computation is public)
User-defined keywords
Estimated Impact177
Family? (F = Feedback message, R = changed R code, M = changed R Module, P = changed Parameters, D = changed Data)
-     [(Partial) Autocorrelation Function] [(P)ACF Totale omzet] [2007-12-20 14:02:48] [74be16979710d4c4e7c6647856088456]
- R PD    [(Partial) Autocorrelation Function] [invoer] [2008-12-14 15:47:44] [5925747fb2a6bb4cfcd8015825ee5e92] [Current]
Feedback Forum

Post a new message
Dataseries X:
11554.5
13182.1
14800.1
12150.7
14478.2
13253.9
12036.8
12653.2
14035.4
14571.4
15400.9
14283.2
14485.3
14196.3
15559.1
13767.4
14634
14381.1
12509.9
12122.3
13122.3
13908.7
13456.5
12441.6
12953
13057.2
14350.1
13830.2
13755.5
13574.4
12802.6
11737.3
13850.2
15081.8
13653.3
14019.1
13962
13768.7
14747.1
13858.1
13188
13693.1
12970
11392.8
13985.2
14994.7
13584.7
14257.8
13553.4
14007.3
16535.8
14721.4
13664.6
16805.9
13829.4
13735.6
15870.5
15962.4
15744.1
16083.7
14863.9
15533.1
17473.1
15925.5
15573.7
17495
14155.8
14913.9
17250.4
15879.8
17647.8
17749.9
17111.8
16934.8
20280
16238.2
17896.1
18089.3
15660
16162.4
17850.1
18520.4
18524.7
16843.7


Summary of computational transaction
Raw Inputview raw input (R code)
Raw Outputview raw output of R engine
Computing time1 seconds
R Server'George Udny Yule' @ 72.249.76.132

\begin{tabular}{lllllllll}
\hline
Summary of computational transaction \tabularnewline
Raw Input & view raw input (R code)  \tabularnewline
Raw Output & view raw output of R engine  \tabularnewline
Computing time & 1 seconds \tabularnewline
R Server & 'George Udny Yule' @ 72.249.76.132 \tabularnewline
\hline
\end{tabular}
%Source: https://freestatistics.org/blog/index.php?pk=33441&T=0

[TABLE]
[ROW][C]Summary of computational transaction[/C][/ROW]
[ROW][C]Raw Input[/C][C]view raw input (R code) [/C][/ROW]
[ROW][C]Raw Output[/C][C]view raw output of R engine [/C][/ROW]
[ROW][C]Computing time[/C][C]1 seconds[/C][/ROW]
[ROW][C]R Server[/C][C]'George Udny Yule' @ 72.249.76.132[/C][/ROW]
[/TABLE]
Source: https://freestatistics.org/blog/index.php?pk=33441&T=0

Globally Unique Identifier (entire table): ba.freestatistics.org/blog/index.php?pk=33441&T=0

As an alternative you can also use a QR Code:  

The GUIDs for individual cells are displayed in the table below:

Summary of computational transaction
Raw Inputview raw input (R code)
Raw Outputview raw output of R engine
Computing time1 seconds
R Server'George Udny Yule' @ 72.249.76.132


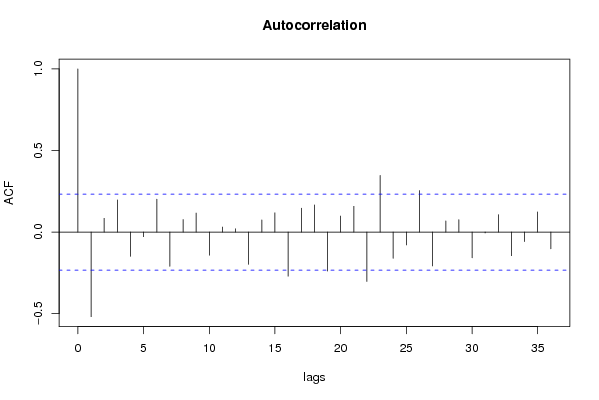
Autocorrelation Function
Time lag kACF(k)T-STATP-value
1-0.518569-4.36952.1e-05
20.0842840.71020.239957
30.1969341.65940.050724
4-0.148377-1.25030.107656
5-0.027964-0.23560.407201
60.2014011.6970.047035
7-0.209715-1.76710.040755
80.0768280.64740.259741
90.1162370.97940.165346
10-0.142162-1.19790.117474
110.0308690.26010.397767
120.0199480.16810.433498
13-0.197921-1.66770.049889
140.0741940.62520.266932
150.1183670.99740.160984
16-0.270743-2.28130.012766
170.1466071.23530.110389
180.1660031.39880.083118
19-0.239316-2.01650.023765
200.0981490.8270.205499
210.1577341.32910.094037
22-0.302843-2.55180.006435
230.3469162.92320.002323
24-0.160571-1.3530.090174
25-0.079038-0.6660.253788
260.2542512.14240.017797
27-0.207646-1.74970.042249
280.0684330.57660.283006
290.075640.63740.262973
30-0.157798-1.32960.093948
31-0.005385-0.04540.481967
320.1063990.89650.1865
33-0.144675-1.21910.113429
34-0.058517-0.49310.311741
350.1236931.04230.150414
36-0.102992-0.86780.194207

\begin{tabular}{lllllllll}
\hline
Autocorrelation Function \tabularnewline
Time lag k & ACF(k) & T-STAT & P-value \tabularnewline
1 & -0.518569 & -4.3695 & 2.1e-05 \tabularnewline
2 & 0.084284 & 0.7102 & 0.239957 \tabularnewline
3 & 0.196934 & 1.6594 & 0.050724 \tabularnewline
4 & -0.148377 & -1.2503 & 0.107656 \tabularnewline
5 & -0.027964 & -0.2356 & 0.407201 \tabularnewline
6 & 0.201401 & 1.697 & 0.047035 \tabularnewline
7 & -0.209715 & -1.7671 & 0.040755 \tabularnewline
8 & 0.076828 & 0.6474 & 0.259741 \tabularnewline
9 & 0.116237 & 0.9794 & 0.165346 \tabularnewline
10 & -0.142162 & -1.1979 & 0.117474 \tabularnewline
11 & 0.030869 & 0.2601 & 0.397767 \tabularnewline
12 & 0.019948 & 0.1681 & 0.433498 \tabularnewline
13 & -0.197921 & -1.6677 & 0.049889 \tabularnewline
14 & 0.074194 & 0.6252 & 0.266932 \tabularnewline
15 & 0.118367 & 0.9974 & 0.160984 \tabularnewline
16 & -0.270743 & -2.2813 & 0.012766 \tabularnewline
17 & 0.146607 & 1.2353 & 0.110389 \tabularnewline
18 & 0.166003 & 1.3988 & 0.083118 \tabularnewline
19 & -0.239316 & -2.0165 & 0.023765 \tabularnewline
20 & 0.098149 & 0.827 & 0.205499 \tabularnewline
21 & 0.157734 & 1.3291 & 0.094037 \tabularnewline
22 & -0.302843 & -2.5518 & 0.006435 \tabularnewline
23 & 0.346916 & 2.9232 & 0.002323 \tabularnewline
24 & -0.160571 & -1.353 & 0.090174 \tabularnewline
25 & -0.079038 & -0.666 & 0.253788 \tabularnewline
26 & 0.254251 & 2.1424 & 0.017797 \tabularnewline
27 & -0.207646 & -1.7497 & 0.042249 \tabularnewline
28 & 0.068433 & 0.5766 & 0.283006 \tabularnewline
29 & 0.07564 & 0.6374 & 0.262973 \tabularnewline
30 & -0.157798 & -1.3296 & 0.093948 \tabularnewline
31 & -0.005385 & -0.0454 & 0.481967 \tabularnewline
32 & 0.106399 & 0.8965 & 0.1865 \tabularnewline
33 & -0.144675 & -1.2191 & 0.113429 \tabularnewline
34 & -0.058517 & -0.4931 & 0.311741 \tabularnewline
35 & 0.123693 & 1.0423 & 0.150414 \tabularnewline
36 & -0.102992 & -0.8678 & 0.194207 \tabularnewline
\hline
\end{tabular}
%Source: https://freestatistics.org/blog/index.php?pk=33441&T=1

[TABLE]
[ROW][C]Autocorrelation Function[/C][/ROW]
[ROW][C]Time lag k[/C][C]ACF(k)[/C][C]T-STAT[/C][C]P-value[/C][/ROW]
[ROW][C]1[/C][C]-0.518569[/C][C]-4.3695[/C][C]2.1e-05[/C][/ROW]
[ROW][C]2[/C][C]0.084284[/C][C]0.7102[/C][C]0.239957[/C][/ROW]
[ROW][C]3[/C][C]0.196934[/C][C]1.6594[/C][C]0.050724[/C][/ROW]
[ROW][C]4[/C][C]-0.148377[/C][C]-1.2503[/C][C]0.107656[/C][/ROW]
[ROW][C]5[/C][C]-0.027964[/C][C]-0.2356[/C][C]0.407201[/C][/ROW]
[ROW][C]6[/C][C]0.201401[/C][C]1.697[/C][C]0.047035[/C][/ROW]
[ROW][C]7[/C][C]-0.209715[/C][C]-1.7671[/C][C]0.040755[/C][/ROW]
[ROW][C]8[/C][C]0.076828[/C][C]0.6474[/C][C]0.259741[/C][/ROW]
[ROW][C]9[/C][C]0.116237[/C][C]0.9794[/C][C]0.165346[/C][/ROW]
[ROW][C]10[/C][C]-0.142162[/C][C]-1.1979[/C][C]0.117474[/C][/ROW]
[ROW][C]11[/C][C]0.030869[/C][C]0.2601[/C][C]0.397767[/C][/ROW]
[ROW][C]12[/C][C]0.019948[/C][C]0.1681[/C][C]0.433498[/C][/ROW]
[ROW][C]13[/C][C]-0.197921[/C][C]-1.6677[/C][C]0.049889[/C][/ROW]
[ROW][C]14[/C][C]0.074194[/C][C]0.6252[/C][C]0.266932[/C][/ROW]
[ROW][C]15[/C][C]0.118367[/C][C]0.9974[/C][C]0.160984[/C][/ROW]
[ROW][C]16[/C][C]-0.270743[/C][C]-2.2813[/C][C]0.012766[/C][/ROW]
[ROW][C]17[/C][C]0.146607[/C][C]1.2353[/C][C]0.110389[/C][/ROW]
[ROW][C]18[/C][C]0.166003[/C][C]1.3988[/C][C]0.083118[/C][/ROW]
[ROW][C]19[/C][C]-0.239316[/C][C]-2.0165[/C][C]0.023765[/C][/ROW]
[ROW][C]20[/C][C]0.098149[/C][C]0.827[/C][C]0.205499[/C][/ROW]
[ROW][C]21[/C][C]0.157734[/C][C]1.3291[/C][C]0.094037[/C][/ROW]
[ROW][C]22[/C][C]-0.302843[/C][C]-2.5518[/C][C]0.006435[/C][/ROW]
[ROW][C]23[/C][C]0.346916[/C][C]2.9232[/C][C]0.002323[/C][/ROW]
[ROW][C]24[/C][C]-0.160571[/C][C]-1.353[/C][C]0.090174[/C][/ROW]
[ROW][C]25[/C][C]-0.079038[/C][C]-0.666[/C][C]0.253788[/C][/ROW]
[ROW][C]26[/C][C]0.254251[/C][C]2.1424[/C][C]0.017797[/C][/ROW]
[ROW][C]27[/C][C]-0.207646[/C][C]-1.7497[/C][C]0.042249[/C][/ROW]
[ROW][C]28[/C][C]0.068433[/C][C]0.5766[/C][C]0.283006[/C][/ROW]
[ROW][C]29[/C][C]0.07564[/C][C]0.6374[/C][C]0.262973[/C][/ROW]
[ROW][C]30[/C][C]-0.157798[/C][C]-1.3296[/C][C]0.093948[/C][/ROW]
[ROW][C]31[/C][C]-0.005385[/C][C]-0.0454[/C][C]0.481967[/C][/ROW]
[ROW][C]32[/C][C]0.106399[/C][C]0.8965[/C][C]0.1865[/C][/ROW]
[ROW][C]33[/C][C]-0.144675[/C][C]-1.2191[/C][C]0.113429[/C][/ROW]
[ROW][C]34[/C][C]-0.058517[/C][C]-0.4931[/C][C]0.311741[/C][/ROW]
[ROW][C]35[/C][C]0.123693[/C][C]1.0423[/C][C]0.150414[/C][/ROW]
[ROW][C]36[/C][C]-0.102992[/C][C]-0.8678[/C][C]0.194207[/C][/ROW]
[/TABLE]
Source: https://freestatistics.org/blog/index.php?pk=33441&T=1

Globally Unique Identifier (entire table): ba.freestatistics.org/blog/index.php?pk=33441&T=1

As an alternative you can also use a QR Code:  

The GUIDs for individual cells are displayed in the table below:

Autocorrelation Function
Time lag kACF(k)T-STATP-value
1-0.518569-4.36952.1e-05
20.0842840.71020.239957
30.1969341.65940.050724
4-0.148377-1.25030.107656
5-0.027964-0.23560.407201
60.2014011.6970.047035
7-0.209715-1.76710.040755
80.0768280.64740.259741
90.1162370.97940.165346
10-0.142162-1.19790.117474
110.0308690.26010.397767
120.0199480.16810.433498
13-0.197921-1.66770.049889
140.0741940.62520.266932
150.1183670.99740.160984
16-0.270743-2.28130.012766
170.1466071.23530.110389
180.1660031.39880.083118
19-0.239316-2.01650.023765
200.0981490.8270.205499
210.1577341.32910.094037
22-0.302843-2.55180.006435
230.3469162.92320.002323
24-0.160571-1.3530.090174
25-0.079038-0.6660.253788
260.2542512.14240.017797
27-0.207646-1.74970.042249
280.0684330.57660.283006
290.075640.63740.262973
30-0.157798-1.32960.093948
31-0.005385-0.04540.481967
320.1063990.89650.1865
33-0.144675-1.21910.113429
34-0.058517-0.49310.311741
350.1236931.04230.150414
36-0.102992-0.86780.194207


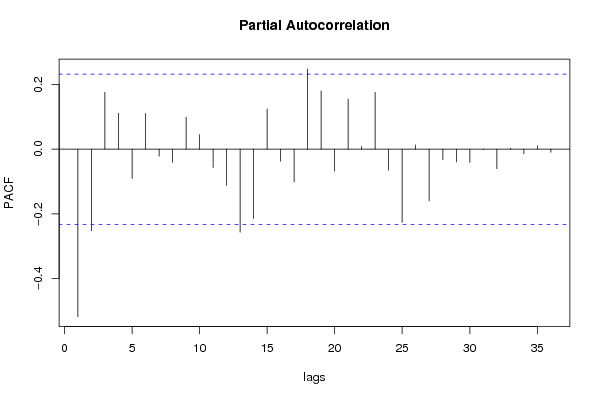
Partial Autocorrelation Function
Time lag kPACF(k)T-STATP-value
1-0.518569-4.36952.1e-05
2-0.252542-2.1280.018407
30.176371.48610.070837
40.1113670.93840.175612
5-0.090526-0.76280.224058
60.1107120.93290.177024
7-0.021708-0.18290.427692
8-0.040844-0.34420.365872
90.0986890.83160.204221
100.0447050.37670.353762
11-0.056598-0.47690.317448
12-0.112252-0.94590.173716
13-0.257148-2.16680.016805
14-0.214952-1.81120.037169
150.1243571.04780.149132
16-0.037256-0.31390.377251
17-0.101051-0.85150.198685
180.2482912.09210.020001
190.1797071.51420.067203
20-0.067945-0.57250.284391
210.1549171.30540.097994
220.0082680.06970.472328
230.1759311.48240.071327
24-0.065145-0.54890.292389
25-0.226805-1.91110.030015
260.0131880.11110.455916
27-0.160148-1.34940.090743
28-0.032731-0.27580.391752
29-0.039552-0.33330.369957
30-0.041011-0.34560.365346
31-0.001725-0.01450.494222
32-0.060652-0.51110.305446
330.0025470.02150.49147
34-0.014391-0.12130.451912
350.0112550.09480.462356
36-0.009764-0.08230.46733

\begin{tabular}{lllllllll}
\hline
Partial Autocorrelation Function \tabularnewline
Time lag k & PACF(k) & T-STAT & P-value \tabularnewline
1 & -0.518569 & -4.3695 & 2.1e-05 \tabularnewline
2 & -0.252542 & -2.128 & 0.018407 \tabularnewline
3 & 0.17637 & 1.4861 & 0.070837 \tabularnewline
4 & 0.111367 & 0.9384 & 0.175612 \tabularnewline
5 & -0.090526 & -0.7628 & 0.224058 \tabularnewline
6 & 0.110712 & 0.9329 & 0.177024 \tabularnewline
7 & -0.021708 & -0.1829 & 0.427692 \tabularnewline
8 & -0.040844 & -0.3442 & 0.365872 \tabularnewline
9 & 0.098689 & 0.8316 & 0.204221 \tabularnewline
10 & 0.044705 & 0.3767 & 0.353762 \tabularnewline
11 & -0.056598 & -0.4769 & 0.317448 \tabularnewline
12 & -0.112252 & -0.9459 & 0.173716 \tabularnewline
13 & -0.257148 & -2.1668 & 0.016805 \tabularnewline
14 & -0.214952 & -1.8112 & 0.037169 \tabularnewline
15 & 0.124357 & 1.0478 & 0.149132 \tabularnewline
16 & -0.037256 & -0.3139 & 0.377251 \tabularnewline
17 & -0.101051 & -0.8515 & 0.198685 \tabularnewline
18 & 0.248291 & 2.0921 & 0.020001 \tabularnewline
19 & 0.179707 & 1.5142 & 0.067203 \tabularnewline
20 & -0.067945 & -0.5725 & 0.284391 \tabularnewline
21 & 0.154917 & 1.3054 & 0.097994 \tabularnewline
22 & 0.008268 & 0.0697 & 0.472328 \tabularnewline
23 & 0.175931 & 1.4824 & 0.071327 \tabularnewline
24 & -0.065145 & -0.5489 & 0.292389 \tabularnewline
25 & -0.226805 & -1.9111 & 0.030015 \tabularnewline
26 & 0.013188 & 0.1111 & 0.455916 \tabularnewline
27 & -0.160148 & -1.3494 & 0.090743 \tabularnewline
28 & -0.032731 & -0.2758 & 0.391752 \tabularnewline
29 & -0.039552 & -0.3333 & 0.369957 \tabularnewline
30 & -0.041011 & -0.3456 & 0.365346 \tabularnewline
31 & -0.001725 & -0.0145 & 0.494222 \tabularnewline
32 & -0.060652 & -0.5111 & 0.305446 \tabularnewline
33 & 0.002547 & 0.0215 & 0.49147 \tabularnewline
34 & -0.014391 & -0.1213 & 0.451912 \tabularnewline
35 & 0.011255 & 0.0948 & 0.462356 \tabularnewline
36 & -0.009764 & -0.0823 & 0.46733 \tabularnewline
\hline
\end{tabular}
%Source: https://freestatistics.org/blog/index.php?pk=33441&T=2

[TABLE]
[ROW][C]Partial Autocorrelation Function[/C][/ROW]
[ROW][C]Time lag k[/C][C]PACF(k)[/C][C]T-STAT[/C][C]P-value[/C][/ROW]
[ROW][C]1[/C][C]-0.518569[/C][C]-4.3695[/C][C]2.1e-05[/C][/ROW]
[ROW][C]2[/C][C]-0.252542[/C][C]-2.128[/C][C]0.018407[/C][/ROW]
[ROW][C]3[/C][C]0.17637[/C][C]1.4861[/C][C]0.070837[/C][/ROW]
[ROW][C]4[/C][C]0.111367[/C][C]0.9384[/C][C]0.175612[/C][/ROW]
[ROW][C]5[/C][C]-0.090526[/C][C]-0.7628[/C][C]0.224058[/C][/ROW]
[ROW][C]6[/C][C]0.110712[/C][C]0.9329[/C][C]0.177024[/C][/ROW]
[ROW][C]7[/C][C]-0.021708[/C][C]-0.1829[/C][C]0.427692[/C][/ROW]
[ROW][C]8[/C][C]-0.040844[/C][C]-0.3442[/C][C]0.365872[/C][/ROW]
[ROW][C]9[/C][C]0.098689[/C][C]0.8316[/C][C]0.204221[/C][/ROW]
[ROW][C]10[/C][C]0.044705[/C][C]0.3767[/C][C]0.353762[/C][/ROW]
[ROW][C]11[/C][C]-0.056598[/C][C]-0.4769[/C][C]0.317448[/C][/ROW]
[ROW][C]12[/C][C]-0.112252[/C][C]-0.9459[/C][C]0.173716[/C][/ROW]
[ROW][C]13[/C][C]-0.257148[/C][C]-2.1668[/C][C]0.016805[/C][/ROW]
[ROW][C]14[/C][C]-0.214952[/C][C]-1.8112[/C][C]0.037169[/C][/ROW]
[ROW][C]15[/C][C]0.124357[/C][C]1.0478[/C][C]0.149132[/C][/ROW]
[ROW][C]16[/C][C]-0.037256[/C][C]-0.3139[/C][C]0.377251[/C][/ROW]
[ROW][C]17[/C][C]-0.101051[/C][C]-0.8515[/C][C]0.198685[/C][/ROW]
[ROW][C]18[/C][C]0.248291[/C][C]2.0921[/C][C]0.020001[/C][/ROW]
[ROW][C]19[/C][C]0.179707[/C][C]1.5142[/C][C]0.067203[/C][/ROW]
[ROW][C]20[/C][C]-0.067945[/C][C]-0.5725[/C][C]0.284391[/C][/ROW]
[ROW][C]21[/C][C]0.154917[/C][C]1.3054[/C][C]0.097994[/C][/ROW]
[ROW][C]22[/C][C]0.008268[/C][C]0.0697[/C][C]0.472328[/C][/ROW]
[ROW][C]23[/C][C]0.175931[/C][C]1.4824[/C][C]0.071327[/C][/ROW]
[ROW][C]24[/C][C]-0.065145[/C][C]-0.5489[/C][C]0.292389[/C][/ROW]
[ROW][C]25[/C][C]-0.226805[/C][C]-1.9111[/C][C]0.030015[/C][/ROW]
[ROW][C]26[/C][C]0.013188[/C][C]0.1111[/C][C]0.455916[/C][/ROW]
[ROW][C]27[/C][C]-0.160148[/C][C]-1.3494[/C][C]0.090743[/C][/ROW]
[ROW][C]28[/C][C]-0.032731[/C][C]-0.2758[/C][C]0.391752[/C][/ROW]
[ROW][C]29[/C][C]-0.039552[/C][C]-0.3333[/C][C]0.369957[/C][/ROW]
[ROW][C]30[/C][C]-0.041011[/C][C]-0.3456[/C][C]0.365346[/C][/ROW]
[ROW][C]31[/C][C]-0.001725[/C][C]-0.0145[/C][C]0.494222[/C][/ROW]
[ROW][C]32[/C][C]-0.060652[/C][C]-0.5111[/C][C]0.305446[/C][/ROW]
[ROW][C]33[/C][C]0.002547[/C][C]0.0215[/C][C]0.49147[/C][/ROW]
[ROW][C]34[/C][C]-0.014391[/C][C]-0.1213[/C][C]0.451912[/C][/ROW]
[ROW][C]35[/C][C]0.011255[/C][C]0.0948[/C][C]0.462356[/C][/ROW]
[ROW][C]36[/C][C]-0.009764[/C][C]-0.0823[/C][C]0.46733[/C][/ROW]
[/TABLE]
Source: https://freestatistics.org/blog/index.php?pk=33441&T=2

Globally Unique Identifier (entire table): ba.freestatistics.org/blog/index.php?pk=33441&T=2

As an alternative you can also use a QR Code:  

The GUIDs for individual cells are displayed in the table below:

Partial Autocorrelation Function
Time lag kPACF(k)T-STATP-value
1-0.518569-4.36952.1e-05
2-0.252542-2.1280.018407
30.176371.48610.070837
40.1113670.93840.175612
5-0.090526-0.76280.224058
60.1107120.93290.177024
7-0.021708-0.18290.427692
8-0.040844-0.34420.365872
90.0986890.83160.204221
100.0447050.37670.353762
11-0.056598-0.47690.317448
12-0.112252-0.94590.173716
13-0.257148-2.16680.016805
14-0.214952-1.81120.037169
150.1243571.04780.149132
16-0.037256-0.31390.377251
17-0.101051-0.85150.198685
180.2482912.09210.020001
190.1797071.51420.067203
20-0.067945-0.57250.284391
210.1549171.30540.097994
220.0082680.06970.472328
230.1759311.48240.071327
24-0.065145-0.54890.292389
25-0.226805-1.91110.030015
260.0131880.11110.455916
27-0.160148-1.34940.090743
28-0.032731-0.27580.391752
29-0.039552-0.33330.369957
30-0.041011-0.34560.365346
31-0.001725-0.01450.494222
32-0.060652-0.51110.305446
330.0025470.02150.49147
34-0.014391-0.12130.451912
350.0112550.09480.462356
36-0.009764-0.08230.46733


Parameters (Session):
par1 = 36 ; par2 = 1 ; par3 = 0 ; par4 = 1 ; par5 = 12 ;
Parameters (R input):
par1 = 36 ; par2 = 1 ; par3 = 1 ; par4 = 1 ; par5 = 12 ;
R code (references can be found in the software module):
if (par1 == 'Default') {
par1 = 10*log10(length(x))
} else {
par1 <- as.numeric(par1)
}
par2 <- as.numeric(par2)
par3 <- as.numeric(par3)
par4 <- as.numeric(par4)
par5 <- as.numeric(par5)
if (par2 == 0) {
x <- log(x)
} else {
x <- (x ^ par2 - 1) / par2
}
if (par3 > 0) x <- diff(x,lag=1,difference=par3)
if (par4 > 0) x <- diff(x,lag=par5,difference=par4)
bitmap(file='pic1.png')
racf <- acf(x,par1,main='Autocorrelation',xlab='lags',ylab='ACF')
dev.off()
bitmap(file='pic2.png')
rpacf <- pacf(x,par1,main='Partial Autocorrelation',xlab='lags',ylab='PACF')
dev.off()
(myacf <- c(racf$acf))
(mypacf <- c(rpacf$acf))
lengthx <- length(x)
sqrtn <- sqrt(lengthx)
load(file='createtable')
a<-table.start()
a<-table.row.start(a)
a<-table.element(a,'Autocorrelation Function',4,TRUE)
a<-table.row.end(a)
a<-table.row.start(a)
a<-table.element(a,'Time lag k',header=TRUE)
a<-table.element(a,hyperlink('basics.htm','ACF(k)','click here for more information about the Autocorrelation Function'),header=TRUE)
a<-table.element(a,'T-STAT',header=TRUE)
a<-table.element(a,'P-value',header=TRUE)
a<-table.row.end(a)
for (i in 2:(par1+1)) {
a<-table.row.start(a)
a<-table.element(a,i-1,header=TRUE)
a<-table.element(a,round(myacf[i],6))
mytstat <- myacf[i]*sqrtn
a<-table.element(a,round(mytstat,4))
a<-table.element(a,round(1-pt(abs(mytstat),lengthx),6))
a<-table.row.end(a)
}
a<-table.end(a)
table.save(a,file='mytable.tab')
a<-table.start()
a<-table.row.start(a)
a<-table.element(a,'Partial Autocorrelation Function',4,TRUE)
a<-table.row.end(a)
a<-table.row.start(a)
a<-table.element(a,'Time lag k',header=TRUE)
a<-table.element(a,hyperlink('basics.htm','PACF(k)','click here for more information about the Partial Autocorrelation Function'),header=TRUE)
a<-table.element(a,'T-STAT',header=TRUE)
a<-table.element(a,'P-value',header=TRUE)
a<-table.row.end(a)
for (i in 1:par1) {
a<-table.row.start(a)
a<-table.element(a,i,header=TRUE)
a<-table.element(a,round(mypacf[i],6))
mytstat <- mypacf[i]*sqrtn
a<-table.element(a,round(mytstat,4))
a<-table.element(a,round(1-pt(abs(mytstat),lengthx),6))
a<-table.row.end(a)
}
a<-table.end(a)
table.save(a,file='mytable1.tab')