Free Statistics

of Irreproducible Research!

Author's title

Author*The author of this computation has been verified*
R Software Modulerwasp_arimabackwardselection.wasp
Title produced by softwareARIMA Backward Selection
Date of computationSun, 14 Dec 2008 08:42:25 -0700
Cite this page as followsStatistical Computations at FreeStatistics.org, Office for Research Development and Education, URL https://freestatistics.org/blog/index.php?v=date/2008/Dec/14/t1229269470rppt1aa8a7qhwzg.htm/, Retrieved Wed, 15 May 2024 09:59:18 +0000
Statistical Computations at FreeStatistics.org, Office for Research Development and Education, URL https://freestatistics.org/blog/index.php?pk=33433, Retrieved Wed, 15 May 2024 09:59:18 +0000
QR Codes:

Original text written by user:
IsPrivate?No (this computation is public)
User-defined keywords
Estimated Impact253
Family? (F = Feedback message, R = changed R code, M = changed R Module, P = changed Parameters, D = changed Data)
F     [Univariate Data Series] [Airline data] [2007-10-18 09:58:47] [42daae401fd3def69a25014f2252b4c2]
F RMPD  [Cross Correlation Function] [Q7 - zonder trans...] [2008-12-01 20:04:13] [299afd6311e4c20059ea2f05c8dd029d]
F RM D    [Variance Reduction Matrix] [Q8] [2008-12-01 20:20:44] [299afd6311e4c20059ea2f05c8dd029d]
F    D      [Variance Reduction Matrix] [Q8 - 2] [2008-12-01 20:25:07] [299afd6311e4c20059ea2f05c8dd029d]
F RM D        [Standard Deviation-Mean Plot] [Deel 2: Step 1] [2008-12-08 20:09:35] [299afd6311e4c20059ea2f05c8dd029d]
F RM D          [ARIMA Backward Selection] [Deel 2: Step 5] [2008-12-08 20:35:27] [299afd6311e4c20059ea2f05c8dd029d]
-   P               [ARIMA Backward Selection] [Uitvoer vanuit Be...] [2008-12-14 15:42:25] [5e2b1e7aa808f9f0d23fd35605d4968f] [Current]
- RMPD                [Multiple Regression] [] [2010-12-21 16:18:28] [1c63f3c303537b65dfa698074d619a3e]
Feedback Forum

Post a new message
Dataseries X:
14291.1
14205.3
15859.4
15258.9
15498.6
15106.5
15023.6
12083
15761.3
16943
15070.3
13659.6
14768.9
14725.1
15998.1
15370.6
14956.9
15469.7
15101.8
11703.7
16283.6
16726.5
14968.9
14861
14583.3
15305.8
17903.9
16379.4
15420.3
17870.5
15912.8
13866.5
17823.2
17872
17420.4
16704.4
15991.2
16583.6
19123.5
17838.7
17209.4
18586.5
16258.1
15141.6
19202.1
17746.5
19090.1
18040.3
17515.5
17751.8
21072.4
17170
19439.5
19795.4
17574.9
16165.4
19464.6
19932.1
19961.2
17343.4
18924.2
18574.1
21350.6
18594.6
19823.1
20844.4
19640.2
17735.4
19813.6
22160
20664.3
17877.4


Summary of computational transaction
Raw Inputview raw input (R code)
Raw Outputview raw output of R engine
Computing time14 seconds
R Server'Sir Ronald Aylmer Fisher' @ 193.190.124.24

\begin{tabular}{lllllllll}
\hline
Summary of computational transaction \tabularnewline
Raw Input & view raw input (R code)  \tabularnewline
Raw Output & view raw output of R engine  \tabularnewline
Computing time & 14 seconds \tabularnewline
R Server & 'Sir Ronald Aylmer Fisher' @ 193.190.124.24 \tabularnewline
\hline
\end{tabular}
%Source: https://freestatistics.org/blog/index.php?pk=33433&T=0

[TABLE]
[ROW][C]Summary of computational transaction[/C][/ROW]
[ROW][C]Raw Input[/C][C]view raw input (R code) [/C][/ROW]
[ROW][C]Raw Output[/C][C]view raw output of R engine [/C][/ROW]
[ROW][C]Computing time[/C][C]14 seconds[/C][/ROW]
[ROW][C]R Server[/C][C]'Sir Ronald Aylmer Fisher' @ 193.190.124.24[/C][/ROW]
[/TABLE]
Source: https://freestatistics.org/blog/index.php?pk=33433&T=0

Globally Unique Identifier (entire table): ba.freestatistics.org/blog/index.php?pk=33433&T=0

As an alternative you can also use a QR Code:  

The GUIDs for individual cells are displayed in the table below:

Summary of computational transaction
Raw Inputview raw input (R code)
Raw Outputview raw output of R engine
Computing time14 seconds
R Server'Sir Ronald Aylmer Fisher' @ 193.190.124.24


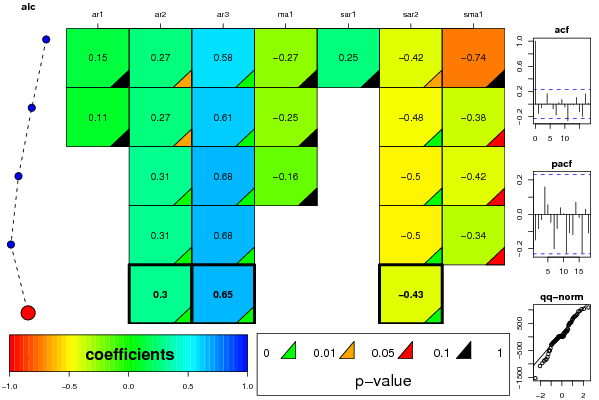
ARIMA Parameter Estimation and Backward Selection
Iterationar1ar2ar3ma1sar1sar2sma1
Estimates ( 1 )0.14760.27130.5793-0.27020.2549-0.4152-0.7447
(p-val)(0.3626 )(0.0138 )(1e-04 )(0.1218 )(0.4749 )(0.0332 )(0.3157 )
Estimates ( 2 )0.11070.26730.6146-0.24890-0.4793-0.3846
(p-val)(0.435 )(0.0116 )(0 )(0.1397 )(NA )(0.0014 )(0.0768 )
Estimates ( 3 )00.31290.6797-0.16320-0.496-0.4212
(p-val)(NA )(3e-04 )(0 )(0.2584 )(NA )(6e-04 )(0.0632 )
Estimates ( 4 )00.31070.675400-0.5021-0.3428
(p-val)(NA )(1e-04 )(0 )(NA )(NA )(5e-04 )(0.0788 )
Estimates ( 5 )00.30270.65300-0.430
(p-val)(NA )(3e-04 )(0 )(NA )(NA )(0.0058 )(NA )
Estimates ( 6 )NANANANANANANA
(p-val)(NA )(NA )(NA )(NA )(NA )(NA )(NA )
Estimates ( 7 )NANANANANANANA
(p-val)(NA )(NA )(NA )(NA )(NA )(NA )(NA )
Estimates ( 8 )NANANANANANANA
(p-val)(NA )(NA )(NA )(NA )(NA )(NA )(NA )
Estimates ( 9 )NANANANANANANA
(p-val)(NA )(NA )(NA )(NA )(NA )(NA )(NA )
Estimates ( 10 )NANANANANANANA
(p-val)(NA )(NA )(NA )(NA )(NA )(NA )(NA )
Estimates ( 11 )NANANANANANANA
(p-val)(NA )(NA )(NA )(NA )(NA )(NA )(NA )
Estimates ( 12 )NANANANANANANA
(p-val)(NA )(NA )(NA )(NA )(NA )(NA )(NA )
Estimates ( 13 )NANANANANANANA
(p-val)(NA )(NA )(NA )(NA )(NA )(NA )(NA )

\begin{tabular}{lllllllll}
\hline
ARIMA Parameter Estimation and Backward Selection \tabularnewline
Iteration & ar1 & ar2 & ar3 & ma1 & sar1 & sar2 & sma1 \tabularnewline
Estimates ( 1 ) & 0.1476 & 0.2713 & 0.5793 & -0.2702 & 0.2549 & -0.4152 & -0.7447 \tabularnewline
(p-val) & (0.3626 ) & (0.0138 ) & (1e-04 ) & (0.1218 ) & (0.4749 ) & (0.0332 ) & (0.3157 ) \tabularnewline
Estimates ( 2 ) & 0.1107 & 0.2673 & 0.6146 & -0.2489 & 0 & -0.4793 & -0.3846 \tabularnewline
(p-val) & (0.435 ) & (0.0116 ) & (0 ) & (0.1397 ) & (NA ) & (0.0014 ) & (0.0768 ) \tabularnewline
Estimates ( 3 ) & 0 & 0.3129 & 0.6797 & -0.1632 & 0 & -0.496 & -0.4212 \tabularnewline
(p-val) & (NA ) & (3e-04 ) & (0 ) & (0.2584 ) & (NA ) & (6e-04 ) & (0.0632 ) \tabularnewline
Estimates ( 4 ) & 0 & 0.3107 & 0.6754 & 0 & 0 & -0.5021 & -0.3428 \tabularnewline
(p-val) & (NA ) & (1e-04 ) & (0 ) & (NA ) & (NA ) & (5e-04 ) & (0.0788 ) \tabularnewline
Estimates ( 5 ) & 0 & 0.3027 & 0.653 & 0 & 0 & -0.43 & 0 \tabularnewline
(p-val) & (NA ) & (3e-04 ) & (0 ) & (NA ) & (NA ) & (0.0058 ) & (NA ) \tabularnewline
Estimates ( 6 ) & NA & NA & NA & NA & NA & NA & NA \tabularnewline
(p-val) & (NA ) & (NA ) & (NA ) & (NA ) & (NA ) & (NA ) & (NA ) \tabularnewline
Estimates ( 7 ) & NA & NA & NA & NA & NA & NA & NA \tabularnewline
(p-val) & (NA ) & (NA ) & (NA ) & (NA ) & (NA ) & (NA ) & (NA ) \tabularnewline
Estimates ( 8 ) & NA & NA & NA & NA & NA & NA & NA \tabularnewline
(p-val) & (NA ) & (NA ) & (NA ) & (NA ) & (NA ) & (NA ) & (NA ) \tabularnewline
Estimates ( 9 ) & NA & NA & NA & NA & NA & NA & NA \tabularnewline
(p-val) & (NA ) & (NA ) & (NA ) & (NA ) & (NA ) & (NA ) & (NA ) \tabularnewline
Estimates ( 10 ) & NA & NA & NA & NA & NA & NA & NA \tabularnewline
(p-val) & (NA ) & (NA ) & (NA ) & (NA ) & (NA ) & (NA ) & (NA ) \tabularnewline
Estimates ( 11 ) & NA & NA & NA & NA & NA & NA & NA \tabularnewline
(p-val) & (NA ) & (NA ) & (NA ) & (NA ) & (NA ) & (NA ) & (NA ) \tabularnewline
Estimates ( 12 ) & NA & NA & NA & NA & NA & NA & NA \tabularnewline
(p-val) & (NA ) & (NA ) & (NA ) & (NA ) & (NA ) & (NA ) & (NA ) \tabularnewline
Estimates ( 13 ) & NA & NA & NA & NA & NA & NA & NA \tabularnewline
(p-val) & (NA ) & (NA ) & (NA ) & (NA ) & (NA ) & (NA ) & (NA ) \tabularnewline
\hline
\end{tabular}
%Source: https://freestatistics.org/blog/index.php?pk=33433&T=1

[TABLE]
[ROW][C]ARIMA Parameter Estimation and Backward Selection[/C][/ROW]
[ROW][C]Iteration[/C][C]ar1[/C][C]ar2[/C][C]ar3[/C][C]ma1[/C][C]sar1[/C][C]sar2[/C][C]sma1[/C][/ROW]
[ROW][C]Estimates ( 1 )[/C][C]0.1476[/C][C]0.2713[/C][C]0.5793[/C][C]-0.2702[/C][C]0.2549[/C][C]-0.4152[/C][C]-0.7447[/C][/ROW]
[ROW][C](p-val)[/C][C](0.3626 )[/C][C](0.0138 )[/C][C](1e-04 )[/C][C](0.1218 )[/C][C](0.4749 )[/C][C](0.0332 )[/C][C](0.3157 )[/C][/ROW]
[ROW][C]Estimates ( 2 )[/C][C]0.1107[/C][C]0.2673[/C][C]0.6146[/C][C]-0.2489[/C][C]0[/C][C]-0.4793[/C][C]-0.3846[/C][/ROW]
[ROW][C](p-val)[/C][C](0.435 )[/C][C](0.0116 )[/C][C](0 )[/C][C](0.1397 )[/C][C](NA )[/C][C](0.0014 )[/C][C](0.0768 )[/C][/ROW]
[ROW][C]Estimates ( 3 )[/C][C]0[/C][C]0.3129[/C][C]0.6797[/C][C]-0.1632[/C][C]0[/C][C]-0.496[/C][C]-0.4212[/C][/ROW]
[ROW][C](p-val)[/C][C](NA )[/C][C](3e-04 )[/C][C](0 )[/C][C](0.2584 )[/C][C](NA )[/C][C](6e-04 )[/C][C](0.0632 )[/C][/ROW]
[ROW][C]Estimates ( 4 )[/C][C]0[/C][C]0.3107[/C][C]0.6754[/C][C]0[/C][C]0[/C][C]-0.5021[/C][C]-0.3428[/C][/ROW]
[ROW][C](p-val)[/C][C](NA )[/C][C](1e-04 )[/C][C](0 )[/C][C](NA )[/C][C](NA )[/C][C](5e-04 )[/C][C](0.0788 )[/C][/ROW]
[ROW][C]Estimates ( 5 )[/C][C]0[/C][C]0.3027[/C][C]0.653[/C][C]0[/C][C]0[/C][C]-0.43[/C][C]0[/C][/ROW]
[ROW][C](p-val)[/C][C](NA )[/C][C](3e-04 )[/C][C](0 )[/C][C](NA )[/C][C](NA )[/C][C](0.0058 )[/C][C](NA )[/C][/ROW]
[ROW][C]Estimates ( 6 )[/C][C]NA[/C][C]NA[/C][C]NA[/C][C]NA[/C][C]NA[/C][C]NA[/C][C]NA[/C][/ROW]
[ROW][C](p-val)[/C][C](NA )[/C][C](NA )[/C][C](NA )[/C][C](NA )[/C][C](NA )[/C][C](NA )[/C][C](NA )[/C][/ROW]
[ROW][C]Estimates ( 7 )[/C][C]NA[/C][C]NA[/C][C]NA[/C][C]NA[/C][C]NA[/C][C]NA[/C][C]NA[/C][/ROW]
[ROW][C](p-val)[/C][C](NA )[/C][C](NA )[/C][C](NA )[/C][C](NA )[/C][C](NA )[/C][C](NA )[/C][C](NA )[/C][/ROW]
[ROW][C]Estimates ( 8 )[/C][C]NA[/C][C]NA[/C][C]NA[/C][C]NA[/C][C]NA[/C][C]NA[/C][C]NA[/C][/ROW]
[ROW][C](p-val)[/C][C](NA )[/C][C](NA )[/C][C](NA )[/C][C](NA )[/C][C](NA )[/C][C](NA )[/C][C](NA )[/C][/ROW]
[ROW][C]Estimates ( 9 )[/C][C]NA[/C][C]NA[/C][C]NA[/C][C]NA[/C][C]NA[/C][C]NA[/C][C]NA[/C][/ROW]
[ROW][C](p-val)[/C][C](NA )[/C][C](NA )[/C][C](NA )[/C][C](NA )[/C][C](NA )[/C][C](NA )[/C][C](NA )[/C][/ROW]
[ROW][C]Estimates ( 10 )[/C][C]NA[/C][C]NA[/C][C]NA[/C][C]NA[/C][C]NA[/C][C]NA[/C][C]NA[/C][/ROW]
[ROW][C](p-val)[/C][C](NA )[/C][C](NA )[/C][C](NA )[/C][C](NA )[/C][C](NA )[/C][C](NA )[/C][C](NA )[/C][/ROW]
[ROW][C]Estimates ( 11 )[/C][C]NA[/C][C]NA[/C][C]NA[/C][C]NA[/C][C]NA[/C][C]NA[/C][C]NA[/C][/ROW]
[ROW][C](p-val)[/C][C](NA )[/C][C](NA )[/C][C](NA )[/C][C](NA )[/C][C](NA )[/C][C](NA )[/C][C](NA )[/C][/ROW]
[ROW][C]Estimates ( 12 )[/C][C]NA[/C][C]NA[/C][C]NA[/C][C]NA[/C][C]NA[/C][C]NA[/C][C]NA[/C][/ROW]
[ROW][C](p-val)[/C][C](NA )[/C][C](NA )[/C][C](NA )[/C][C](NA )[/C][C](NA )[/C][C](NA )[/C][C](NA )[/C][/ROW]
[ROW][C]Estimates ( 13 )[/C][C]NA[/C][C]NA[/C][C]NA[/C][C]NA[/C][C]NA[/C][C]NA[/C][C]NA[/C][/ROW]
[ROW][C](p-val)[/C][C](NA )[/C][C](NA )[/C][C](NA )[/C][C](NA )[/C][C](NA )[/C][C](NA )[/C][C](NA )[/C][/ROW]
[/TABLE]
Source: https://freestatistics.org/blog/index.php?pk=33433&T=1

Globally Unique Identifier (entire table): ba.freestatistics.org/blog/index.php?pk=33433&T=1

As an alternative you can also use a QR Code:  

The GUIDs for individual cells are displayed in the table below:

ARIMA Parameter Estimation and Backward Selection
Iterationar1ar2ar3ma1sar1sar2sma1
Estimates ( 1 )0.14760.27130.5793-0.27020.2549-0.4152-0.7447
(p-val)(0.3626 )(0.0138 )(1e-04 )(0.1218 )(0.4749 )(0.0332 )(0.3157 )
Estimates ( 2 )0.11070.26730.6146-0.24890-0.4793-0.3846
(p-val)(0.435 )(0.0116 )(0 )(0.1397 )(NA )(0.0014 )(0.0768 )
Estimates ( 3 )00.31290.6797-0.16320-0.496-0.4212
(p-val)(NA )(3e-04 )(0 )(0.2584 )(NA )(6e-04 )(0.0632 )
Estimates ( 4 )00.31070.675400-0.5021-0.3428
(p-val)(NA )(1e-04 )(0 )(NA )(NA )(5e-04 )(0.0788 )
Estimates ( 5 )00.30270.65300-0.430
(p-val)(NA )(3e-04 )(0 )(NA )(NA )(0.0058 )(NA )
Estimates ( 6 )NANANANANANANA
(p-val)(NA )(NA )(NA )(NA )(NA )(NA )(NA )
Estimates ( 7 )NANANANANANANA
(p-val)(NA )(NA )(NA )(NA )(NA )(NA )(NA )
Estimates ( 8 )NANANANANANANA
(p-val)(NA )(NA )(NA )(NA )(NA )(NA )(NA )
Estimates ( 9 )NANANANANANANA
(p-val)(NA )(NA )(NA )(NA )(NA )(NA )(NA )
Estimates ( 10 )NANANANANANANA
(p-val)(NA )(NA )(NA )(NA )(NA )(NA )(NA )
Estimates ( 11 )NANANANANANANA
(p-val)(NA )(NA )(NA )(NA )(NA )(NA )(NA )
Estimates ( 12 )NANANANANANANA
(p-val)(NA )(NA )(NA )(NA )(NA )(NA )(NA )
Estimates ( 13 )NANANANANANANA
(p-val)(NA )(NA )(NA )(NA )(NA )(NA )(NA )


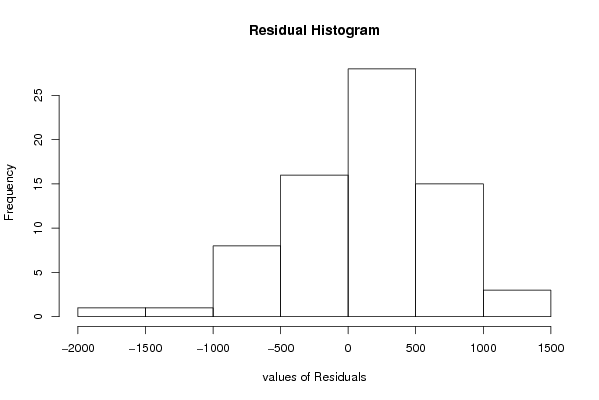
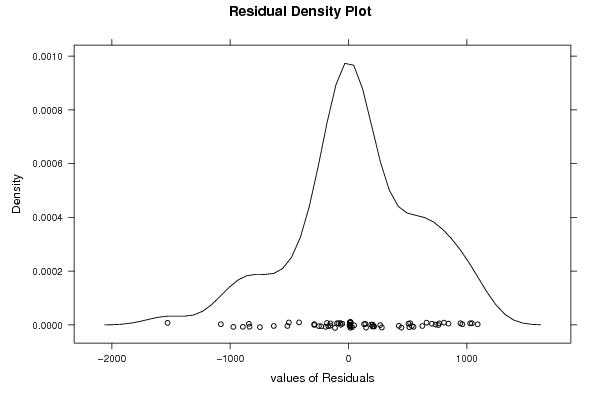
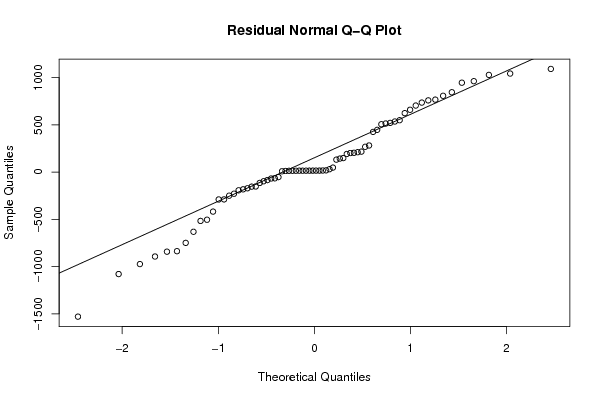
Estimated ARIMA Residuals
Value
13.6590485267886
210.684900536545
131.873768655447
-153.842608870250
-289.562909400263
-749.053059041854
202.159395782617
148.468127051206
-84.2415609220619
216.696473708394
-114.320633292668
18.6046584965543
759.43906502729
8.87585229439445
267.994727659304
962.653097801844
767.32480667431
-516.692125950326
735.999881656875
30.8305080552376
946.304585079487
-192.411126460189
-67.6840128031892
514.302354752013
535.561249188289
-152.045175827561
-631.506549886007
-182.112066642646
143.006662684084
-65.6008048925119
-228.920442724086
-1079.25270258223
47.7214163984058
845.500053742461
-836.90503412749
506.84621822194
1043.28636910749
1028.94274711065
-417.966911446411
1092.08116507684
-1530.05623029286
549.639243837824
425.501340146043
704.642126519833
-288.807395465983
-842.23713881346
659.892519004391
521.034299615903
-973.41530567306
-52.5008753142983
-170.971498451367
447.29004509346
-249.804622212798
204.481432687404
281.969604793880
624.153017905938
807.758574217488
-893.667547287845
191.815697624152
-96.7448056298984
-504.175981422507

\begin{tabular}{lllllllll}
\hline
Estimated ARIMA Residuals \tabularnewline
Value \tabularnewline
13.6590485267886 \tabularnewline
210.684900536545 \tabularnewline
131.873768655447 \tabularnewline
-153.842608870250 \tabularnewline
-289.562909400263 \tabularnewline
-749.053059041854 \tabularnewline
202.159395782617 \tabularnewline
148.468127051206 \tabularnewline
-84.2415609220619 \tabularnewline
216.696473708394 \tabularnewline
-114.320633292668 \tabularnewline
18.6046584965543 \tabularnewline
759.43906502729 \tabularnewline
8.87585229439445 \tabularnewline
267.994727659304 \tabularnewline
962.653097801844 \tabularnewline
767.32480667431 \tabularnewline
-516.692125950326 \tabularnewline
735.999881656875 \tabularnewline
30.8305080552376 \tabularnewline
946.304585079487 \tabularnewline
-192.411126460189 \tabularnewline
-67.6840128031892 \tabularnewline
514.302354752013 \tabularnewline
535.561249188289 \tabularnewline
-152.045175827561 \tabularnewline
-631.506549886007 \tabularnewline
-182.112066642646 \tabularnewline
143.006662684084 \tabularnewline
-65.6008048925119 \tabularnewline
-228.920442724086 \tabularnewline
-1079.25270258223 \tabularnewline
47.7214163984058 \tabularnewline
845.500053742461 \tabularnewline
-836.90503412749 \tabularnewline
506.84621822194 \tabularnewline
1043.28636910749 \tabularnewline
1028.94274711065 \tabularnewline
-417.966911446411 \tabularnewline
1092.08116507684 \tabularnewline
-1530.05623029286 \tabularnewline
549.639243837824 \tabularnewline
425.501340146043 \tabularnewline
704.642126519833 \tabularnewline
-288.807395465983 \tabularnewline
-842.23713881346 \tabularnewline
659.892519004391 \tabularnewline
521.034299615903 \tabularnewline
-973.41530567306 \tabularnewline
-52.5008753142983 \tabularnewline
-170.971498451367 \tabularnewline
447.29004509346 \tabularnewline
-249.804622212798 \tabularnewline
204.481432687404 \tabularnewline
281.969604793880 \tabularnewline
624.153017905938 \tabularnewline
807.758574217488 \tabularnewline
-893.667547287845 \tabularnewline
191.815697624152 \tabularnewline
-96.7448056298984 \tabularnewline
-504.175981422507 \tabularnewline
\hline
\end{tabular}
%Source: https://freestatistics.org/blog/index.php?pk=33433&T=2

[TABLE]
[ROW][C]Estimated ARIMA Residuals[/C][/ROW]
[ROW][C]Value[/C][/ROW]
[ROW][C]13.6590485267886[/C][/ROW]
[ROW][C]210.684900536545[/C][/ROW]
[ROW][C]131.873768655447[/C][/ROW]
[ROW][C]-153.842608870250[/C][/ROW]
[ROW][C]-289.562909400263[/C][/ROW]
[ROW][C]-749.053059041854[/C][/ROW]
[ROW][C]202.159395782617[/C][/ROW]
[ROW][C]148.468127051206[/C][/ROW]
[ROW][C]-84.2415609220619[/C][/ROW]
[ROW][C]216.696473708394[/C][/ROW]
[ROW][C]-114.320633292668[/C][/ROW]
[ROW][C]18.6046584965543[/C][/ROW]
[ROW][C]759.43906502729[/C][/ROW]
[ROW][C]8.87585229439445[/C][/ROW]
[ROW][C]267.994727659304[/C][/ROW]
[ROW][C]962.653097801844[/C][/ROW]
[ROW][C]767.32480667431[/C][/ROW]
[ROW][C]-516.692125950326[/C][/ROW]
[ROW][C]735.999881656875[/C][/ROW]
[ROW][C]30.8305080552376[/C][/ROW]
[ROW][C]946.304585079487[/C][/ROW]
[ROW][C]-192.411126460189[/C][/ROW]
[ROW][C]-67.6840128031892[/C][/ROW]
[ROW][C]514.302354752013[/C][/ROW]
[ROW][C]535.561249188289[/C][/ROW]
[ROW][C]-152.045175827561[/C][/ROW]
[ROW][C]-631.506549886007[/C][/ROW]
[ROW][C]-182.112066642646[/C][/ROW]
[ROW][C]143.006662684084[/C][/ROW]
[ROW][C]-65.6008048925119[/C][/ROW]
[ROW][C]-228.920442724086[/C][/ROW]
[ROW][C]-1079.25270258223[/C][/ROW]
[ROW][C]47.7214163984058[/C][/ROW]
[ROW][C]845.500053742461[/C][/ROW]
[ROW][C]-836.90503412749[/C][/ROW]
[ROW][C]506.84621822194[/C][/ROW]
[ROW][C]1043.28636910749[/C][/ROW]
[ROW][C]1028.94274711065[/C][/ROW]
[ROW][C]-417.966911446411[/C][/ROW]
[ROW][C]1092.08116507684[/C][/ROW]
[ROW][C]-1530.05623029286[/C][/ROW]
[ROW][C]549.639243837824[/C][/ROW]
[ROW][C]425.501340146043[/C][/ROW]
[ROW][C]704.642126519833[/C][/ROW]
[ROW][C]-288.807395465983[/C][/ROW]
[ROW][C]-842.23713881346[/C][/ROW]
[ROW][C]659.892519004391[/C][/ROW]
[ROW][C]521.034299615903[/C][/ROW]
[ROW][C]-973.41530567306[/C][/ROW]
[ROW][C]-52.5008753142983[/C][/ROW]
[ROW][C]-170.971498451367[/C][/ROW]
[ROW][C]447.29004509346[/C][/ROW]
[ROW][C]-249.804622212798[/C][/ROW]
[ROW][C]204.481432687404[/C][/ROW]
[ROW][C]281.969604793880[/C][/ROW]
[ROW][C]624.153017905938[/C][/ROW]
[ROW][C]807.758574217488[/C][/ROW]
[ROW][C]-893.667547287845[/C][/ROW]
[ROW][C]191.815697624152[/C][/ROW]
[ROW][C]-96.7448056298984[/C][/ROW]
[ROW][C]-504.175981422507[/C][/ROW]
[/TABLE]
Source: https://freestatistics.org/blog/index.php?pk=33433&T=2

Globally Unique Identifier (entire table): ba.freestatistics.org/blog/index.php?pk=33433&T=2

As an alternative you can also use a QR Code:  

The GUIDs for individual cells are displayed in the table below:

Estimated ARIMA Residuals
Value
13.6590485267886
210.684900536545
131.873768655447
-153.842608870250
-289.562909400263
-749.053059041854
202.159395782617
148.468127051206
-84.2415609220619
216.696473708394
-114.320633292668
18.6046584965543
759.43906502729
8.87585229439445
267.994727659304
962.653097801844
767.32480667431
-516.692125950326
735.999881656875
30.8305080552376
946.304585079487
-192.411126460189
-67.6840128031892
514.302354752013
535.561249188289
-152.045175827561
-631.506549886007
-182.112066642646
143.006662684084
-65.6008048925119
-228.920442724086
-1079.25270258223
47.7214163984058
845.500053742461
-836.90503412749
506.84621822194
1043.28636910749
1028.94274711065
-417.966911446411
1092.08116507684
-1530.05623029286
549.639243837824
425.501340146043
704.642126519833
-288.807395465983
-842.23713881346
659.892519004391
521.034299615903
-973.41530567306
-52.5008753142983
-170.971498451367
447.29004509346
-249.804622212798
204.481432687404
281.969604793880
624.153017905938
807.758574217488
-893.667547287845
191.815697624152
-96.7448056298984
-504.175981422507


Parameters (Session):
par1 = FALSE ; par2 = 1 ; par3 = 0 ; par4 = 1 ; par5 = 12 ; par6 = 3 ; par7 = 1 ; par8 = 2 ; par9 = 1 ;
Parameters (R input):
par1 = FALSE ; par2 = 1 ; par3 = 0 ; par4 = 1 ; par5 = 12 ; par6 = 3 ; par7 = 1 ; par8 = 2 ; par9 = 1 ;
R code (references can be found in the software module):
library(lattice)
if (par1 == 'TRUE') par1 <- TRUE
if (par1 == 'FALSE') par1 <- FALSE
par2 <- as.numeric(par2) #Box-Cox lambda transformation parameter
par3 <- as.numeric(par3) #degree of non-seasonal differencing
par4 <- as.numeric(par4) #degree of seasonal differencing
par5 <- as.numeric(par5) #seasonal period
par6 <- as.numeric(par6) #degree (p) of the non-seasonal AR(p) polynomial
par7 <- as.numeric(par7) #degree (q) of the non-seasonal MA(q) polynomial
par8 <- as.numeric(par8) #degree (P) of the seasonal AR(P) polynomial
par9 <- as.numeric(par9) #degree (Q) of the seasonal MA(Q) polynomial
armaGR <- function(arima.out, names, n){
try1 <- arima.out$coef
try2 <- sqrt(diag(arima.out$var.coef))
try.data.frame <- data.frame(matrix(NA,ncol=4,nrow=length(names)))
dimnames(try.data.frame) <- list(names,c('coef','std','tstat','pv'))
try.data.frame[,1] <- try1
for(i in 1:length(try2)) try.data.frame[which(rownames(try.data.frame)==names(try2)[i]),2] <- try2[i]
try.data.frame[,3] <- try.data.frame[,1] / try.data.frame[,2]
try.data.frame[,4] <- round((1-pt(abs(try.data.frame[,3]),df=n-(length(try2)+1)))*2,5)
vector <- rep(NA,length(names))
vector[is.na(try.data.frame[,4])] <- 0
maxi <- which.max(try.data.frame[,4])
continue <- max(try.data.frame[,4],na.rm=TRUE) > .05
vector[maxi] <- 0
list(summary=try.data.frame,next.vector=vector,continue=continue)
}
arimaSelect <- function(series, order=c(13,0,0), seasonal=list(order=c(2,0,0),period=12), include.mean=F){
nrc <- order[1]+order[3]+seasonal$order[1]+seasonal$order[3]
coeff <- matrix(NA, nrow=nrc*2, ncol=nrc)
pval <- matrix(NA, nrow=nrc*2, ncol=nrc)
mylist <- rep(list(NULL), nrc)
names <- NULL
if(order[1] > 0) names <- paste('ar',1:order[1],sep='')
if(order[3] > 0) names <- c( names , paste('ma',1:order[3],sep='') )
if(seasonal$order[1] > 0) names <- c(names, paste('sar',1:seasonal$order[1],sep=''))
if(seasonal$order[3] > 0) names <- c(names, paste('sma',1:seasonal$order[3],sep=''))
arima.out <- arima(series, order=order, seasonal=seasonal, include.mean=include.mean, method='ML')
mylist[[1]] <- arima.out
last.arma <- armaGR(arima.out, names, length(series))
mystop <- FALSE
i <- 1
coeff[i,] <- last.arma[[1]][,1]
pval [i,] <- last.arma[[1]][,4]
i <- 2
aic <- arima.out$aic
while(!mystop){
mylist[[i]] <- arima.out
arima.out <- arima(series, order=order, seasonal=seasonal, include.mean=include.mean, method='ML', fixed=last.arma$next.vector)
aic <- c(aic, arima.out$aic)
last.arma <- armaGR(arima.out, names, length(series))
mystop <- !last.arma$continue
coeff[i,] <- last.arma[[1]][,1]
pval [i,] <- last.arma[[1]][,4]
i <- i+1
}
list(coeff, pval, mylist, aic=aic)
}
arimaSelectplot <- function(arimaSelect.out,noms,choix){
noms <- names(arimaSelect.out[[3]][[1]]$coef)
coeff <- arimaSelect.out[[1]]
k <- min(which(is.na(coeff[,1])))-1
coeff <- coeff[1:k,]
pval <- arimaSelect.out[[2]][1:k,]
aic <- arimaSelect.out$aic[1:k]
coeff[coeff==0] <- NA
n <- ncol(coeff)
if(missing(choix)) choix <- k
layout(matrix(c(1,1,1,2,
3,3,3,2,
3,3,3,4,
5,6,7,7),nr=4),
widths=c(10,35,45,15),
heights=c(30,30,15,15))
couleurs <- rainbow(75)[1:50]#(50)
ticks <- pretty(coeff)
par(mar=c(1,1,3,1))
plot(aic,k:1-.5,type='o',pch=21,bg='blue',cex=2,axes=F,lty=2,xpd=NA)
points(aic[choix],k-choix+.5,pch=21,cex=4,bg=2,xpd=NA)
title('aic',line=2)
par(mar=c(3,0,0,0))
plot(0,axes=F,xlab='',ylab='',xlim=range(ticks),ylim=c(.1,1))
rect(xleft = min(ticks) + (0:49)/50*(max(ticks)-min(ticks)),
xright = min(ticks) + (1:50)/50*(max(ticks)-min(ticks)),
ytop = rep(1,50),
ybottom= rep(0,50),col=couleurs,border=NA)
axis(1,ticks)
rect(xleft=min(ticks),xright=max(ticks),ytop=1,ybottom=0)
text(mean(coeff,na.rm=T),.5,'coefficients',cex=2,font=2)
par(mar=c(1,1,3,1))
image(1:n,1:k,t(coeff[k:1,]),axes=F,col=couleurs,zlim=range(ticks))
for(i in 1:n) for(j in 1:k) if(!is.na(coeff[j,i])) {
if(pval[j,i]<.01) symb = 'green'
else if( (pval[j,i]<.05) & (pval[j,i]>=.01)) symb = 'orange'
else if( (pval[j,i]<.1) & (pval[j,i]>=.05)) symb = 'red'
else symb = 'black'
polygon(c(i+.5 ,i+.2 ,i+.5 ,i+.5),
c(k-j+0.5,k-j+0.5,k-j+0.8,k-j+0.5),
col=symb)
if(j==choix) {
rect(xleft=i-.5,
xright=i+.5,
ybottom=k-j+1.5,
ytop=k-j+.5,
lwd=4)
text(i,
k-j+1,
round(coeff[j,i],2),
cex=1.2,
font=2)
}
else{
rect(xleft=i-.5,xright=i+.5,ybottom=k-j+1.5,ytop=k-j+.5)
text(i,k-j+1,round(coeff[j,i],2),cex=1.2,font=1)
}
}
axis(3,1:n,noms)
par(mar=c(0.5,0,0,0.5))
plot(0,axes=F,xlab='',ylab='',type='n',xlim=c(0,8),ylim=c(-.2,.8))
cols <- c('green','orange','red','black')
niv <- c('0','0.01','0.05','0.1')
for(i in 0:3){
polygon(c(1+2*i ,1+2*i ,1+2*i-.5 ,1+2*i),
c(.4 ,.7 , .4 , .4),
col=cols[i+1])
text(2*i,0.5,niv[i+1],cex=1.5)
}
text(8,.5,1,cex=1.5)
text(4,0,'p-value',cex=2)
box()
residus <- arimaSelect.out[[3]][[choix]]$res
par(mar=c(1,2,4,1))
acf(residus,main='')
title('acf',line=.5)
par(mar=c(1,2,4,1))
pacf(residus,main='')
title('pacf',line=.5)
par(mar=c(2,2,4,1))
qqnorm(residus,main='')
title('qq-norm',line=.5)
qqline(residus)
residus
}
if (par2 == 0) x <- log(x)
if (par2 != 0) x <- x^par2
(selection <- arimaSelect(x, order=c(par6,par3,par7), seasonal=list(order=c(par8,par4,par9), period=par5)))
bitmap(file='test1.png')
resid <- arimaSelectplot(selection)
dev.off()
resid
bitmap(file='test2.png')
acf(resid,length(resid)/2, main='Residual Autocorrelation Function')
dev.off()
bitmap(file='test3.png')
pacf(resid,length(resid)/2, main='Residual Partial Autocorrelation Function')
dev.off()
bitmap(file='test4.png')
cpgram(resid, main='Residual Cumulative Periodogram')
dev.off()
bitmap(file='test5.png')
hist(resid, main='Residual Histogram', xlab='values of Residuals')
dev.off()
bitmap(file='test6.png')
densityplot(~resid,col='black',main='Residual Density Plot', xlab='values of Residuals')
dev.off()
bitmap(file='test7.png')
qqnorm(resid, main='Residual Normal Q-Q Plot')
qqline(resid)
dev.off()
ncols <- length(selection[[1]][1,])
nrows <- length(selection[[2]][,1])-1
load(file='createtable')
a<-table.start()
a<-table.row.start(a)
a<-table.element(a,'ARIMA Parameter Estimation and Backward Selection', ncols+1,TRUE)
a<-table.row.end(a)
a<-table.row.start(a)
a<-table.element(a,'Iteration', header=TRUE)
for (i in 1:ncols) {
a<-table.element(a,names(selection[[3]][[1]]$coef)[i],header=TRUE)
}
a<-table.row.end(a)
for (j in 1:nrows) {
a<-table.row.start(a)
mydum <- 'Estimates ('
mydum <- paste(mydum,j)
mydum <- paste(mydum,')')
a<-table.element(a,mydum, header=TRUE)
for (i in 1:ncols) {
a<-table.element(a,round(selection[[1]][j,i],4))
}
a<-table.row.end(a)
a<-table.row.start(a)
a<-table.element(a,'(p-val)', header=TRUE)
for (i in 1:ncols) {
mydum <- '('
mydum <- paste(mydum,round(selection[[2]][j,i],4),sep='')
mydum <- paste(mydum,')')
a<-table.element(a,mydum)
}
a<-table.row.end(a)
}
a<-table.end(a)
table.save(a,file='mytable.tab')
a<-table.start()
a<-table.row.start(a)
a<-table.element(a,'Estimated ARIMA Residuals', 1,TRUE)
a<-table.row.end(a)
a<-table.row.start(a)
a<-table.element(a,'Value', 1,TRUE)
a<-table.row.end(a)
for (i in (par4*par5+par3):length(resid)) {
a<-table.row.start(a)
a<-table.element(a,resid[i])
a<-table.row.end(a)
}
a<-table.end(a)
table.save(a,file='mytable1.tab')