Free Statistics

of Irreproducible Research!

Author's title

Author*The author of this computation has been verified*
R Software Modulerwasp_autocorrelation.wasp
Title produced by software(Partial) Autocorrelation Function
Date of computationSun, 14 Dec 2008 08:30:42 -0700
Cite this page as followsStatistical Computations at FreeStatistics.org, Office for Research Development and Education, URL https://freestatistics.org/blog/index.php?v=date/2008/Dec/14/t1229268714gy16ywx136fn6xz.htm/, Retrieved Wed, 15 May 2024 21:02:23 +0000
Statistical Computations at FreeStatistics.org, Office for Research Development and Education, URL https://freestatistics.org/blog/index.php?pk=33420, Retrieved Wed, 15 May 2024 21:02:23 +0000
QR Codes:

Original text written by user:
IsPrivate?No (this computation is public)
User-defined keywords
Estimated Impact146
Family? (F = Feedback message, R = changed R code, M = changed R Module, P = changed Parameters, D = changed Data)
-     [Standard Deviation-Mean Plot] [workshop] [2008-12-14 15:26:48] [3a9fc6d5b5e0e816787b7dbace57e7cd]
- RMP   [(Partial) Autocorrelation Function] [workshop] [2008-12-14 15:28:30] [3a9fc6d5b5e0e816787b7dbace57e7cd]
-   P       [(Partial) Autocorrelation Function] [workshop] [2008-12-14 15:30:42] [821c4b3d195be8e737cf8c9dc649d3cf] [Current]
Feedback Forum

Post a new message
Dataseries X:
2074
2049
2406
2558
2251
2059
2397
1747
1707
2319
1631
1627
1791
2034
1997
2169
2028
2253
2218
1855
2187
1852
1570
1851
1954
1828
2251
2277
2085
2282
2266
1878
2267
2069
1746
2299
2360
2214
2825
2355
2333
3016
2155
2172
2150
2533
2058
2160
2259
2498
2695
2799
2945
2930
2318
2540
2570
2669
2450
2842


Summary of computational transaction
Raw Inputview raw input (R code)
Raw Outputview raw output of R engine
Computing time4 seconds
R Server'Herman Ole Andreas Wold' @ 193.190.124.10:1001

\begin{tabular}{lllllllll}
\hline
Summary of computational transaction \tabularnewline
Raw Input & view raw input (R code)  \tabularnewline
Raw Output & view raw output of R engine  \tabularnewline
Computing time & 4 seconds \tabularnewline
R Server & 'Herman Ole Andreas Wold' @ 193.190.124.10:1001 \tabularnewline
\hline
\end{tabular}
%Source: https://freestatistics.org/blog/index.php?pk=33420&T=0

[TABLE]
[ROW][C]Summary of computational transaction[/C][/ROW]
[ROW][C]Raw Input[/C][C]view raw input (R code) [/C][/ROW]
[ROW][C]Raw Output[/C][C]view raw output of R engine [/C][/ROW]
[ROW][C]Computing time[/C][C]4 seconds[/C][/ROW]
[ROW][C]R Server[/C][C]'Herman Ole Andreas Wold' @ 193.190.124.10:1001[/C][/ROW]
[/TABLE]
Source: https://freestatistics.org/blog/index.php?pk=33420&T=0

Globally Unique Identifier (entire table): ba.freestatistics.org/blog/index.php?pk=33420&T=0

As an alternative you can also use a QR Code:  

The GUIDs for individual cells are displayed in the table below:

Summary of computational transaction
Raw Inputview raw input (R code)
Raw Outputview raw output of R engine
Computing time4 seconds
R Server'Herman Ole Andreas Wold' @ 193.190.124.10:1001


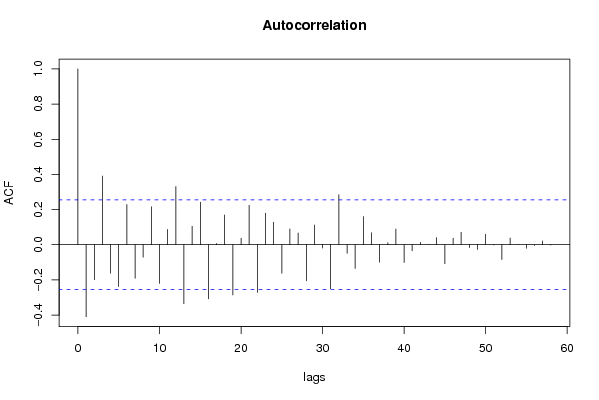
Autocorrelation Function
Time lag kACF(k)T-STATP-value
1-0.409202-3.14310.001308
2-0.199076-1.52910.065788
30.3909293.00280.00196
4-0.161997-1.24430.109151
5-0.238342-1.83070.036095
60.2283631.75410.042304
7-0.191392-1.47010.073422
8-0.07119-0.54680.293281
90.2159431.65870.051243
10-0.22059-1.69440.047732
110.0868660.66720.253612
120.3311382.54350.006807
13-0.335737-2.57880.006213
140.1047140.80430.21222
150.2423181.86130.033844
16-0.307904-2.36510.010667
170.0076360.05870.476712
180.1691311.29910.099478
19-0.285891-2.1960.016019
200.0363080.27890.390653
210.2239951.72050.045288
22-0.271355-2.08430.020735
230.1791481.37610.087002
240.1282350.9850.164324
25-0.162222-1.2460.108836
260.0901470.69240.245691
270.0662680.5090.306319
28-0.205461-1.57820.059936
290.1120130.86040.196528
30-0.018808-0.14450.442813
31-0.250705-1.92570.029483
320.2848722.18810.016316
33-0.048915-0.37570.354234
34-0.135018-1.03710.151962
350.1602791.23110.11158
360.0684450.52570.30052
37-0.099623-0.76520.223595
380.0118830.09130.46379
390.0888990.68280.248688
40-0.101148-0.77690.220152
41-0.03463-0.2660.395585
420.0140870.10820.4571
430.0011190.00860.496587
440.0409210.31430.377194
45-0.107636-0.82680.205851
460.0374610.28770.387277
470.0703840.54060.2954
48-0.01636-0.12570.450213
49-0.02707-0.20790.418001
500.0601060.46170.323004
51-0.001605-0.01230.495102
52-0.083818-0.64380.261095
530.0378190.29050.386229
540.0010030.00770.496939
55-0.019534-0.150.440621
56-0.004767-0.03660.485457
570.0218210.16760.433731
58-0.002259-0.01740.493108
59NANANA
60NANANA

\begin{tabular}{lllllllll}
\hline
Autocorrelation Function \tabularnewline
Time lag k & ACF(k) & T-STAT & P-value \tabularnewline
1 & -0.409202 & -3.1431 & 0.001308 \tabularnewline
2 & -0.199076 & -1.5291 & 0.065788 \tabularnewline
3 & 0.390929 & 3.0028 & 0.00196 \tabularnewline
4 & -0.161997 & -1.2443 & 0.109151 \tabularnewline
5 & -0.238342 & -1.8307 & 0.036095 \tabularnewline
6 & 0.228363 & 1.7541 & 0.042304 \tabularnewline
7 & -0.191392 & -1.4701 & 0.073422 \tabularnewline
8 & -0.07119 & -0.5468 & 0.293281 \tabularnewline
9 & 0.215943 & 1.6587 & 0.051243 \tabularnewline
10 & -0.22059 & -1.6944 & 0.047732 \tabularnewline
11 & 0.086866 & 0.6672 & 0.253612 \tabularnewline
12 & 0.331138 & 2.5435 & 0.006807 \tabularnewline
13 & -0.335737 & -2.5788 & 0.006213 \tabularnewline
14 & 0.104714 & 0.8043 & 0.21222 \tabularnewline
15 & 0.242318 & 1.8613 & 0.033844 \tabularnewline
16 & -0.307904 & -2.3651 & 0.010667 \tabularnewline
17 & 0.007636 & 0.0587 & 0.476712 \tabularnewline
18 & 0.169131 & 1.2991 & 0.099478 \tabularnewline
19 & -0.285891 & -2.196 & 0.016019 \tabularnewline
20 & 0.036308 & 0.2789 & 0.390653 \tabularnewline
21 & 0.223995 & 1.7205 & 0.045288 \tabularnewline
22 & -0.271355 & -2.0843 & 0.020735 \tabularnewline
23 & 0.179148 & 1.3761 & 0.087002 \tabularnewline
24 & 0.128235 & 0.985 & 0.164324 \tabularnewline
25 & -0.162222 & -1.246 & 0.108836 \tabularnewline
26 & 0.090147 & 0.6924 & 0.245691 \tabularnewline
27 & 0.066268 & 0.509 & 0.306319 \tabularnewline
28 & -0.205461 & -1.5782 & 0.059936 \tabularnewline
29 & 0.112013 & 0.8604 & 0.196528 \tabularnewline
30 & -0.018808 & -0.1445 & 0.442813 \tabularnewline
31 & -0.250705 & -1.9257 & 0.029483 \tabularnewline
32 & 0.284872 & 2.1881 & 0.016316 \tabularnewline
33 & -0.048915 & -0.3757 & 0.354234 \tabularnewline
34 & -0.135018 & -1.0371 & 0.151962 \tabularnewline
35 & 0.160279 & 1.2311 & 0.11158 \tabularnewline
36 & 0.068445 & 0.5257 & 0.30052 \tabularnewline
37 & -0.099623 & -0.7652 & 0.223595 \tabularnewline
38 & 0.011883 & 0.0913 & 0.46379 \tabularnewline
39 & 0.088899 & 0.6828 & 0.248688 \tabularnewline
40 & -0.101148 & -0.7769 & 0.220152 \tabularnewline
41 & -0.03463 & -0.266 & 0.395585 \tabularnewline
42 & 0.014087 & 0.1082 & 0.4571 \tabularnewline
43 & 0.001119 & 0.0086 & 0.496587 \tabularnewline
44 & 0.040921 & 0.3143 & 0.377194 \tabularnewline
45 & -0.107636 & -0.8268 & 0.205851 \tabularnewline
46 & 0.037461 & 0.2877 & 0.387277 \tabularnewline
47 & 0.070384 & 0.5406 & 0.2954 \tabularnewline
48 & -0.01636 & -0.1257 & 0.450213 \tabularnewline
49 & -0.02707 & -0.2079 & 0.418001 \tabularnewline
50 & 0.060106 & 0.4617 & 0.323004 \tabularnewline
51 & -0.001605 & -0.0123 & 0.495102 \tabularnewline
52 & -0.083818 & -0.6438 & 0.261095 \tabularnewline
53 & 0.037819 & 0.2905 & 0.386229 \tabularnewline
54 & 0.001003 & 0.0077 & 0.496939 \tabularnewline
55 & -0.019534 & -0.15 & 0.440621 \tabularnewline
56 & -0.004767 & -0.0366 & 0.485457 \tabularnewline
57 & 0.021821 & 0.1676 & 0.433731 \tabularnewline
58 & -0.002259 & -0.0174 & 0.493108 \tabularnewline
59 & NA & NA & NA \tabularnewline
60 & NA & NA & NA \tabularnewline
\hline
\end{tabular}
%Source: https://freestatistics.org/blog/index.php?pk=33420&T=1

[TABLE]
[ROW][C]Autocorrelation Function[/C][/ROW]
[ROW][C]Time lag k[/C][C]ACF(k)[/C][C]T-STAT[/C][C]P-value[/C][/ROW]
[ROW][C]1[/C][C]-0.409202[/C][C]-3.1431[/C][C]0.001308[/C][/ROW]
[ROW][C]2[/C][C]-0.199076[/C][C]-1.5291[/C][C]0.065788[/C][/ROW]
[ROW][C]3[/C][C]0.390929[/C][C]3.0028[/C][C]0.00196[/C][/ROW]
[ROW][C]4[/C][C]-0.161997[/C][C]-1.2443[/C][C]0.109151[/C][/ROW]
[ROW][C]5[/C][C]-0.238342[/C][C]-1.8307[/C][C]0.036095[/C][/ROW]
[ROW][C]6[/C][C]0.228363[/C][C]1.7541[/C][C]0.042304[/C][/ROW]
[ROW][C]7[/C][C]-0.191392[/C][C]-1.4701[/C][C]0.073422[/C][/ROW]
[ROW][C]8[/C][C]-0.07119[/C][C]-0.5468[/C][C]0.293281[/C][/ROW]
[ROW][C]9[/C][C]0.215943[/C][C]1.6587[/C][C]0.051243[/C][/ROW]
[ROW][C]10[/C][C]-0.22059[/C][C]-1.6944[/C][C]0.047732[/C][/ROW]
[ROW][C]11[/C][C]0.086866[/C][C]0.6672[/C][C]0.253612[/C][/ROW]
[ROW][C]12[/C][C]0.331138[/C][C]2.5435[/C][C]0.006807[/C][/ROW]
[ROW][C]13[/C][C]-0.335737[/C][C]-2.5788[/C][C]0.006213[/C][/ROW]
[ROW][C]14[/C][C]0.104714[/C][C]0.8043[/C][C]0.21222[/C][/ROW]
[ROW][C]15[/C][C]0.242318[/C][C]1.8613[/C][C]0.033844[/C][/ROW]
[ROW][C]16[/C][C]-0.307904[/C][C]-2.3651[/C][C]0.010667[/C][/ROW]
[ROW][C]17[/C][C]0.007636[/C][C]0.0587[/C][C]0.476712[/C][/ROW]
[ROW][C]18[/C][C]0.169131[/C][C]1.2991[/C][C]0.099478[/C][/ROW]
[ROW][C]19[/C][C]-0.285891[/C][C]-2.196[/C][C]0.016019[/C][/ROW]
[ROW][C]20[/C][C]0.036308[/C][C]0.2789[/C][C]0.390653[/C][/ROW]
[ROW][C]21[/C][C]0.223995[/C][C]1.7205[/C][C]0.045288[/C][/ROW]
[ROW][C]22[/C][C]-0.271355[/C][C]-2.0843[/C][C]0.020735[/C][/ROW]
[ROW][C]23[/C][C]0.179148[/C][C]1.3761[/C][C]0.087002[/C][/ROW]
[ROW][C]24[/C][C]0.128235[/C][C]0.985[/C][C]0.164324[/C][/ROW]
[ROW][C]25[/C][C]-0.162222[/C][C]-1.246[/C][C]0.108836[/C][/ROW]
[ROW][C]26[/C][C]0.090147[/C][C]0.6924[/C][C]0.245691[/C][/ROW]
[ROW][C]27[/C][C]0.066268[/C][C]0.509[/C][C]0.306319[/C][/ROW]
[ROW][C]28[/C][C]-0.205461[/C][C]-1.5782[/C][C]0.059936[/C][/ROW]
[ROW][C]29[/C][C]0.112013[/C][C]0.8604[/C][C]0.196528[/C][/ROW]
[ROW][C]30[/C][C]-0.018808[/C][C]-0.1445[/C][C]0.442813[/C][/ROW]
[ROW][C]31[/C][C]-0.250705[/C][C]-1.9257[/C][C]0.029483[/C][/ROW]
[ROW][C]32[/C][C]0.284872[/C][C]2.1881[/C][C]0.016316[/C][/ROW]
[ROW][C]33[/C][C]-0.048915[/C][C]-0.3757[/C][C]0.354234[/C][/ROW]
[ROW][C]34[/C][C]-0.135018[/C][C]-1.0371[/C][C]0.151962[/C][/ROW]
[ROW][C]35[/C][C]0.160279[/C][C]1.2311[/C][C]0.11158[/C][/ROW]
[ROW][C]36[/C][C]0.068445[/C][C]0.5257[/C][C]0.30052[/C][/ROW]
[ROW][C]37[/C][C]-0.099623[/C][C]-0.7652[/C][C]0.223595[/C][/ROW]
[ROW][C]38[/C][C]0.011883[/C][C]0.0913[/C][C]0.46379[/C][/ROW]
[ROW][C]39[/C][C]0.088899[/C][C]0.6828[/C][C]0.248688[/C][/ROW]
[ROW][C]40[/C][C]-0.101148[/C][C]-0.7769[/C][C]0.220152[/C][/ROW]
[ROW][C]41[/C][C]-0.03463[/C][C]-0.266[/C][C]0.395585[/C][/ROW]
[ROW][C]42[/C][C]0.014087[/C][C]0.1082[/C][C]0.4571[/C][/ROW]
[ROW][C]43[/C][C]0.001119[/C][C]0.0086[/C][C]0.496587[/C][/ROW]
[ROW][C]44[/C][C]0.040921[/C][C]0.3143[/C][C]0.377194[/C][/ROW]
[ROW][C]45[/C][C]-0.107636[/C][C]-0.8268[/C][C]0.205851[/C][/ROW]
[ROW][C]46[/C][C]0.037461[/C][C]0.2877[/C][C]0.387277[/C][/ROW]
[ROW][C]47[/C][C]0.070384[/C][C]0.5406[/C][C]0.2954[/C][/ROW]
[ROW][C]48[/C][C]-0.01636[/C][C]-0.1257[/C][C]0.450213[/C][/ROW]
[ROW][C]49[/C][C]-0.02707[/C][C]-0.2079[/C][C]0.418001[/C][/ROW]
[ROW][C]50[/C][C]0.060106[/C][C]0.4617[/C][C]0.323004[/C][/ROW]
[ROW][C]51[/C][C]-0.001605[/C][C]-0.0123[/C][C]0.495102[/C][/ROW]
[ROW][C]52[/C][C]-0.083818[/C][C]-0.6438[/C][C]0.261095[/C][/ROW]
[ROW][C]53[/C][C]0.037819[/C][C]0.2905[/C][C]0.386229[/C][/ROW]
[ROW][C]54[/C][C]0.001003[/C][C]0.0077[/C][C]0.496939[/C][/ROW]
[ROW][C]55[/C][C]-0.019534[/C][C]-0.15[/C][C]0.440621[/C][/ROW]
[ROW][C]56[/C][C]-0.004767[/C][C]-0.0366[/C][C]0.485457[/C][/ROW]
[ROW][C]57[/C][C]0.021821[/C][C]0.1676[/C][C]0.433731[/C][/ROW]
[ROW][C]58[/C][C]-0.002259[/C][C]-0.0174[/C][C]0.493108[/C][/ROW]
[ROW][C]59[/C][C]NA[/C][C]NA[/C][C]NA[/C][/ROW]
[ROW][C]60[/C][C]NA[/C][C]NA[/C][C]NA[/C][/ROW]
[/TABLE]
Source: https://freestatistics.org/blog/index.php?pk=33420&T=1

Globally Unique Identifier (entire table): ba.freestatistics.org/blog/index.php?pk=33420&T=1

As an alternative you can also use a QR Code:  

The GUIDs for individual cells are displayed in the table below:

Autocorrelation Function
Time lag kACF(k)T-STATP-value
1-0.409202-3.14310.001308
2-0.199076-1.52910.065788
30.3909293.00280.00196
4-0.161997-1.24430.109151
5-0.238342-1.83070.036095
60.2283631.75410.042304
7-0.191392-1.47010.073422
8-0.07119-0.54680.293281
90.2159431.65870.051243
10-0.22059-1.69440.047732
110.0868660.66720.253612
120.3311382.54350.006807
13-0.335737-2.57880.006213
140.1047140.80430.21222
150.2423181.86130.033844
16-0.307904-2.36510.010667
170.0076360.05870.476712
180.1691311.29910.099478
19-0.285891-2.1960.016019
200.0363080.27890.390653
210.2239951.72050.045288
22-0.271355-2.08430.020735
230.1791481.37610.087002
240.1282350.9850.164324
25-0.162222-1.2460.108836
260.0901470.69240.245691
270.0662680.5090.306319
28-0.205461-1.57820.059936
290.1120130.86040.196528
30-0.018808-0.14450.442813
31-0.250705-1.92570.029483
320.2848722.18810.016316
33-0.048915-0.37570.354234
34-0.135018-1.03710.151962
350.1602791.23110.11158
360.0684450.52570.30052
37-0.099623-0.76520.223595
380.0118830.09130.46379
390.0888990.68280.248688
40-0.101148-0.77690.220152
41-0.03463-0.2660.395585
420.0140870.10820.4571
430.0011190.00860.496587
440.0409210.31430.377194
45-0.107636-0.82680.205851
460.0374610.28770.387277
470.0703840.54060.2954
48-0.01636-0.12570.450213
49-0.02707-0.20790.418001
500.0601060.46170.323004
51-0.001605-0.01230.495102
52-0.083818-0.64380.261095
530.0378190.29050.386229
540.0010030.00770.496939
55-0.019534-0.150.440621
56-0.004767-0.03660.485457
570.0218210.16760.433731
58-0.002259-0.01740.493108
59NANANA
60NANANA


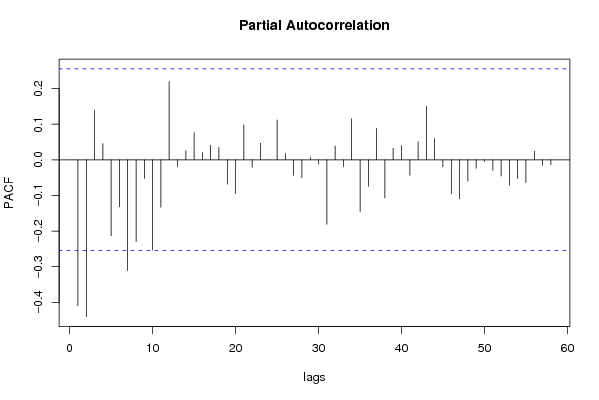
Partial Autocorrelation Function
Time lag kPACF(k)T-STATP-value
1-0.409202-3.14310.001308
2-0.440238-3.38150.000642
30.139241.06950.144595
40.0457410.35130.363293
5-0.213236-1.63790.053383
6-0.131802-1.01240.157743
7-0.310906-2.38810.010077
8-0.229277-1.76110.0417
9-0.051746-0.39750.34623
10-0.253274-1.94540.028246
11-0.13297-1.02140.155626
120.2193481.68480.048651
13-0.019433-0.14930.440926
140.0253250.19450.423218
150.0763590.58650.27988
160.0209320.16080.436406
170.0407710.31320.377629
180.0351080.26970.394178
19-0.068449-0.52580.300512
20-0.094471-0.72560.235463
210.0981510.75390.226949
22-0.020585-0.15810.437452
230.0465650.35770.360933
240.0001078e-040.499673
250.1121160.86120.196313
260.0180930.1390.44497
27-0.043399-0.33340.370024
28-0.049672-0.38150.352088
290.006620.05080.47981
30-0.011728-0.09010.464261
31-0.181171-1.39160.084634
320.038760.29770.383482
33-0.019557-0.15020.440552
340.1151570.88450.189999
35-0.144816-1.11230.13525
36-0.073907-0.56770.286199
370.088270.6780.250206
38-0.107386-0.82480.20639
390.0323620.24860.402276
400.0400010.30730.379865
41-0.043017-0.33040.371128
420.0505330.38810.349652
430.1504261.15540.126284
440.0594490.45660.324804
45-0.019535-0.15010.440618
46-0.095281-0.73190.233574
47-0.10937-0.84010.202126
48-0.060026-0.46110.323223
49-0.023893-0.18350.427507
50-0.003939-0.03030.487981
51-0.029473-0.22640.410842
52-0.045631-0.35050.363608
53-0.070713-0.54320.294534
54-0.052597-0.4040.343834
55-0.063904-0.49090.312675
560.0243730.18720.42607
57-0.015109-0.11610.454002
58-0.013988-0.10740.4574
59NANANA
60NANANA

\begin{tabular}{lllllllll}
\hline
Partial Autocorrelation Function \tabularnewline
Time lag k & PACF(k) & T-STAT & P-value \tabularnewline
1 & -0.409202 & -3.1431 & 0.001308 \tabularnewline
2 & -0.440238 & -3.3815 & 0.000642 \tabularnewline
3 & 0.13924 & 1.0695 & 0.144595 \tabularnewline
4 & 0.045741 & 0.3513 & 0.363293 \tabularnewline
5 & -0.213236 & -1.6379 & 0.053383 \tabularnewline
6 & -0.131802 & -1.0124 & 0.157743 \tabularnewline
7 & -0.310906 & -2.3881 & 0.010077 \tabularnewline
8 & -0.229277 & -1.7611 & 0.0417 \tabularnewline
9 & -0.051746 & -0.3975 & 0.34623 \tabularnewline
10 & -0.253274 & -1.9454 & 0.028246 \tabularnewline
11 & -0.13297 & -1.0214 & 0.155626 \tabularnewline
12 & 0.219348 & 1.6848 & 0.048651 \tabularnewline
13 & -0.019433 & -0.1493 & 0.440926 \tabularnewline
14 & 0.025325 & 0.1945 & 0.423218 \tabularnewline
15 & 0.076359 & 0.5865 & 0.27988 \tabularnewline
16 & 0.020932 & 0.1608 & 0.436406 \tabularnewline
17 & 0.040771 & 0.3132 & 0.377629 \tabularnewline
18 & 0.035108 & 0.2697 & 0.394178 \tabularnewline
19 & -0.068449 & -0.5258 & 0.300512 \tabularnewline
20 & -0.094471 & -0.7256 & 0.235463 \tabularnewline
21 & 0.098151 & 0.7539 & 0.226949 \tabularnewline
22 & -0.020585 & -0.1581 & 0.437452 \tabularnewline
23 & 0.046565 & 0.3577 & 0.360933 \tabularnewline
24 & 0.000107 & 8e-04 & 0.499673 \tabularnewline
25 & 0.112116 & 0.8612 & 0.196313 \tabularnewline
26 & 0.018093 & 0.139 & 0.44497 \tabularnewline
27 & -0.043399 & -0.3334 & 0.370024 \tabularnewline
28 & -0.049672 & -0.3815 & 0.352088 \tabularnewline
29 & 0.00662 & 0.0508 & 0.47981 \tabularnewline
30 & -0.011728 & -0.0901 & 0.464261 \tabularnewline
31 & -0.181171 & -1.3916 & 0.084634 \tabularnewline
32 & 0.03876 & 0.2977 & 0.383482 \tabularnewline
33 & -0.019557 & -0.1502 & 0.440552 \tabularnewline
34 & 0.115157 & 0.8845 & 0.189999 \tabularnewline
35 & -0.144816 & -1.1123 & 0.13525 \tabularnewline
36 & -0.073907 & -0.5677 & 0.286199 \tabularnewline
37 & 0.08827 & 0.678 & 0.250206 \tabularnewline
38 & -0.107386 & -0.8248 & 0.20639 \tabularnewline
39 & 0.032362 & 0.2486 & 0.402276 \tabularnewline
40 & 0.040001 & 0.3073 & 0.379865 \tabularnewline
41 & -0.043017 & -0.3304 & 0.371128 \tabularnewline
42 & 0.050533 & 0.3881 & 0.349652 \tabularnewline
43 & 0.150426 & 1.1554 & 0.126284 \tabularnewline
44 & 0.059449 & 0.4566 & 0.324804 \tabularnewline
45 & -0.019535 & -0.1501 & 0.440618 \tabularnewline
46 & -0.095281 & -0.7319 & 0.233574 \tabularnewline
47 & -0.10937 & -0.8401 & 0.202126 \tabularnewline
48 & -0.060026 & -0.4611 & 0.323223 \tabularnewline
49 & -0.023893 & -0.1835 & 0.427507 \tabularnewline
50 & -0.003939 & -0.0303 & 0.487981 \tabularnewline
51 & -0.029473 & -0.2264 & 0.410842 \tabularnewline
52 & -0.045631 & -0.3505 & 0.363608 \tabularnewline
53 & -0.070713 & -0.5432 & 0.294534 \tabularnewline
54 & -0.052597 & -0.404 & 0.343834 \tabularnewline
55 & -0.063904 & -0.4909 & 0.312675 \tabularnewline
56 & 0.024373 & 0.1872 & 0.42607 \tabularnewline
57 & -0.015109 & -0.1161 & 0.454002 \tabularnewline
58 & -0.013988 & -0.1074 & 0.4574 \tabularnewline
59 & NA & NA & NA \tabularnewline
60 & NA & NA & NA \tabularnewline
\hline
\end{tabular}
%Source: https://freestatistics.org/blog/index.php?pk=33420&T=2

[TABLE]
[ROW][C]Partial Autocorrelation Function[/C][/ROW]
[ROW][C]Time lag k[/C][C]PACF(k)[/C][C]T-STAT[/C][C]P-value[/C][/ROW]
[ROW][C]1[/C][C]-0.409202[/C][C]-3.1431[/C][C]0.001308[/C][/ROW]
[ROW][C]2[/C][C]-0.440238[/C][C]-3.3815[/C][C]0.000642[/C][/ROW]
[ROW][C]3[/C][C]0.13924[/C][C]1.0695[/C][C]0.144595[/C][/ROW]
[ROW][C]4[/C][C]0.045741[/C][C]0.3513[/C][C]0.363293[/C][/ROW]
[ROW][C]5[/C][C]-0.213236[/C][C]-1.6379[/C][C]0.053383[/C][/ROW]
[ROW][C]6[/C][C]-0.131802[/C][C]-1.0124[/C][C]0.157743[/C][/ROW]
[ROW][C]7[/C][C]-0.310906[/C][C]-2.3881[/C][C]0.010077[/C][/ROW]
[ROW][C]8[/C][C]-0.229277[/C][C]-1.7611[/C][C]0.0417[/C][/ROW]
[ROW][C]9[/C][C]-0.051746[/C][C]-0.3975[/C][C]0.34623[/C][/ROW]
[ROW][C]10[/C][C]-0.253274[/C][C]-1.9454[/C][C]0.028246[/C][/ROW]
[ROW][C]11[/C][C]-0.13297[/C][C]-1.0214[/C][C]0.155626[/C][/ROW]
[ROW][C]12[/C][C]0.219348[/C][C]1.6848[/C][C]0.048651[/C][/ROW]
[ROW][C]13[/C][C]-0.019433[/C][C]-0.1493[/C][C]0.440926[/C][/ROW]
[ROW][C]14[/C][C]0.025325[/C][C]0.1945[/C][C]0.423218[/C][/ROW]
[ROW][C]15[/C][C]0.076359[/C][C]0.5865[/C][C]0.27988[/C][/ROW]
[ROW][C]16[/C][C]0.020932[/C][C]0.1608[/C][C]0.436406[/C][/ROW]
[ROW][C]17[/C][C]0.040771[/C][C]0.3132[/C][C]0.377629[/C][/ROW]
[ROW][C]18[/C][C]0.035108[/C][C]0.2697[/C][C]0.394178[/C][/ROW]
[ROW][C]19[/C][C]-0.068449[/C][C]-0.5258[/C][C]0.300512[/C][/ROW]
[ROW][C]20[/C][C]-0.094471[/C][C]-0.7256[/C][C]0.235463[/C][/ROW]
[ROW][C]21[/C][C]0.098151[/C][C]0.7539[/C][C]0.226949[/C][/ROW]
[ROW][C]22[/C][C]-0.020585[/C][C]-0.1581[/C][C]0.437452[/C][/ROW]
[ROW][C]23[/C][C]0.046565[/C][C]0.3577[/C][C]0.360933[/C][/ROW]
[ROW][C]24[/C][C]0.000107[/C][C]8e-04[/C][C]0.499673[/C][/ROW]
[ROW][C]25[/C][C]0.112116[/C][C]0.8612[/C][C]0.196313[/C][/ROW]
[ROW][C]26[/C][C]0.018093[/C][C]0.139[/C][C]0.44497[/C][/ROW]
[ROW][C]27[/C][C]-0.043399[/C][C]-0.3334[/C][C]0.370024[/C][/ROW]
[ROW][C]28[/C][C]-0.049672[/C][C]-0.3815[/C][C]0.352088[/C][/ROW]
[ROW][C]29[/C][C]0.00662[/C][C]0.0508[/C][C]0.47981[/C][/ROW]
[ROW][C]30[/C][C]-0.011728[/C][C]-0.0901[/C][C]0.464261[/C][/ROW]
[ROW][C]31[/C][C]-0.181171[/C][C]-1.3916[/C][C]0.084634[/C][/ROW]
[ROW][C]32[/C][C]0.03876[/C][C]0.2977[/C][C]0.383482[/C][/ROW]
[ROW][C]33[/C][C]-0.019557[/C][C]-0.1502[/C][C]0.440552[/C][/ROW]
[ROW][C]34[/C][C]0.115157[/C][C]0.8845[/C][C]0.189999[/C][/ROW]
[ROW][C]35[/C][C]-0.144816[/C][C]-1.1123[/C][C]0.13525[/C][/ROW]
[ROW][C]36[/C][C]-0.073907[/C][C]-0.5677[/C][C]0.286199[/C][/ROW]
[ROW][C]37[/C][C]0.08827[/C][C]0.678[/C][C]0.250206[/C][/ROW]
[ROW][C]38[/C][C]-0.107386[/C][C]-0.8248[/C][C]0.20639[/C][/ROW]
[ROW][C]39[/C][C]0.032362[/C][C]0.2486[/C][C]0.402276[/C][/ROW]
[ROW][C]40[/C][C]0.040001[/C][C]0.3073[/C][C]0.379865[/C][/ROW]
[ROW][C]41[/C][C]-0.043017[/C][C]-0.3304[/C][C]0.371128[/C][/ROW]
[ROW][C]42[/C][C]0.050533[/C][C]0.3881[/C][C]0.349652[/C][/ROW]
[ROW][C]43[/C][C]0.150426[/C][C]1.1554[/C][C]0.126284[/C][/ROW]
[ROW][C]44[/C][C]0.059449[/C][C]0.4566[/C][C]0.324804[/C][/ROW]
[ROW][C]45[/C][C]-0.019535[/C][C]-0.1501[/C][C]0.440618[/C][/ROW]
[ROW][C]46[/C][C]-0.095281[/C][C]-0.7319[/C][C]0.233574[/C][/ROW]
[ROW][C]47[/C][C]-0.10937[/C][C]-0.8401[/C][C]0.202126[/C][/ROW]
[ROW][C]48[/C][C]-0.060026[/C][C]-0.4611[/C][C]0.323223[/C][/ROW]
[ROW][C]49[/C][C]-0.023893[/C][C]-0.1835[/C][C]0.427507[/C][/ROW]
[ROW][C]50[/C][C]-0.003939[/C][C]-0.0303[/C][C]0.487981[/C][/ROW]
[ROW][C]51[/C][C]-0.029473[/C][C]-0.2264[/C][C]0.410842[/C][/ROW]
[ROW][C]52[/C][C]-0.045631[/C][C]-0.3505[/C][C]0.363608[/C][/ROW]
[ROW][C]53[/C][C]-0.070713[/C][C]-0.5432[/C][C]0.294534[/C][/ROW]
[ROW][C]54[/C][C]-0.052597[/C][C]-0.404[/C][C]0.343834[/C][/ROW]
[ROW][C]55[/C][C]-0.063904[/C][C]-0.4909[/C][C]0.312675[/C][/ROW]
[ROW][C]56[/C][C]0.024373[/C][C]0.1872[/C][C]0.42607[/C][/ROW]
[ROW][C]57[/C][C]-0.015109[/C][C]-0.1161[/C][C]0.454002[/C][/ROW]
[ROW][C]58[/C][C]-0.013988[/C][C]-0.1074[/C][C]0.4574[/C][/ROW]
[ROW][C]59[/C][C]NA[/C][C]NA[/C][C]NA[/C][/ROW]
[ROW][C]60[/C][C]NA[/C][C]NA[/C][C]NA[/C][/ROW]
[/TABLE]
Source: https://freestatistics.org/blog/index.php?pk=33420&T=2

Globally Unique Identifier (entire table): ba.freestatistics.org/blog/index.php?pk=33420&T=2

As an alternative you can also use a QR Code:  

The GUIDs for individual cells are displayed in the table below:

Partial Autocorrelation Function
Time lag kPACF(k)T-STATP-value
1-0.409202-3.14310.001308
2-0.440238-3.38150.000642
30.139241.06950.144595
40.0457410.35130.363293
5-0.213236-1.63790.053383
6-0.131802-1.01240.157743
7-0.310906-2.38810.010077
8-0.229277-1.76110.0417
9-0.051746-0.39750.34623
10-0.253274-1.94540.028246
11-0.13297-1.02140.155626
120.2193481.68480.048651
13-0.019433-0.14930.440926
140.0253250.19450.423218
150.0763590.58650.27988
160.0209320.16080.436406
170.0407710.31320.377629
180.0351080.26970.394178
19-0.068449-0.52580.300512
20-0.094471-0.72560.235463
210.0981510.75390.226949
22-0.020585-0.15810.437452
230.0465650.35770.360933
240.0001078e-040.499673
250.1121160.86120.196313
260.0180930.1390.44497
27-0.043399-0.33340.370024
28-0.049672-0.38150.352088
290.006620.05080.47981
30-0.011728-0.09010.464261
31-0.181171-1.39160.084634
320.038760.29770.383482
33-0.019557-0.15020.440552
340.1151570.88450.189999
35-0.144816-1.11230.13525
36-0.073907-0.56770.286199
370.088270.6780.250206
38-0.107386-0.82480.20639
390.0323620.24860.402276
400.0400010.30730.379865
41-0.043017-0.33040.371128
420.0505330.38810.349652
430.1504261.15540.126284
440.0594490.45660.324804
45-0.019535-0.15010.440618
46-0.095281-0.73190.233574
47-0.10937-0.84010.202126
48-0.060026-0.46110.323223
49-0.023893-0.18350.427507
50-0.003939-0.03030.487981
51-0.029473-0.22640.410842
52-0.045631-0.35050.363608
53-0.070713-0.54320.294534
54-0.052597-0.4040.343834
55-0.063904-0.49090.312675
560.0243730.18720.42607
57-0.015109-0.11610.454002
58-0.013988-0.10740.4574
59NANANA
60NANANA


Parameters (Session):
par1 = 60 ; par2 = 1 ; par3 = 1 ; par4 = 0 ; par5 = 12 ;
Parameters (R input):
par1 = 60 ; par2 = 1 ; par3 = 1 ; par4 = 0 ; par5 = 12 ;
R code (references can be found in the software module):
if (par1 == 'Default') {
par1 = 10*log10(length(x))
} else {
par1 <- as.numeric(par1)
}
par2 <- as.numeric(par2)
par3 <- as.numeric(par3)
par4 <- as.numeric(par4)
par5 <- as.numeric(par5)
if (par2 == 0) {
x <- log(x)
} else {
x <- (x ^ par2 - 1) / par2
}
if (par3 > 0) x <- diff(x,lag=1,difference=par3)
if (par4 > 0) x <- diff(x,lag=par5,difference=par4)
bitmap(file='pic1.png')
racf <- acf(x,par1,main='Autocorrelation',xlab='lags',ylab='ACF')
dev.off()
bitmap(file='pic2.png')
rpacf <- pacf(x,par1,main='Partial Autocorrelation',xlab='lags',ylab='PACF')
dev.off()
(myacf <- c(racf$acf))
(mypacf <- c(rpacf$acf))
lengthx <- length(x)
sqrtn <- sqrt(lengthx)
load(file='createtable')
a<-table.start()
a<-table.row.start(a)
a<-table.element(a,'Autocorrelation Function',4,TRUE)
a<-table.row.end(a)
a<-table.row.start(a)
a<-table.element(a,'Time lag k',header=TRUE)
a<-table.element(a,hyperlink('basics.htm','ACF(k)','click here for more information about the Autocorrelation Function'),header=TRUE)
a<-table.element(a,'T-STAT',header=TRUE)
a<-table.element(a,'P-value',header=TRUE)
a<-table.row.end(a)
for (i in 2:(par1+1)) {
a<-table.row.start(a)
a<-table.element(a,i-1,header=TRUE)
a<-table.element(a,round(myacf[i],6))
mytstat <- myacf[i]*sqrtn
a<-table.element(a,round(mytstat,4))
a<-table.element(a,round(1-pt(abs(mytstat),lengthx),6))
a<-table.row.end(a)
}
a<-table.end(a)
table.save(a,file='mytable.tab')
a<-table.start()
a<-table.row.start(a)
a<-table.element(a,'Partial Autocorrelation Function',4,TRUE)
a<-table.row.end(a)
a<-table.row.start(a)
a<-table.element(a,'Time lag k',header=TRUE)
a<-table.element(a,hyperlink('basics.htm','PACF(k)','click here for more information about the Partial Autocorrelation Function'),header=TRUE)
a<-table.element(a,'T-STAT',header=TRUE)
a<-table.element(a,'P-value',header=TRUE)
a<-table.row.end(a)
for (i in 1:par1) {
a<-table.row.start(a)
a<-table.element(a,i,header=TRUE)
a<-table.element(a,round(mypacf[i],6))
mytstat <- mypacf[i]*sqrtn
a<-table.element(a,round(mytstat,4))
a<-table.element(a,round(1-pt(abs(mytstat),lengthx),6))
a<-table.row.end(a)
}
a<-table.end(a)
table.save(a,file='mytable1.tab')