Free Statistics

of Irreproducible Research!

Author's title

Author*The author of this computation has been verified*
R Software Modulerwasp_autocorrelation.wasp
Title produced by software(Partial) Autocorrelation Function
Date of computationSun, 14 Dec 2008 08:28:30 -0700
Cite this page as followsStatistical Computations at FreeStatistics.org, Office for Research Development and Education, URL https://freestatistics.org/blog/index.php?v=date/2008/Dec/14/t12292685773ku0sneo41zf4h1.htm/, Retrieved Wed, 15 May 2024 04:56:11 +0000
Statistical Computations at FreeStatistics.org, Office for Research Development and Education, URL https://freestatistics.org/blog/index.php?pk=33419, Retrieved Wed, 15 May 2024 04:56:11 +0000
QR Codes:

Original text written by user:
IsPrivate?No (this computation is public)
User-defined keywords
Estimated Impact156
Family? (F = Feedback message, R = changed R code, M = changed R Module, P = changed Parameters, D = changed Data)
-     [Standard Deviation-Mean Plot] [workshop] [2008-12-14 15:26:48] [3a9fc6d5b5e0e816787b7dbace57e7cd]
- RMP     [(Partial) Autocorrelation Function] [workshop] [2008-12-14 15:28:30] [821c4b3d195be8e737cf8c9dc649d3cf] [Current]
-   P       [(Partial) Autocorrelation Function] [workshop] [2008-12-14 15:30:42] [3a9fc6d5b5e0e816787b7dbace57e7cd]
Feedback Forum

Post a new message
Dataseries X:
2074
2049
2406
2558
2251
2059
2397
1747
1707
2319
1631
1627
1791
2034
1997
2169
2028
2253
2218
1855
2187
1852
1570
1851
1954
1828
2251
2277
2085
2282
2266
1878
2267
2069
1746
2299
2360
2214
2825
2355
2333
3016
2155
2172
2150
2533
2058
2160
2259
2498
2695
2799
2945
2930
2318
2540
2570
2669
2450
2842


Summary of computational transaction
Raw Inputview raw input (R code)
Raw Outputview raw output of R engine
Computing time3 seconds
R Server'Herman Ole Andreas Wold' @ 193.190.124.10:1001

\begin{tabular}{lllllllll}
\hline
Summary of computational transaction \tabularnewline
Raw Input & view raw input (R code)  \tabularnewline
Raw Output & view raw output of R engine  \tabularnewline
Computing time & 3 seconds \tabularnewline
R Server & 'Herman Ole Andreas Wold' @ 193.190.124.10:1001 \tabularnewline
\hline
\end{tabular}
%Source: https://freestatistics.org/blog/index.php?pk=33419&T=0

[TABLE]
[ROW][C]Summary of computational transaction[/C][/ROW]
[ROW][C]Raw Input[/C][C]view raw input (R code) [/C][/ROW]
[ROW][C]Raw Output[/C][C]view raw output of R engine [/C][/ROW]
[ROW][C]Computing time[/C][C]3 seconds[/C][/ROW]
[ROW][C]R Server[/C][C]'Herman Ole Andreas Wold' @ 193.190.124.10:1001[/C][/ROW]
[/TABLE]
Source: https://freestatistics.org/blog/index.php?pk=33419&T=0

Globally Unique Identifier (entire table): ba.freestatistics.org/blog/index.php?pk=33419&T=0

As an alternative you can also use a QR Code:  

The GUIDs for individual cells are displayed in the table below:

Summary of computational transaction
Raw Inputview raw input (R code)
Raw Outputview raw output of R engine
Computing time3 seconds
R Server'Herman Ole Andreas Wold' @ 193.190.124.10:1001


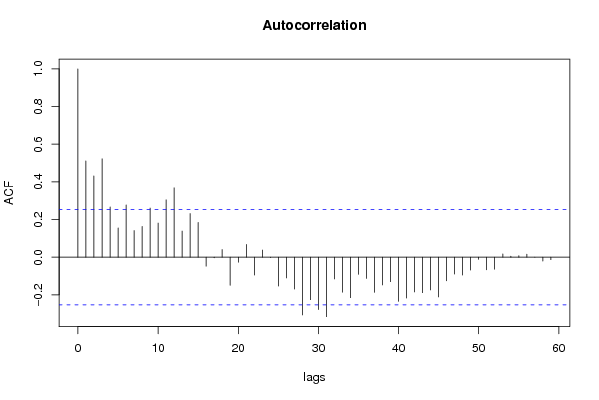
Autocorrelation Function
Time lag kACF(k)T-STATP-value
10.5113563.96091e-04
20.4317443.34430.000713
30.522934.05067.4e-05
40.2672042.06970.021395
50.1554251.20390.116675
60.2772432.14750.017901
70.1416391.09710.138484
80.1636161.26740.104961
90.2607352.01960.023947
100.1814151.40520.082555
110.3049282.3620.01072
120.3682682.85260.00297
130.1389711.07650.143015
140.2319741.79690.038696
150.1846811.43050.078875
16-0.047764-0.370.356352
17-0.003233-0.0250.490053
180.0405450.31410.377281
19-0.14978-1.16020.125283
20-0.026645-0.20640.418592
210.0677640.52490.300793
22-0.094794-0.73430.232822
230.037810.29290.385316
24-0.002266-0.01760.493026
25-0.15364-1.19010.119349
26-0.110437-0.85540.197854
27-0.169472-1.31270.097137
28-0.306917-2.37740.010321
29-0.225881-1.74970.042644
30-0.278299-2.15570.017564
31-0.315979-2.44760.008663
32-0.115802-0.8970.186653
33-0.186332-1.44330.077065
34-0.215187-1.66680.05038
35-0.090825-0.70350.242224
36-0.112714-0.87310.19305
37-0.186915-1.44780.076434
38-0.14774-1.14440.128504
39-0.129963-1.00670.159063
40-0.234474-1.81620.037166
41-0.217338-1.68350.048738
42-0.184858-1.43190.07868
43-0.188697-1.46160.074529
44-0.174077-1.34840.0913
45-0.211089-1.63510.053633
46-0.125675-0.97350.167112
47-0.089532-0.69350.245333
48-0.094727-0.73380.232978
49-0.068198-0.52830.299634
50-0.011442-0.08860.464837
51-0.066833-0.51770.30329
52-0.063549-0.49230.312169
530.017370.13450.446711
540.0054850.04250.483125
550.008160.06320.474907
560.0159190.12330.451137
570.0002410.00190.499257
58-0.02074-0.16060.436454
59-0.013609-0.10540.458199
60NANANA

\begin{tabular}{lllllllll}
\hline
Autocorrelation Function \tabularnewline
Time lag k & ACF(k) & T-STAT & P-value \tabularnewline
1 & 0.511356 & 3.9609 & 1e-04 \tabularnewline
2 & 0.431744 & 3.3443 & 0.000713 \tabularnewline
3 & 0.52293 & 4.0506 & 7.4e-05 \tabularnewline
4 & 0.267204 & 2.0697 & 0.021395 \tabularnewline
5 & 0.155425 & 1.2039 & 0.116675 \tabularnewline
6 & 0.277243 & 2.1475 & 0.017901 \tabularnewline
7 & 0.141639 & 1.0971 & 0.138484 \tabularnewline
8 & 0.163616 & 1.2674 & 0.104961 \tabularnewline
9 & 0.260735 & 2.0196 & 0.023947 \tabularnewline
10 & 0.181415 & 1.4052 & 0.082555 \tabularnewline
11 & 0.304928 & 2.362 & 0.01072 \tabularnewline
12 & 0.368268 & 2.8526 & 0.00297 \tabularnewline
13 & 0.138971 & 1.0765 & 0.143015 \tabularnewline
14 & 0.231974 & 1.7969 & 0.038696 \tabularnewline
15 & 0.184681 & 1.4305 & 0.078875 \tabularnewline
16 & -0.047764 & -0.37 & 0.356352 \tabularnewline
17 & -0.003233 & -0.025 & 0.490053 \tabularnewline
18 & 0.040545 & 0.3141 & 0.377281 \tabularnewline
19 & -0.14978 & -1.1602 & 0.125283 \tabularnewline
20 & -0.026645 & -0.2064 & 0.418592 \tabularnewline
21 & 0.067764 & 0.5249 & 0.300793 \tabularnewline
22 & -0.094794 & -0.7343 & 0.232822 \tabularnewline
23 & 0.03781 & 0.2929 & 0.385316 \tabularnewline
24 & -0.002266 & -0.0176 & 0.493026 \tabularnewline
25 & -0.15364 & -1.1901 & 0.119349 \tabularnewline
26 & -0.110437 & -0.8554 & 0.197854 \tabularnewline
27 & -0.169472 & -1.3127 & 0.097137 \tabularnewline
28 & -0.306917 & -2.3774 & 0.010321 \tabularnewline
29 & -0.225881 & -1.7497 & 0.042644 \tabularnewline
30 & -0.278299 & -2.1557 & 0.017564 \tabularnewline
31 & -0.315979 & -2.4476 & 0.008663 \tabularnewline
32 & -0.115802 & -0.897 & 0.186653 \tabularnewline
33 & -0.186332 & -1.4433 & 0.077065 \tabularnewline
34 & -0.215187 & -1.6668 & 0.05038 \tabularnewline
35 & -0.090825 & -0.7035 & 0.242224 \tabularnewline
36 & -0.112714 & -0.8731 & 0.19305 \tabularnewline
37 & -0.186915 & -1.4478 & 0.076434 \tabularnewline
38 & -0.14774 & -1.1444 & 0.128504 \tabularnewline
39 & -0.129963 & -1.0067 & 0.159063 \tabularnewline
40 & -0.234474 & -1.8162 & 0.037166 \tabularnewline
41 & -0.217338 & -1.6835 & 0.048738 \tabularnewline
42 & -0.184858 & -1.4319 & 0.07868 \tabularnewline
43 & -0.188697 & -1.4616 & 0.074529 \tabularnewline
44 & -0.174077 & -1.3484 & 0.0913 \tabularnewline
45 & -0.211089 & -1.6351 & 0.053633 \tabularnewline
46 & -0.125675 & -0.9735 & 0.167112 \tabularnewline
47 & -0.089532 & -0.6935 & 0.245333 \tabularnewline
48 & -0.094727 & -0.7338 & 0.232978 \tabularnewline
49 & -0.068198 & -0.5283 & 0.299634 \tabularnewline
50 & -0.011442 & -0.0886 & 0.464837 \tabularnewline
51 & -0.066833 & -0.5177 & 0.30329 \tabularnewline
52 & -0.063549 & -0.4923 & 0.312169 \tabularnewline
53 & 0.01737 & 0.1345 & 0.446711 \tabularnewline
54 & 0.005485 & 0.0425 & 0.483125 \tabularnewline
55 & 0.00816 & 0.0632 & 0.474907 \tabularnewline
56 & 0.015919 & 0.1233 & 0.451137 \tabularnewline
57 & 0.000241 & 0.0019 & 0.499257 \tabularnewline
58 & -0.02074 & -0.1606 & 0.436454 \tabularnewline
59 & -0.013609 & -0.1054 & 0.458199 \tabularnewline
60 & NA & NA & NA \tabularnewline
\hline
\end{tabular}
%Source: https://freestatistics.org/blog/index.php?pk=33419&T=1

[TABLE]
[ROW][C]Autocorrelation Function[/C][/ROW]
[ROW][C]Time lag k[/C][C]ACF(k)[/C][C]T-STAT[/C][C]P-value[/C][/ROW]
[ROW][C]1[/C][C]0.511356[/C][C]3.9609[/C][C]1e-04[/C][/ROW]
[ROW][C]2[/C][C]0.431744[/C][C]3.3443[/C][C]0.000713[/C][/ROW]
[ROW][C]3[/C][C]0.52293[/C][C]4.0506[/C][C]7.4e-05[/C][/ROW]
[ROW][C]4[/C][C]0.267204[/C][C]2.0697[/C][C]0.021395[/C][/ROW]
[ROW][C]5[/C][C]0.155425[/C][C]1.2039[/C][C]0.116675[/C][/ROW]
[ROW][C]6[/C][C]0.277243[/C][C]2.1475[/C][C]0.017901[/C][/ROW]
[ROW][C]7[/C][C]0.141639[/C][C]1.0971[/C][C]0.138484[/C][/ROW]
[ROW][C]8[/C][C]0.163616[/C][C]1.2674[/C][C]0.104961[/C][/ROW]
[ROW][C]9[/C][C]0.260735[/C][C]2.0196[/C][C]0.023947[/C][/ROW]
[ROW][C]10[/C][C]0.181415[/C][C]1.4052[/C][C]0.082555[/C][/ROW]
[ROW][C]11[/C][C]0.304928[/C][C]2.362[/C][C]0.01072[/C][/ROW]
[ROW][C]12[/C][C]0.368268[/C][C]2.8526[/C][C]0.00297[/C][/ROW]
[ROW][C]13[/C][C]0.138971[/C][C]1.0765[/C][C]0.143015[/C][/ROW]
[ROW][C]14[/C][C]0.231974[/C][C]1.7969[/C][C]0.038696[/C][/ROW]
[ROW][C]15[/C][C]0.184681[/C][C]1.4305[/C][C]0.078875[/C][/ROW]
[ROW][C]16[/C][C]-0.047764[/C][C]-0.37[/C][C]0.356352[/C][/ROW]
[ROW][C]17[/C][C]-0.003233[/C][C]-0.025[/C][C]0.490053[/C][/ROW]
[ROW][C]18[/C][C]0.040545[/C][C]0.3141[/C][C]0.377281[/C][/ROW]
[ROW][C]19[/C][C]-0.14978[/C][C]-1.1602[/C][C]0.125283[/C][/ROW]
[ROW][C]20[/C][C]-0.026645[/C][C]-0.2064[/C][C]0.418592[/C][/ROW]
[ROW][C]21[/C][C]0.067764[/C][C]0.5249[/C][C]0.300793[/C][/ROW]
[ROW][C]22[/C][C]-0.094794[/C][C]-0.7343[/C][C]0.232822[/C][/ROW]
[ROW][C]23[/C][C]0.03781[/C][C]0.2929[/C][C]0.385316[/C][/ROW]
[ROW][C]24[/C][C]-0.002266[/C][C]-0.0176[/C][C]0.493026[/C][/ROW]
[ROW][C]25[/C][C]-0.15364[/C][C]-1.1901[/C][C]0.119349[/C][/ROW]
[ROW][C]26[/C][C]-0.110437[/C][C]-0.8554[/C][C]0.197854[/C][/ROW]
[ROW][C]27[/C][C]-0.169472[/C][C]-1.3127[/C][C]0.097137[/C][/ROW]
[ROW][C]28[/C][C]-0.306917[/C][C]-2.3774[/C][C]0.010321[/C][/ROW]
[ROW][C]29[/C][C]-0.225881[/C][C]-1.7497[/C][C]0.042644[/C][/ROW]
[ROW][C]30[/C][C]-0.278299[/C][C]-2.1557[/C][C]0.017564[/C][/ROW]
[ROW][C]31[/C][C]-0.315979[/C][C]-2.4476[/C][C]0.008663[/C][/ROW]
[ROW][C]32[/C][C]-0.115802[/C][C]-0.897[/C][C]0.186653[/C][/ROW]
[ROW][C]33[/C][C]-0.186332[/C][C]-1.4433[/C][C]0.077065[/C][/ROW]
[ROW][C]34[/C][C]-0.215187[/C][C]-1.6668[/C][C]0.05038[/C][/ROW]
[ROW][C]35[/C][C]-0.090825[/C][C]-0.7035[/C][C]0.242224[/C][/ROW]
[ROW][C]36[/C][C]-0.112714[/C][C]-0.8731[/C][C]0.19305[/C][/ROW]
[ROW][C]37[/C][C]-0.186915[/C][C]-1.4478[/C][C]0.076434[/C][/ROW]
[ROW][C]38[/C][C]-0.14774[/C][C]-1.1444[/C][C]0.128504[/C][/ROW]
[ROW][C]39[/C][C]-0.129963[/C][C]-1.0067[/C][C]0.159063[/C][/ROW]
[ROW][C]40[/C][C]-0.234474[/C][C]-1.8162[/C][C]0.037166[/C][/ROW]
[ROW][C]41[/C][C]-0.217338[/C][C]-1.6835[/C][C]0.048738[/C][/ROW]
[ROW][C]42[/C][C]-0.184858[/C][C]-1.4319[/C][C]0.07868[/C][/ROW]
[ROW][C]43[/C][C]-0.188697[/C][C]-1.4616[/C][C]0.074529[/C][/ROW]
[ROW][C]44[/C][C]-0.174077[/C][C]-1.3484[/C][C]0.0913[/C][/ROW]
[ROW][C]45[/C][C]-0.211089[/C][C]-1.6351[/C][C]0.053633[/C][/ROW]
[ROW][C]46[/C][C]-0.125675[/C][C]-0.9735[/C][C]0.167112[/C][/ROW]
[ROW][C]47[/C][C]-0.089532[/C][C]-0.6935[/C][C]0.245333[/C][/ROW]
[ROW][C]48[/C][C]-0.094727[/C][C]-0.7338[/C][C]0.232978[/C][/ROW]
[ROW][C]49[/C][C]-0.068198[/C][C]-0.5283[/C][C]0.299634[/C][/ROW]
[ROW][C]50[/C][C]-0.011442[/C][C]-0.0886[/C][C]0.464837[/C][/ROW]
[ROW][C]51[/C][C]-0.066833[/C][C]-0.5177[/C][C]0.30329[/C][/ROW]
[ROW][C]52[/C][C]-0.063549[/C][C]-0.4923[/C][C]0.312169[/C][/ROW]
[ROW][C]53[/C][C]0.01737[/C][C]0.1345[/C][C]0.446711[/C][/ROW]
[ROW][C]54[/C][C]0.005485[/C][C]0.0425[/C][C]0.483125[/C][/ROW]
[ROW][C]55[/C][C]0.00816[/C][C]0.0632[/C][C]0.474907[/C][/ROW]
[ROW][C]56[/C][C]0.015919[/C][C]0.1233[/C][C]0.451137[/C][/ROW]
[ROW][C]57[/C][C]0.000241[/C][C]0.0019[/C][C]0.499257[/C][/ROW]
[ROW][C]58[/C][C]-0.02074[/C][C]-0.1606[/C][C]0.436454[/C][/ROW]
[ROW][C]59[/C][C]-0.013609[/C][C]-0.1054[/C][C]0.458199[/C][/ROW]
[ROW][C]60[/C][C]NA[/C][C]NA[/C][C]NA[/C][/ROW]
[/TABLE]
Source: https://freestatistics.org/blog/index.php?pk=33419&T=1

Globally Unique Identifier (entire table): ba.freestatistics.org/blog/index.php?pk=33419&T=1

As an alternative you can also use a QR Code:  

The GUIDs for individual cells are displayed in the table below:

Autocorrelation Function
Time lag kACF(k)T-STATP-value
10.5113563.96091e-04
20.4317443.34430.000713
30.522934.05067.4e-05
40.2672042.06970.021395
50.1554251.20390.116675
60.2772432.14750.017901
70.1416391.09710.138484
80.1636161.26740.104961
90.2607352.01960.023947
100.1814151.40520.082555
110.3049282.3620.01072
120.3682682.85260.00297
130.1389711.07650.143015
140.2319741.79690.038696
150.1846811.43050.078875
16-0.047764-0.370.356352
17-0.003233-0.0250.490053
180.0405450.31410.377281
19-0.14978-1.16020.125283
20-0.026645-0.20640.418592
210.0677640.52490.300793
22-0.094794-0.73430.232822
230.037810.29290.385316
24-0.002266-0.01760.493026
25-0.15364-1.19010.119349
26-0.110437-0.85540.197854
27-0.169472-1.31270.097137
28-0.306917-2.37740.010321
29-0.225881-1.74970.042644
30-0.278299-2.15570.017564
31-0.315979-2.44760.008663
32-0.115802-0.8970.186653
33-0.186332-1.44330.077065
34-0.215187-1.66680.05038
35-0.090825-0.70350.242224
36-0.112714-0.87310.19305
37-0.186915-1.44780.076434
38-0.14774-1.14440.128504
39-0.129963-1.00670.159063
40-0.234474-1.81620.037166
41-0.217338-1.68350.048738
42-0.184858-1.43190.07868
43-0.188697-1.46160.074529
44-0.174077-1.34840.0913
45-0.211089-1.63510.053633
46-0.125675-0.97350.167112
47-0.089532-0.69350.245333
48-0.094727-0.73380.232978
49-0.068198-0.52830.299634
50-0.011442-0.08860.464837
51-0.066833-0.51770.30329
52-0.063549-0.49230.312169
530.017370.13450.446711
540.0054850.04250.483125
550.008160.06320.474907
560.0159190.12330.451137
570.0002410.00190.499257
58-0.02074-0.16060.436454
59-0.013609-0.10540.458199
60NANANA


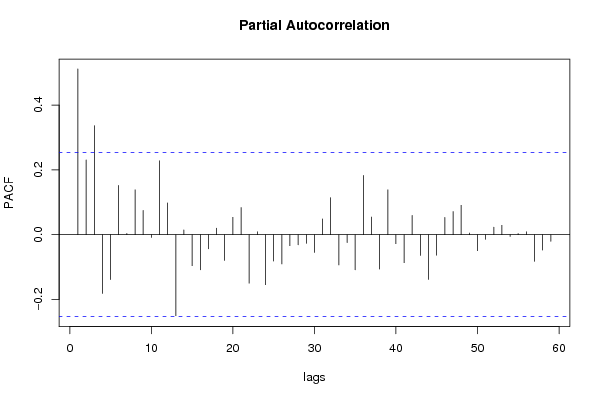
Partial Autocorrelation Function
Time lag kPACF(k)T-STATP-value
10.5113563.96091e-04
20.2305431.78580.039594
30.3363032.6050.005784
4-0.181212-1.40370.082787
5-0.138706-1.07440.14347
60.1519151.17670.121976
70.0037220.02880.488546
80.138431.07230.143946
90.0748920.58010.282005
10-0.008613-0.06670.473515
110.2277911.76450.041372
120.0979870.7590.225411
13-0.250147-1.93760.028689
140.0144250.11170.455703
15-0.095684-0.74120.230742
16-0.108525-0.84060.201947
17-0.043598-0.33770.368382
180.0198960.15410.439018
19-0.079655-0.6170.269783
200.0535520.41480.339879
210.0834870.64670.26015
22-0.149842-1.16070.125187
230.0089810.06960.472385
24-0.154544-1.19710.117989
25-0.081626-0.63230.264805
26-0.090375-0.70.243304
27-0.033992-0.26330.39661
28-0.03132-0.24260.404571
29-0.026616-0.20620.41868
30-0.055019-0.42620.335754
310.0484030.37490.354519
320.1142710.88510.189808
33-0.093327-0.72290.236273
34-0.024488-0.18970.4251
35-0.108401-0.83970.202214
360.1827721.41570.08101
370.0540990.4190.338339
38-0.106273-0.82320.206831
390.1381911.07040.144358
40-0.02788-0.2160.414877
41-0.086619-0.67090.252415
420.0594630.46060.323376
43-0.06402-0.49590.31089
44-0.138005-1.0690.144681
45-0.063472-0.49170.312379
460.0530610.4110.341266
470.0714080.55310.291116
480.0905260.70120.24294
490.0048610.03770.485044
50-0.049352-0.38230.351802
51-0.014436-0.11180.455668
520.0230740.17870.429375
530.0287670.22280.412213
54-0.005582-0.04320.482827
550.0032860.02550.48989
560.0087990.06820.472945
57-0.082452-0.63870.262734
58-0.047386-0.3670.357437
59-0.020365-0.15770.437592
60NANANA

\begin{tabular}{lllllllll}
\hline
Partial Autocorrelation Function \tabularnewline
Time lag k & PACF(k) & T-STAT & P-value \tabularnewline
1 & 0.511356 & 3.9609 & 1e-04 \tabularnewline
2 & 0.230543 & 1.7858 & 0.039594 \tabularnewline
3 & 0.336303 & 2.605 & 0.005784 \tabularnewline
4 & -0.181212 & -1.4037 & 0.082787 \tabularnewline
5 & -0.138706 & -1.0744 & 0.14347 \tabularnewline
6 & 0.151915 & 1.1767 & 0.121976 \tabularnewline
7 & 0.003722 & 0.0288 & 0.488546 \tabularnewline
8 & 0.13843 & 1.0723 & 0.143946 \tabularnewline
9 & 0.074892 & 0.5801 & 0.282005 \tabularnewline
10 & -0.008613 & -0.0667 & 0.473515 \tabularnewline
11 & 0.227791 & 1.7645 & 0.041372 \tabularnewline
12 & 0.097987 & 0.759 & 0.225411 \tabularnewline
13 & -0.250147 & -1.9376 & 0.028689 \tabularnewline
14 & 0.014425 & 0.1117 & 0.455703 \tabularnewline
15 & -0.095684 & -0.7412 & 0.230742 \tabularnewline
16 & -0.108525 & -0.8406 & 0.201947 \tabularnewline
17 & -0.043598 & -0.3377 & 0.368382 \tabularnewline
18 & 0.019896 & 0.1541 & 0.439018 \tabularnewline
19 & -0.079655 & -0.617 & 0.269783 \tabularnewline
20 & 0.053552 & 0.4148 & 0.339879 \tabularnewline
21 & 0.083487 & 0.6467 & 0.26015 \tabularnewline
22 & -0.149842 & -1.1607 & 0.125187 \tabularnewline
23 & 0.008981 & 0.0696 & 0.472385 \tabularnewline
24 & -0.154544 & -1.1971 & 0.117989 \tabularnewline
25 & -0.081626 & -0.6323 & 0.264805 \tabularnewline
26 & -0.090375 & -0.7 & 0.243304 \tabularnewline
27 & -0.033992 & -0.2633 & 0.39661 \tabularnewline
28 & -0.03132 & -0.2426 & 0.404571 \tabularnewline
29 & -0.026616 & -0.2062 & 0.41868 \tabularnewline
30 & -0.055019 & -0.4262 & 0.335754 \tabularnewline
31 & 0.048403 & 0.3749 & 0.354519 \tabularnewline
32 & 0.114271 & 0.8851 & 0.189808 \tabularnewline
33 & -0.093327 & -0.7229 & 0.236273 \tabularnewline
34 & -0.024488 & -0.1897 & 0.4251 \tabularnewline
35 & -0.108401 & -0.8397 & 0.202214 \tabularnewline
36 & 0.182772 & 1.4157 & 0.08101 \tabularnewline
37 & 0.054099 & 0.419 & 0.338339 \tabularnewline
38 & -0.106273 & -0.8232 & 0.206831 \tabularnewline
39 & 0.138191 & 1.0704 & 0.144358 \tabularnewline
40 & -0.02788 & -0.216 & 0.414877 \tabularnewline
41 & -0.086619 & -0.6709 & 0.252415 \tabularnewline
42 & 0.059463 & 0.4606 & 0.323376 \tabularnewline
43 & -0.06402 & -0.4959 & 0.31089 \tabularnewline
44 & -0.138005 & -1.069 & 0.144681 \tabularnewline
45 & -0.063472 & -0.4917 & 0.312379 \tabularnewline
46 & 0.053061 & 0.411 & 0.341266 \tabularnewline
47 & 0.071408 & 0.5531 & 0.291116 \tabularnewline
48 & 0.090526 & 0.7012 & 0.24294 \tabularnewline
49 & 0.004861 & 0.0377 & 0.485044 \tabularnewline
50 & -0.049352 & -0.3823 & 0.351802 \tabularnewline
51 & -0.014436 & -0.1118 & 0.455668 \tabularnewline
52 & 0.023074 & 0.1787 & 0.429375 \tabularnewline
53 & 0.028767 & 0.2228 & 0.412213 \tabularnewline
54 & -0.005582 & -0.0432 & 0.482827 \tabularnewline
55 & 0.003286 & 0.0255 & 0.48989 \tabularnewline
56 & 0.008799 & 0.0682 & 0.472945 \tabularnewline
57 & -0.082452 & -0.6387 & 0.262734 \tabularnewline
58 & -0.047386 & -0.367 & 0.357437 \tabularnewline
59 & -0.020365 & -0.1577 & 0.437592 \tabularnewline
60 & NA & NA & NA \tabularnewline
\hline
\end{tabular}
%Source: https://freestatistics.org/blog/index.php?pk=33419&T=2

[TABLE]
[ROW][C]Partial Autocorrelation Function[/C][/ROW]
[ROW][C]Time lag k[/C][C]PACF(k)[/C][C]T-STAT[/C][C]P-value[/C][/ROW]
[ROW][C]1[/C][C]0.511356[/C][C]3.9609[/C][C]1e-04[/C][/ROW]
[ROW][C]2[/C][C]0.230543[/C][C]1.7858[/C][C]0.039594[/C][/ROW]
[ROW][C]3[/C][C]0.336303[/C][C]2.605[/C][C]0.005784[/C][/ROW]
[ROW][C]4[/C][C]-0.181212[/C][C]-1.4037[/C][C]0.082787[/C][/ROW]
[ROW][C]5[/C][C]-0.138706[/C][C]-1.0744[/C][C]0.14347[/C][/ROW]
[ROW][C]6[/C][C]0.151915[/C][C]1.1767[/C][C]0.121976[/C][/ROW]
[ROW][C]7[/C][C]0.003722[/C][C]0.0288[/C][C]0.488546[/C][/ROW]
[ROW][C]8[/C][C]0.13843[/C][C]1.0723[/C][C]0.143946[/C][/ROW]
[ROW][C]9[/C][C]0.074892[/C][C]0.5801[/C][C]0.282005[/C][/ROW]
[ROW][C]10[/C][C]-0.008613[/C][C]-0.0667[/C][C]0.473515[/C][/ROW]
[ROW][C]11[/C][C]0.227791[/C][C]1.7645[/C][C]0.041372[/C][/ROW]
[ROW][C]12[/C][C]0.097987[/C][C]0.759[/C][C]0.225411[/C][/ROW]
[ROW][C]13[/C][C]-0.250147[/C][C]-1.9376[/C][C]0.028689[/C][/ROW]
[ROW][C]14[/C][C]0.014425[/C][C]0.1117[/C][C]0.455703[/C][/ROW]
[ROW][C]15[/C][C]-0.095684[/C][C]-0.7412[/C][C]0.230742[/C][/ROW]
[ROW][C]16[/C][C]-0.108525[/C][C]-0.8406[/C][C]0.201947[/C][/ROW]
[ROW][C]17[/C][C]-0.043598[/C][C]-0.3377[/C][C]0.368382[/C][/ROW]
[ROW][C]18[/C][C]0.019896[/C][C]0.1541[/C][C]0.439018[/C][/ROW]
[ROW][C]19[/C][C]-0.079655[/C][C]-0.617[/C][C]0.269783[/C][/ROW]
[ROW][C]20[/C][C]0.053552[/C][C]0.4148[/C][C]0.339879[/C][/ROW]
[ROW][C]21[/C][C]0.083487[/C][C]0.6467[/C][C]0.26015[/C][/ROW]
[ROW][C]22[/C][C]-0.149842[/C][C]-1.1607[/C][C]0.125187[/C][/ROW]
[ROW][C]23[/C][C]0.008981[/C][C]0.0696[/C][C]0.472385[/C][/ROW]
[ROW][C]24[/C][C]-0.154544[/C][C]-1.1971[/C][C]0.117989[/C][/ROW]
[ROW][C]25[/C][C]-0.081626[/C][C]-0.6323[/C][C]0.264805[/C][/ROW]
[ROW][C]26[/C][C]-0.090375[/C][C]-0.7[/C][C]0.243304[/C][/ROW]
[ROW][C]27[/C][C]-0.033992[/C][C]-0.2633[/C][C]0.39661[/C][/ROW]
[ROW][C]28[/C][C]-0.03132[/C][C]-0.2426[/C][C]0.404571[/C][/ROW]
[ROW][C]29[/C][C]-0.026616[/C][C]-0.2062[/C][C]0.41868[/C][/ROW]
[ROW][C]30[/C][C]-0.055019[/C][C]-0.4262[/C][C]0.335754[/C][/ROW]
[ROW][C]31[/C][C]0.048403[/C][C]0.3749[/C][C]0.354519[/C][/ROW]
[ROW][C]32[/C][C]0.114271[/C][C]0.8851[/C][C]0.189808[/C][/ROW]
[ROW][C]33[/C][C]-0.093327[/C][C]-0.7229[/C][C]0.236273[/C][/ROW]
[ROW][C]34[/C][C]-0.024488[/C][C]-0.1897[/C][C]0.4251[/C][/ROW]
[ROW][C]35[/C][C]-0.108401[/C][C]-0.8397[/C][C]0.202214[/C][/ROW]
[ROW][C]36[/C][C]0.182772[/C][C]1.4157[/C][C]0.08101[/C][/ROW]
[ROW][C]37[/C][C]0.054099[/C][C]0.419[/C][C]0.338339[/C][/ROW]
[ROW][C]38[/C][C]-0.106273[/C][C]-0.8232[/C][C]0.206831[/C][/ROW]
[ROW][C]39[/C][C]0.138191[/C][C]1.0704[/C][C]0.144358[/C][/ROW]
[ROW][C]40[/C][C]-0.02788[/C][C]-0.216[/C][C]0.414877[/C][/ROW]
[ROW][C]41[/C][C]-0.086619[/C][C]-0.6709[/C][C]0.252415[/C][/ROW]
[ROW][C]42[/C][C]0.059463[/C][C]0.4606[/C][C]0.323376[/C][/ROW]
[ROW][C]43[/C][C]-0.06402[/C][C]-0.4959[/C][C]0.31089[/C][/ROW]
[ROW][C]44[/C][C]-0.138005[/C][C]-1.069[/C][C]0.144681[/C][/ROW]
[ROW][C]45[/C][C]-0.063472[/C][C]-0.4917[/C][C]0.312379[/C][/ROW]
[ROW][C]46[/C][C]0.053061[/C][C]0.411[/C][C]0.341266[/C][/ROW]
[ROW][C]47[/C][C]0.071408[/C][C]0.5531[/C][C]0.291116[/C][/ROW]
[ROW][C]48[/C][C]0.090526[/C][C]0.7012[/C][C]0.24294[/C][/ROW]
[ROW][C]49[/C][C]0.004861[/C][C]0.0377[/C][C]0.485044[/C][/ROW]
[ROW][C]50[/C][C]-0.049352[/C][C]-0.3823[/C][C]0.351802[/C][/ROW]
[ROW][C]51[/C][C]-0.014436[/C][C]-0.1118[/C][C]0.455668[/C][/ROW]
[ROW][C]52[/C][C]0.023074[/C][C]0.1787[/C][C]0.429375[/C][/ROW]
[ROW][C]53[/C][C]0.028767[/C][C]0.2228[/C][C]0.412213[/C][/ROW]
[ROW][C]54[/C][C]-0.005582[/C][C]-0.0432[/C][C]0.482827[/C][/ROW]
[ROW][C]55[/C][C]0.003286[/C][C]0.0255[/C][C]0.48989[/C][/ROW]
[ROW][C]56[/C][C]0.008799[/C][C]0.0682[/C][C]0.472945[/C][/ROW]
[ROW][C]57[/C][C]-0.082452[/C][C]-0.6387[/C][C]0.262734[/C][/ROW]
[ROW][C]58[/C][C]-0.047386[/C][C]-0.367[/C][C]0.357437[/C][/ROW]
[ROW][C]59[/C][C]-0.020365[/C][C]-0.1577[/C][C]0.437592[/C][/ROW]
[ROW][C]60[/C][C]NA[/C][C]NA[/C][C]NA[/C][/ROW]
[/TABLE]
Source: https://freestatistics.org/blog/index.php?pk=33419&T=2

Globally Unique Identifier (entire table): ba.freestatistics.org/blog/index.php?pk=33419&T=2

As an alternative you can also use a QR Code:  

The GUIDs for individual cells are displayed in the table below:

Partial Autocorrelation Function
Time lag kPACF(k)T-STATP-value
10.5113563.96091e-04
20.2305431.78580.039594
30.3363032.6050.005784
4-0.181212-1.40370.082787
5-0.138706-1.07440.14347
60.1519151.17670.121976
70.0037220.02880.488546
80.138431.07230.143946
90.0748920.58010.282005
10-0.008613-0.06670.473515
110.2277911.76450.041372
120.0979870.7590.225411
13-0.250147-1.93760.028689
140.0144250.11170.455703
15-0.095684-0.74120.230742
16-0.108525-0.84060.201947
17-0.043598-0.33770.368382
180.0198960.15410.439018
19-0.079655-0.6170.269783
200.0535520.41480.339879
210.0834870.64670.26015
22-0.149842-1.16070.125187
230.0089810.06960.472385
24-0.154544-1.19710.117989
25-0.081626-0.63230.264805
26-0.090375-0.70.243304
27-0.033992-0.26330.39661
28-0.03132-0.24260.404571
29-0.026616-0.20620.41868
30-0.055019-0.42620.335754
310.0484030.37490.354519
320.1142710.88510.189808
33-0.093327-0.72290.236273
34-0.024488-0.18970.4251
35-0.108401-0.83970.202214
360.1827721.41570.08101
370.0540990.4190.338339
38-0.106273-0.82320.206831
390.1381911.07040.144358
40-0.02788-0.2160.414877
41-0.086619-0.67090.252415
420.0594630.46060.323376
43-0.06402-0.49590.31089
44-0.138005-1.0690.144681
45-0.063472-0.49170.312379
460.0530610.4110.341266
470.0714080.55310.291116
480.0905260.70120.24294
490.0048610.03770.485044
50-0.049352-0.38230.351802
51-0.014436-0.11180.455668
520.0230740.17870.429375
530.0287670.22280.412213
54-0.005582-0.04320.482827
550.0032860.02550.48989
560.0087990.06820.472945
57-0.082452-0.63870.262734
58-0.047386-0.3670.357437
59-0.020365-0.15770.437592
60NANANA


Parameters (Session):
par1 = 60 ; par2 = 1 ; par3 = 0 ; par4 = 0 ; par5 = 12 ;
Parameters (R input):
par1 = 60 ; par2 = 1 ; par3 = 0 ; par4 = 0 ; par5 = 12 ;
R code (references can be found in the software module):
if (par1 == 'Default') {
par1 = 10*log10(length(x))
} else {
par1 <- as.numeric(par1)
}
par2 <- as.numeric(par2)
par3 <- as.numeric(par3)
par4 <- as.numeric(par4)
par5 <- as.numeric(par5)
if (par2 == 0) {
x <- log(x)
} else {
x <- (x ^ par2 - 1) / par2
}
if (par3 > 0) x <- diff(x,lag=1,difference=par3)
if (par4 > 0) x <- diff(x,lag=par5,difference=par4)
bitmap(file='pic1.png')
racf <- acf(x,par1,main='Autocorrelation',xlab='lags',ylab='ACF')
dev.off()
bitmap(file='pic2.png')
rpacf <- pacf(x,par1,main='Partial Autocorrelation',xlab='lags',ylab='PACF')
dev.off()
(myacf <- c(racf$acf))
(mypacf <- c(rpacf$acf))
lengthx <- length(x)
sqrtn <- sqrt(lengthx)
load(file='createtable')
a<-table.start()
a<-table.row.start(a)
a<-table.element(a,'Autocorrelation Function',4,TRUE)
a<-table.row.end(a)
a<-table.row.start(a)
a<-table.element(a,'Time lag k',header=TRUE)
a<-table.element(a,hyperlink('basics.htm','ACF(k)','click here for more information about the Autocorrelation Function'),header=TRUE)
a<-table.element(a,'T-STAT',header=TRUE)
a<-table.element(a,'P-value',header=TRUE)
a<-table.row.end(a)
for (i in 2:(par1+1)) {
a<-table.row.start(a)
a<-table.element(a,i-1,header=TRUE)
a<-table.element(a,round(myacf[i],6))
mytstat <- myacf[i]*sqrtn
a<-table.element(a,round(mytstat,4))
a<-table.element(a,round(1-pt(abs(mytstat),lengthx),6))
a<-table.row.end(a)
}
a<-table.end(a)
table.save(a,file='mytable.tab')
a<-table.start()
a<-table.row.start(a)
a<-table.element(a,'Partial Autocorrelation Function',4,TRUE)
a<-table.row.end(a)
a<-table.row.start(a)
a<-table.element(a,'Time lag k',header=TRUE)
a<-table.element(a,hyperlink('basics.htm','PACF(k)','click here for more information about the Partial Autocorrelation Function'),header=TRUE)
a<-table.element(a,'T-STAT',header=TRUE)
a<-table.element(a,'P-value',header=TRUE)
a<-table.row.end(a)
for (i in 1:par1) {
a<-table.row.start(a)
a<-table.element(a,i,header=TRUE)
a<-table.element(a,round(mypacf[i],6))
mytstat <- mypacf[i]*sqrtn
a<-table.element(a,round(mytstat,4))
a<-table.element(a,round(1-pt(abs(mytstat),lengthx),6))
a<-table.row.end(a)
}
a<-table.end(a)
table.save(a,file='mytable1.tab')