Free Statistics

of Irreproducible Research!

Author's title

Author*Unverified author*
R Software Modulerwasp_arimabackwardselection.wasp
Title produced by softwareARIMA Backward Selection
Date of computationSun, 14 Dec 2008 08:26:26 -0700
Cite this page as followsStatistical Computations at FreeStatistics.org, Office for Research Development and Education, URL https://freestatistics.org/blog/index.php?v=date/2008/Dec/14/t1229268427iaaxeq2f92z45hr.htm/, Retrieved Wed, 15 May 2024 04:55:27 +0000
Statistical Computations at FreeStatistics.org, Office for Research Development and Education, URL https://freestatistics.org/blog/index.php?pk=33417, Retrieved Wed, 15 May 2024 04:55:27 +0000
QR Codes:

Original text written by user:
IsPrivate?No (this computation is public)
User-defined keywords
Estimated Impact191
Family? (F = Feedback message, R = changed R code, M = changed R Module, P = changed Parameters, D = changed Data)
F     [(Partial) Autocorrelation Function] [paper bel20 autoc...] [2008-12-03 13:05:59] [f58cc3b532da25682c394745f1a82535]
-   PD  [(Partial) Autocorrelation Function] [paper variance re...] [2008-12-03 14:08:24] [f58cc3b532da25682c394745f1a82535]
- RM      [Spectral Analysis] [paper spectral an...] [2008-12-03 14:40:03] [f58cc3b532da25682c394745f1a82535]
-   P       [Spectral Analysis] [] [2008-12-07 15:17:33] [74be16979710d4c4e7c6647856088456]
F RMP         [ARIMA Backward Selection] [] [2008-12-09 18:26:36] [300682cb535653f8775e6b312a464dab]
-   P             [ARIMA Backward Selection] [] [2008-12-14 15:26:26] [d41d8cd98f00b204e9800998ecf8427e] [Current]
-   P               [ARIMA Backward Selection] [] [2008-12-15 18:05:04] [74be16979710d4c4e7c6647856088456]
-   P                 [ARIMA Backward Selection] [] [2008-12-16 16:31:14] [74be16979710d4c4e7c6647856088456]
F RMP                   [ARIMA Forecasting] [] [2008-12-16 17:13:10] [74be16979710d4c4e7c6647856088456]
Feedback Forum

Post a new message
Dataseries X:
2659.81
2638.53
2720.25
2745.88
2735.7
2811.7
2799.43
2555.28
2304.98
2214.95
2065.81
1940.49
2042
1995.37
1946.81
1765.9
1635.25
1833.42
1910.43
1959.67
1969.6
2061.41
2093.48
2120.88
2174.56
2196.72
2350.44
2440.25
2408.64
2472.81
2407.6
2454.62
2448.05
2497.84
2645.64
2756.76
2849.27
2921.44
2981.85
3080.58
3106.22
3119.31
3061.26
3097.31
3161.69
3257.16
3277.01
3295.32
3363.99
3494.17
3667.03
3813.06
3917.96
3895.51
3801.06
3570.12
3701.61
3862.27
3970.1
4138.52
4199.75
4290.89
4443.91
4502.64
4356.98
4591.27
4696.96
4621.4
4562.84
4202.52
4296.49
4435.23
4105.18
4116.68
3844.49
3720.98
3674.4
3857.62
3801.06
3504.37
3032.6
3047.03


Summary of computational transaction
Raw Inputview raw input (R code)
Raw Outputview raw output of R engine
Computing time3 seconds
R Server'George Udny Yule' @ 72.249.76.132

\begin{tabular}{lllllllll}
\hline
Summary of computational transaction \tabularnewline
Raw Input & view raw input (R code)  \tabularnewline
Raw Output & view raw output of R engine  \tabularnewline
Computing time & 3 seconds \tabularnewline
R Server & 'George Udny Yule' @ 72.249.76.132 \tabularnewline
\hline
\end{tabular}
%Source: https://freestatistics.org/blog/index.php?pk=33417&T=0

[TABLE]
[ROW][C]Summary of computational transaction[/C][/ROW]
[ROW][C]Raw Input[/C][C]view raw input (R code) [/C][/ROW]
[ROW][C]Raw Output[/C][C]view raw output of R engine [/C][/ROW]
[ROW][C]Computing time[/C][C]3 seconds[/C][/ROW]
[ROW][C]R Server[/C][C]'George Udny Yule' @ 72.249.76.132[/C][/ROW]
[/TABLE]
Source: https://freestatistics.org/blog/index.php?pk=33417&T=0

Globally Unique Identifier (entire table): ba.freestatistics.org/blog/index.php?pk=33417&T=0

As an alternative you can also use a QR Code:  

The GUIDs for individual cells are displayed in the table below:

Summary of computational transaction
Raw Inputview raw input (R code)
Raw Outputview raw output of R engine
Computing time3 seconds
R Server'George Udny Yule' @ 72.249.76.132


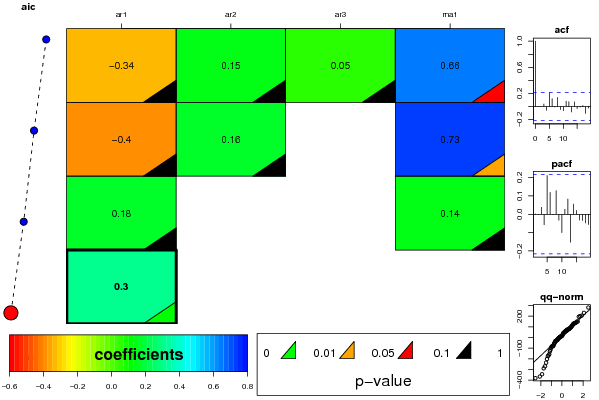
ARIMA Parameter Estimation and Backward Selection
Iterationar1ar2ar3ma1
Estimates ( 1 )-0.34350.1520.05220.6598
(p-val)(0.3807 )(0.3701 )(0.6804 )(0.0854 )
Estimates ( 2 )-0.40240.156900.7266
(p-val)(0.2814 )(0.3651 )(NA )(0.0408 )
Estimates ( 3 )0.177000.1356
(p-val)(0.7105 )(NA )(NA )(0.7839 )
Estimates ( 4 )0.3006000
(p-val)(0.0054 )(NA )(NA )(NA )
Estimates ( 5 )NANANANA
(p-val)(NA )(NA )(NA )(NA )
Estimates ( 6 )NANANANA
(p-val)(NA )(NA )(NA )(NA )
Estimates ( 7 )NANANANA
(p-val)(NA )(NA )(NA )(NA )

\begin{tabular}{lllllllll}
\hline
ARIMA Parameter Estimation and Backward Selection \tabularnewline
Iteration & ar1 & ar2 & ar3 & ma1 \tabularnewline
Estimates ( 1 ) & -0.3435 & 0.152 & 0.0522 & 0.6598 \tabularnewline
(p-val) & (0.3807 ) & (0.3701 ) & (0.6804 ) & (0.0854 ) \tabularnewline
Estimates ( 2 ) & -0.4024 & 0.1569 & 0 & 0.7266 \tabularnewline
(p-val) & (0.2814 ) & (0.3651 ) & (NA ) & (0.0408 ) \tabularnewline
Estimates ( 3 ) & 0.177 & 0 & 0 & 0.1356 \tabularnewline
(p-val) & (0.7105 ) & (NA ) & (NA ) & (0.7839 ) \tabularnewline
Estimates ( 4 ) & 0.3006 & 0 & 0 & 0 \tabularnewline
(p-val) & (0.0054 ) & (NA ) & (NA ) & (NA ) \tabularnewline
Estimates ( 5 ) & NA & NA & NA & NA \tabularnewline
(p-val) & (NA ) & (NA ) & (NA ) & (NA ) \tabularnewline
Estimates ( 6 ) & NA & NA & NA & NA \tabularnewline
(p-val) & (NA ) & (NA ) & (NA ) & (NA ) \tabularnewline
Estimates ( 7 ) & NA & NA & NA & NA \tabularnewline
(p-val) & (NA ) & (NA ) & (NA ) & (NA ) \tabularnewline
\hline
\end{tabular}
%Source: https://freestatistics.org/blog/index.php?pk=33417&T=1

[TABLE]
[ROW][C]ARIMA Parameter Estimation and Backward Selection[/C][/ROW]
[ROW][C]Iteration[/C][C]ar1[/C][C]ar2[/C][C]ar3[/C][C]ma1[/C][/ROW]
[ROW][C]Estimates ( 1 )[/C][C]-0.3435[/C][C]0.152[/C][C]0.0522[/C][C]0.6598[/C][/ROW]
[ROW][C](p-val)[/C][C](0.3807 )[/C][C](0.3701 )[/C][C](0.6804 )[/C][C](0.0854 )[/C][/ROW]
[ROW][C]Estimates ( 2 )[/C][C]-0.4024[/C][C]0.1569[/C][C]0[/C][C]0.7266[/C][/ROW]
[ROW][C](p-val)[/C][C](0.2814 )[/C][C](0.3651 )[/C][C](NA )[/C][C](0.0408 )[/C][/ROW]
[ROW][C]Estimates ( 3 )[/C][C]0.177[/C][C]0[/C][C]0[/C][C]0.1356[/C][/ROW]
[ROW][C](p-val)[/C][C](0.7105 )[/C][C](NA )[/C][C](NA )[/C][C](0.7839 )[/C][/ROW]
[ROW][C]Estimates ( 4 )[/C][C]0.3006[/C][C]0[/C][C]0[/C][C]0[/C][/ROW]
[ROW][C](p-val)[/C][C](0.0054 )[/C][C](NA )[/C][C](NA )[/C][C](NA )[/C][/ROW]
[ROW][C]Estimates ( 5 )[/C][C]NA[/C][C]NA[/C][C]NA[/C][C]NA[/C][/ROW]
[ROW][C](p-val)[/C][C](NA )[/C][C](NA )[/C][C](NA )[/C][C](NA )[/C][/ROW]
[ROW][C]Estimates ( 6 )[/C][C]NA[/C][C]NA[/C][C]NA[/C][C]NA[/C][/ROW]
[ROW][C](p-val)[/C][C](NA )[/C][C](NA )[/C][C](NA )[/C][C](NA )[/C][/ROW]
[ROW][C]Estimates ( 7 )[/C][C]NA[/C][C]NA[/C][C]NA[/C][C]NA[/C][/ROW]
[ROW][C](p-val)[/C][C](NA )[/C][C](NA )[/C][C](NA )[/C][C](NA )[/C][/ROW]
[/TABLE]
Source: https://freestatistics.org/blog/index.php?pk=33417&T=1

Globally Unique Identifier (entire table): ba.freestatistics.org/blog/index.php?pk=33417&T=1

As an alternative you can also use a QR Code:  

The GUIDs for individual cells are displayed in the table below:

ARIMA Parameter Estimation and Backward Selection
Iterationar1ar2ar3ma1
Estimates ( 1 )-0.34350.1520.05220.6598
(p-val)(0.3807 )(0.3701 )(0.6804 )(0.0854 )
Estimates ( 2 )-0.40240.156900.7266
(p-val)(0.2814 )(0.3651 )(NA )(0.0408 )
Estimates ( 3 )0.177000.1356
(p-val)(0.7105 )(NA )(NA )(0.7839 )
Estimates ( 4 )0.3006000
(p-val)(0.0054 )(NA )(NA )(NA )
Estimates ( 5 )NANANANA
(p-val)(NA )(NA )(NA )(NA )
Estimates ( 6 )NANANANA
(p-val)(NA )(NA )(NA )(NA )
Estimates ( 7 )NANANANA
(p-val)(NA )(NA )(NA )(NA )


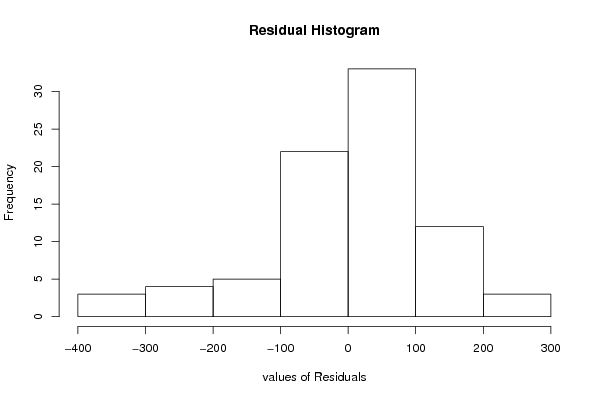
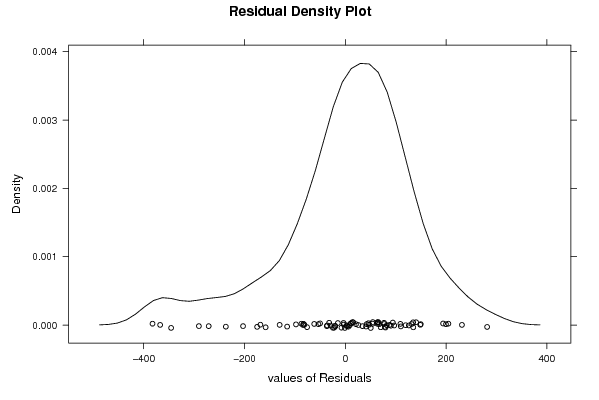
Estimated ARIMA Residuals
Value
2.65980853591523
-20.2822720419177
88.0340392131129
-0.764223218423335
-14.6122541780574
79.7837625204481
-36.5428412418813
-237.021493576675
-174.939330173721
-22.0023004879113
-130.222163981712
-81.261138877866
134.711755886442
-82.8684507154044
-29.0665411441489
-168.373147153340
-75.7934364677778
231.573355758700
10.5257708465936
34.1831847223823
-3.42126452514594
90.5167083943015
3.54323822444849
21.2437082449437
45.9491413265973
6.42691770234615
148.926383148560
42.4033763780330
-53.2562852977862
76.9884042382046
-87.0100149566779
70.3634919614096
-24.4361955701665
54.2674834085906
131.626984327138
67.1077257925444
63.7412142109793
47.1514215605353
41.2415232832441
82.4444452691432
-3.01644933015541
8.96148556804428
-61.5822460842246
54.6770862065341
50.5830873528589
77.214672996627
-7.52009097378914
15.8170971135414
63.2839770964242
109.442579101892
134.975353075361
97.128477271874
65.8806610189854
-49.9515382614236
-83.700991320909
-202.870563477779
199.880265140557
110.275737196339
64.4380743788802
140.595604209316
12.3518744624025
78.6281741817593
126.224479891767
14.526749364225
-158.024402561056
281.5043249344
26.040275528886
-97.7970442577525
-31.9215461144086
-345.626097871835
204.622197336348
94.3526795364023
-367.402641989132
119.749065878547
-290.469069910870
-35.9367857193442
-19.8467729295458
194.155786460361
-115.322768200005
-271.036765007927
-382.496818512529
149.807767986098

\begin{tabular}{lllllllll}
\hline
Estimated ARIMA Residuals \tabularnewline
Value \tabularnewline
2.65980853591523 \tabularnewline
-20.2822720419177 \tabularnewline
88.0340392131129 \tabularnewline
-0.764223218423335 \tabularnewline
-14.6122541780574 \tabularnewline
79.7837625204481 \tabularnewline
-36.5428412418813 \tabularnewline
-237.021493576675 \tabularnewline
-174.939330173721 \tabularnewline
-22.0023004879113 \tabularnewline
-130.222163981712 \tabularnewline
-81.261138877866 \tabularnewline
134.711755886442 \tabularnewline
-82.8684507154044 \tabularnewline
-29.0665411441489 \tabularnewline
-168.373147153340 \tabularnewline
-75.7934364677778 \tabularnewline
231.573355758700 \tabularnewline
10.5257708465936 \tabularnewline
34.1831847223823 \tabularnewline
-3.42126452514594 \tabularnewline
90.5167083943015 \tabularnewline
3.54323822444849 \tabularnewline
21.2437082449437 \tabularnewline
45.9491413265973 \tabularnewline
6.42691770234615 \tabularnewline
148.926383148560 \tabularnewline
42.4033763780330 \tabularnewline
-53.2562852977862 \tabularnewline
76.9884042382046 \tabularnewline
-87.0100149566779 \tabularnewline
70.3634919614096 \tabularnewline
-24.4361955701665 \tabularnewline
54.2674834085906 \tabularnewline
131.626984327138 \tabularnewline
67.1077257925444 \tabularnewline
63.7412142109793 \tabularnewline
47.1514215605353 \tabularnewline
41.2415232832441 \tabularnewline
82.4444452691432 \tabularnewline
-3.01644933015541 \tabularnewline
8.96148556804428 \tabularnewline
-61.5822460842246 \tabularnewline
54.6770862065341 \tabularnewline
50.5830873528589 \tabularnewline
77.214672996627 \tabularnewline
-7.52009097378914 \tabularnewline
15.8170971135414 \tabularnewline
63.2839770964242 \tabularnewline
109.442579101892 \tabularnewline
134.975353075361 \tabularnewline
97.128477271874 \tabularnewline
65.8806610189854 \tabularnewline
-49.9515382614236 \tabularnewline
-83.700991320909 \tabularnewline
-202.870563477779 \tabularnewline
199.880265140557 \tabularnewline
110.275737196339 \tabularnewline
64.4380743788802 \tabularnewline
140.595604209316 \tabularnewline
12.3518744624025 \tabularnewline
78.6281741817593 \tabularnewline
126.224479891767 \tabularnewline
14.526749364225 \tabularnewline
-158.024402561056 \tabularnewline
281.5043249344 \tabularnewline
26.040275528886 \tabularnewline
-97.7970442577525 \tabularnewline
-31.9215461144086 \tabularnewline
-345.626097871835 \tabularnewline
204.622197336348 \tabularnewline
94.3526795364023 \tabularnewline
-367.402641989132 \tabularnewline
119.749065878547 \tabularnewline
-290.469069910870 \tabularnewline
-35.9367857193442 \tabularnewline
-19.8467729295458 \tabularnewline
194.155786460361 \tabularnewline
-115.322768200005 \tabularnewline
-271.036765007927 \tabularnewline
-382.496818512529 \tabularnewline
149.807767986098 \tabularnewline
\hline
\end{tabular}
%Source: https://freestatistics.org/blog/index.php?pk=33417&T=2

[TABLE]
[ROW][C]Estimated ARIMA Residuals[/C][/ROW]
[ROW][C]Value[/C][/ROW]
[ROW][C]2.65980853591523[/C][/ROW]
[ROW][C]-20.2822720419177[/C][/ROW]
[ROW][C]88.0340392131129[/C][/ROW]
[ROW][C]-0.764223218423335[/C][/ROW]
[ROW][C]-14.6122541780574[/C][/ROW]
[ROW][C]79.7837625204481[/C][/ROW]
[ROW][C]-36.5428412418813[/C][/ROW]
[ROW][C]-237.021493576675[/C][/ROW]
[ROW][C]-174.939330173721[/C][/ROW]
[ROW][C]-22.0023004879113[/C][/ROW]
[ROW][C]-130.222163981712[/C][/ROW]
[ROW][C]-81.261138877866[/C][/ROW]
[ROW][C]134.711755886442[/C][/ROW]
[ROW][C]-82.8684507154044[/C][/ROW]
[ROW][C]-29.0665411441489[/C][/ROW]
[ROW][C]-168.373147153340[/C][/ROW]
[ROW][C]-75.7934364677778[/C][/ROW]
[ROW][C]231.573355758700[/C][/ROW]
[ROW][C]10.5257708465936[/C][/ROW]
[ROW][C]34.1831847223823[/C][/ROW]
[ROW][C]-3.42126452514594[/C][/ROW]
[ROW][C]90.5167083943015[/C][/ROW]
[ROW][C]3.54323822444849[/C][/ROW]
[ROW][C]21.2437082449437[/C][/ROW]
[ROW][C]45.9491413265973[/C][/ROW]
[ROW][C]6.42691770234615[/C][/ROW]
[ROW][C]148.926383148560[/C][/ROW]
[ROW][C]42.4033763780330[/C][/ROW]
[ROW][C]-53.2562852977862[/C][/ROW]
[ROW][C]76.9884042382046[/C][/ROW]
[ROW][C]-87.0100149566779[/C][/ROW]
[ROW][C]70.3634919614096[/C][/ROW]
[ROW][C]-24.4361955701665[/C][/ROW]
[ROW][C]54.2674834085906[/C][/ROW]
[ROW][C]131.626984327138[/C][/ROW]
[ROW][C]67.1077257925444[/C][/ROW]
[ROW][C]63.7412142109793[/C][/ROW]
[ROW][C]47.1514215605353[/C][/ROW]
[ROW][C]41.2415232832441[/C][/ROW]
[ROW][C]82.4444452691432[/C][/ROW]
[ROW][C]-3.01644933015541[/C][/ROW]
[ROW][C]8.96148556804428[/C][/ROW]
[ROW][C]-61.5822460842246[/C][/ROW]
[ROW][C]54.6770862065341[/C][/ROW]
[ROW][C]50.5830873528589[/C][/ROW]
[ROW][C]77.214672996627[/C][/ROW]
[ROW][C]-7.52009097378914[/C][/ROW]
[ROW][C]15.8170971135414[/C][/ROW]
[ROW][C]63.2839770964242[/C][/ROW]
[ROW][C]109.442579101892[/C][/ROW]
[ROW][C]134.975353075361[/C][/ROW]
[ROW][C]97.128477271874[/C][/ROW]
[ROW][C]65.8806610189854[/C][/ROW]
[ROW][C]-49.9515382614236[/C][/ROW]
[ROW][C]-83.700991320909[/C][/ROW]
[ROW][C]-202.870563477779[/C][/ROW]
[ROW][C]199.880265140557[/C][/ROW]
[ROW][C]110.275737196339[/C][/ROW]
[ROW][C]64.4380743788802[/C][/ROW]
[ROW][C]140.595604209316[/C][/ROW]
[ROW][C]12.3518744624025[/C][/ROW]
[ROW][C]78.6281741817593[/C][/ROW]
[ROW][C]126.224479891767[/C][/ROW]
[ROW][C]14.526749364225[/C][/ROW]
[ROW][C]-158.024402561056[/C][/ROW]
[ROW][C]281.5043249344[/C][/ROW]
[ROW][C]26.040275528886[/C][/ROW]
[ROW][C]-97.7970442577525[/C][/ROW]
[ROW][C]-31.9215461144086[/C][/ROW]
[ROW][C]-345.626097871835[/C][/ROW]
[ROW][C]204.622197336348[/C][/ROW]
[ROW][C]94.3526795364023[/C][/ROW]
[ROW][C]-367.402641989132[/C][/ROW]
[ROW][C]119.749065878547[/C][/ROW]
[ROW][C]-290.469069910870[/C][/ROW]
[ROW][C]-35.9367857193442[/C][/ROW]
[ROW][C]-19.8467729295458[/C][/ROW]
[ROW][C]194.155786460361[/C][/ROW]
[ROW][C]-115.322768200005[/C][/ROW]
[ROW][C]-271.036765007927[/C][/ROW]
[ROW][C]-382.496818512529[/C][/ROW]
[ROW][C]149.807767986098[/C][/ROW]
[/TABLE]
Source: https://freestatistics.org/blog/index.php?pk=33417&T=2

Globally Unique Identifier (entire table): ba.freestatistics.org/blog/index.php?pk=33417&T=2

As an alternative you can also use a QR Code:  

The GUIDs for individual cells are displayed in the table below:

Estimated ARIMA Residuals
Value
2.65980853591523
-20.2822720419177
88.0340392131129
-0.764223218423335
-14.6122541780574
79.7837625204481
-36.5428412418813
-237.021493576675
-174.939330173721
-22.0023004879113
-130.222163981712
-81.261138877866
134.711755886442
-82.8684507154044
-29.0665411441489
-168.373147153340
-75.7934364677778
231.573355758700
10.5257708465936
34.1831847223823
-3.42126452514594
90.5167083943015
3.54323822444849
21.2437082449437
45.9491413265973
6.42691770234615
148.926383148560
42.4033763780330
-53.2562852977862
76.9884042382046
-87.0100149566779
70.3634919614096
-24.4361955701665
54.2674834085906
131.626984327138
67.1077257925444
63.7412142109793
47.1514215605353
41.2415232832441
82.4444452691432
-3.01644933015541
8.96148556804428
-61.5822460842246
54.6770862065341
50.5830873528589
77.214672996627
-7.52009097378914
15.8170971135414
63.2839770964242
109.442579101892
134.975353075361
97.128477271874
65.8806610189854
-49.9515382614236
-83.700991320909
-202.870563477779
199.880265140557
110.275737196339
64.4380743788802
140.595604209316
12.3518744624025
78.6281741817593
126.224479891767
14.526749364225
-158.024402561056
281.5043249344
26.040275528886
-97.7970442577525
-31.9215461144086
-345.626097871835
204.622197336348
94.3526795364023
-367.402641989132
119.749065878547
-290.469069910870
-35.9367857193442
-19.8467729295458
194.155786460361
-115.322768200005
-271.036765007927
-382.496818512529
149.807767986098


Parameters (Session):
par1 = FALSE ; par2 = 1 ; par3 = 1 ; par4 = 0 ; par5 = 12 ; par6 = 3 ; par7 = 1 ; par8 = 0 ; par9 = 0 ;
Parameters (R input):
par1 = FALSE ; par2 = 1 ; par3 = 1 ; par4 = 0 ; par5 = 12 ; par6 = 3 ; par7 = 1 ; par8 = 0 ; par9 = 0 ;
R code (references can be found in the software module):
library(lattice)
if (par1 == 'TRUE') par1 <- TRUE
if (par1 == 'FALSE') par1 <- FALSE
par2 <- as.numeric(par2) #Box-Cox lambda transformation parameter
par3 <- as.numeric(par3) #degree of non-seasonal differencing
par4 <- as.numeric(par4) #degree of seasonal differencing
par5 <- as.numeric(par5) #seasonal period
par6 <- as.numeric(par6) #degree (p) of the non-seasonal AR(p) polynomial
par7 <- as.numeric(par7) #degree (q) of the non-seasonal MA(q) polynomial
par8 <- as.numeric(par8) #degree (P) of the seasonal AR(P) polynomial
par9 <- as.numeric(par9) #degree (Q) of the seasonal MA(Q) polynomial
armaGR <- function(arima.out, names, n){
try1 <- arima.out$coef
try2 <- sqrt(diag(arima.out$var.coef))
try.data.frame <- data.frame(matrix(NA,ncol=4,nrow=length(names)))
dimnames(try.data.frame) <- list(names,c('coef','std','tstat','pv'))
try.data.frame[,1] <- try1
for(i in 1:length(try2)) try.data.frame[which(rownames(try.data.frame)==names(try2)[i]),2] <- try2[i]
try.data.frame[,3] <- try.data.frame[,1] / try.data.frame[,2]
try.data.frame[,4] <- round((1-pt(abs(try.data.frame[,3]),df=n-(length(try2)+1)))*2,5)
vector <- rep(NA,length(names))
vector[is.na(try.data.frame[,4])] <- 0
maxi <- which.max(try.data.frame[,4])
continue <- max(try.data.frame[,4],na.rm=TRUE) > .05
vector[maxi] <- 0
list(summary=try.data.frame,next.vector=vector,continue=continue)
}
arimaSelect <- function(series, order=c(13,0,0), seasonal=list(order=c(2,0,0),period=12), include.mean=F){
nrc <- order[1]+order[3]+seasonal$order[1]+seasonal$order[3]
coeff <- matrix(NA, nrow=nrc*2, ncol=nrc)
pval <- matrix(NA, nrow=nrc*2, ncol=nrc)
mylist <- rep(list(NULL), nrc)
names <- NULL
if(order[1] > 0) names <- paste('ar',1:order[1],sep='')
if(order[3] > 0) names <- c( names , paste('ma',1:order[3],sep='') )
if(seasonal$order[1] > 0) names <- c(names, paste('sar',1:seasonal$order[1],sep=''))
if(seasonal$order[3] > 0) names <- c(names, paste('sma',1:seasonal$order[3],sep=''))
arima.out <- arima(series, order=order, seasonal=seasonal, include.mean=include.mean, method='ML')
mylist[[1]] <- arima.out
last.arma <- armaGR(arima.out, names, length(series))
mystop <- FALSE
i <- 1
coeff[i,] <- last.arma[[1]][,1]
pval [i,] <- last.arma[[1]][,4]
i <- 2
aic <- arima.out$aic
while(!mystop){
mylist[[i]] <- arima.out
arima.out <- arima(series, order=order, seasonal=seasonal, include.mean=include.mean, method='ML', fixed=last.arma$next.vector)
aic <- c(aic, arima.out$aic)
last.arma <- armaGR(arima.out, names, length(series))
mystop <- !last.arma$continue
coeff[i,] <- last.arma[[1]][,1]
pval [i,] <- last.arma[[1]][,4]
i <- i+1
}
list(coeff, pval, mylist, aic=aic)
}
arimaSelectplot <- function(arimaSelect.out,noms,choix){
noms <- names(arimaSelect.out[[3]][[1]]$coef)
coeff <- arimaSelect.out[[1]]
k <- min(which(is.na(coeff[,1])))-1
coeff <- coeff[1:k,]
pval <- arimaSelect.out[[2]][1:k,]
aic <- arimaSelect.out$aic[1:k]
coeff[coeff==0] <- NA
n <- ncol(coeff)
if(missing(choix)) choix <- k
layout(matrix(c(1,1,1,2,
3,3,3,2,
3,3,3,4,
5,6,7,7),nr=4),
widths=c(10,35,45,15),
heights=c(30,30,15,15))
couleurs <- rainbow(75)[1:50]#(50)
ticks <- pretty(coeff)
par(mar=c(1,1,3,1))
plot(aic,k:1-.5,type='o',pch=21,bg='blue',cex=2,axes=F,lty=2,xpd=NA)
points(aic[choix],k-choix+.5,pch=21,cex=4,bg=2,xpd=NA)
title('aic',line=2)
par(mar=c(3,0,0,0))
plot(0,axes=F,xlab='',ylab='',xlim=range(ticks),ylim=c(.1,1))
rect(xleft = min(ticks) + (0:49)/50*(max(ticks)-min(ticks)),
xright = min(ticks) + (1:50)/50*(max(ticks)-min(ticks)),
ytop = rep(1,50),
ybottom= rep(0,50),col=couleurs,border=NA)
axis(1,ticks)
rect(xleft=min(ticks),xright=max(ticks),ytop=1,ybottom=0)
text(mean(coeff,na.rm=T),.5,'coefficients',cex=2,font=2)
par(mar=c(1,1,3,1))
image(1:n,1:k,t(coeff[k:1,]),axes=F,col=couleurs,zlim=range(ticks))
for(i in 1:n) for(j in 1:k) if(!is.na(coeff[j,i])) {
if(pval[j,i]<.01) symb = 'green'
else if( (pval[j,i]<.05) & (pval[j,i]>=.01)) symb = 'orange'
else if( (pval[j,i]<.1) & (pval[j,i]>=.05)) symb = 'red'
else symb = 'black'
polygon(c(i+.5 ,i+.2 ,i+.5 ,i+.5),
c(k-j+0.5,k-j+0.5,k-j+0.8,k-j+0.5),
col=symb)
if(j==choix) {
rect(xleft=i-.5,
xright=i+.5,
ybottom=k-j+1.5,
ytop=k-j+.5,
lwd=4)
text(i,
k-j+1,
round(coeff[j,i],2),
cex=1.2,
font=2)
}
else{
rect(xleft=i-.5,xright=i+.5,ybottom=k-j+1.5,ytop=k-j+.5)
text(i,k-j+1,round(coeff[j,i],2),cex=1.2,font=1)
}
}
axis(3,1:n,noms)
par(mar=c(0.5,0,0,0.5))
plot(0,axes=F,xlab='',ylab='',type='n',xlim=c(0,8),ylim=c(-.2,.8))
cols <- c('green','orange','red','black')
niv <- c('0','0.01','0.05','0.1')
for(i in 0:3){
polygon(c(1+2*i ,1+2*i ,1+2*i-.5 ,1+2*i),
c(.4 ,.7 , .4 , .4),
col=cols[i+1])
text(2*i,0.5,niv[i+1],cex=1.5)
}
text(8,.5,1,cex=1.5)
text(4,0,'p-value',cex=2)
box()
residus <- arimaSelect.out[[3]][[choix]]$res
par(mar=c(1,2,4,1))
acf(residus,main='')
title('acf',line=.5)
par(mar=c(1,2,4,1))
pacf(residus,main='')
title('pacf',line=.5)
par(mar=c(2,2,4,1))
qqnorm(residus,main='')
title('qq-norm',line=.5)
qqline(residus)
residus
}
if (par2 == 0) x <- log(x)
if (par2 != 0) x <- x^par2
(selection <- arimaSelect(x, order=c(par6,par3,par7), seasonal=list(order=c(par8,par4,par9), period=par5)))
bitmap(file='test1.png')
resid <- arimaSelectplot(selection)
dev.off()
resid
bitmap(file='test2.png')
acf(resid,length(resid)/2, main='Residual Autocorrelation Function')
dev.off()
bitmap(file='test3.png')
pacf(resid,length(resid)/2, main='Residual Partial Autocorrelation Function')
dev.off()
bitmap(file='test4.png')
cpgram(resid, main='Residual Cumulative Periodogram')
dev.off()
bitmap(file='test5.png')
hist(resid, main='Residual Histogram', xlab='values of Residuals')
dev.off()
bitmap(file='test6.png')
densityplot(~resid,col='black',main='Residual Density Plot', xlab='values of Residuals')
dev.off()
bitmap(file='test7.png')
qqnorm(resid, main='Residual Normal Q-Q Plot')
qqline(resid)
dev.off()
ncols <- length(selection[[1]][1,])
nrows <- length(selection[[2]][,1])-1
load(file='createtable')
a<-table.start()
a<-table.row.start(a)
a<-table.element(a,'ARIMA Parameter Estimation and Backward Selection', ncols+1,TRUE)
a<-table.row.end(a)
a<-table.row.start(a)
a<-table.element(a,'Iteration', header=TRUE)
for (i in 1:ncols) {
a<-table.element(a,names(selection[[3]][[1]]$coef)[i],header=TRUE)
}
a<-table.row.end(a)
for (j in 1:nrows) {
a<-table.row.start(a)
mydum <- 'Estimates ('
mydum <- paste(mydum,j)
mydum <- paste(mydum,')')
a<-table.element(a,mydum, header=TRUE)
for (i in 1:ncols) {
a<-table.element(a,round(selection[[1]][j,i],4))
}
a<-table.row.end(a)
a<-table.row.start(a)
a<-table.element(a,'(p-val)', header=TRUE)
for (i in 1:ncols) {
mydum <- '('
mydum <- paste(mydum,round(selection[[2]][j,i],4),sep='')
mydum <- paste(mydum,')')
a<-table.element(a,mydum)
}
a<-table.row.end(a)
}
a<-table.end(a)
table.save(a,file='mytable.tab')
a<-table.start()
a<-table.row.start(a)
a<-table.element(a,'Estimated ARIMA Residuals', 1,TRUE)
a<-table.row.end(a)
a<-table.row.start(a)
a<-table.element(a,'Value', 1,TRUE)
a<-table.row.end(a)
for (i in (par4*par5+par3):length(resid)) {
a<-table.row.start(a)
a<-table.element(a,resid[i])
a<-table.row.end(a)
}
a<-table.end(a)
table.save(a,file='mytable1.tab')