Free Statistics

of Irreproducible Research!

Author's title

Author*The author of this computation has been verified*
R Software Modulerwasp_correlation.wasp
Title produced by softwarePearson Correlation
Date of computationSun, 14 Dec 2008 07:50:17 -0700
Cite this page as followsStatistical Computations at FreeStatistics.org, Office for Research Development and Education, URL https://freestatistics.org/blog/index.php?v=date/2008/Dec/14/t12292662681t7esq6vvi4292y.htm/, Retrieved Wed, 15 May 2024 14:45:23 +0000
Statistical Computations at FreeStatistics.org, Office for Research Development and Education, URL https://freestatistics.org/blog/index.php?pk=33403, Retrieved Wed, 15 May 2024 14:45:23 +0000
QR Codes:

Original text written by user:
IsPrivate?No (this computation is public)
User-defined keywords
Estimated Impact150
Family? (F = Feedback message, R = changed R code, M = changed R Module, P = changed Parameters, D = changed Data)
-       [Pearson Correlation] [Paper - pearson -...] [2008-12-14 14:50:17] [73ec5abea95a9c3c8c3a1ac44cab1f72] [Current]
Feedback Forum

Post a new message
Dataseries X:
1529
2186
3069
3252
3541
3435
2320
3285
2681
3019
3833
3472
2971
2770
3060
4124
3282
3772
1500
2844
3449
4356
3150
2425
1212
1328
2097
2167
2773
2368
1387
2478
2702
3349
3114
3394
1249
2155
2188
2363
2040
2144
1440
2485
2904
2452
2855
3966
1621
1717
2370
1849
2262
2494
2010
1901
2027
1769
1271
1571
Dataseries Y:
458
582
597
729
812
697
545
677
598
701
956
971
967
683
611
955
782
877
399
615
906
1324
952
710
288
312
313
387
540
465
282
389
488
803
1050
1027
332
466
353
345
341
354
287
379
533
534
578
991
366
254
449
349
532
590
469
362
424
372
253
462


Summary of computational transaction
Raw Inputview raw input (R code)
Raw Outputview raw output of R engine
Computing time2 seconds
R Server'Sir Ronald Aylmer Fisher' @ 193.190.124.24

\begin{tabular}{lllllllll}
\hline
Summary of computational transaction \tabularnewline
Raw Input & view raw input (R code)  \tabularnewline
Raw Output & view raw output of R engine  \tabularnewline
Computing time & 2 seconds \tabularnewline
R Server & 'Sir Ronald Aylmer Fisher' @ 193.190.124.24 \tabularnewline
\hline
\end{tabular}
%Source: https://freestatistics.org/blog/index.php?pk=33403&T=0

[TABLE]
[ROW][C]Summary of computational transaction[/C][/ROW]
[ROW][C]Raw Input[/C][C]view raw input (R code) [/C][/ROW]
[ROW][C]Raw Output[/C][C]view raw output of R engine [/C][/ROW]
[ROW][C]Computing time[/C][C]2 seconds[/C][/ROW]
[ROW][C]R Server[/C][C]'Sir Ronald Aylmer Fisher' @ 193.190.124.24[/C][/ROW]
[/TABLE]
Source: https://freestatistics.org/blog/index.php?pk=33403&T=0

Globally Unique Identifier (entire table): ba.freestatistics.org/blog/index.php?pk=33403&T=0

As an alternative you can also use a QR Code:  

The GUIDs for individual cells are displayed in the table below:

Summary of computational transaction
Raw Inputview raw input (R code)
Raw Outputview raw output of R engine
Computing time2 seconds
R Server'Sir Ronald Aylmer Fisher' @ 193.190.124.24


Pearson Product Moment Correlation - Ungrouped Data
StatisticVariable XVariable Y
Mean2546.61666666667580.383333333333
Biased Variance611485.30305555660861.3697222222
Biased Standard Deviation781.975257316723246.700972276605
Covariance173794.742655367
Correlation0.885877197908054
Determination0.784778409773425
T-Test14.5426851617005
p-value (2 sided)0
p-value (1 sided)0
Degrees of Freedom58
Number of Observations60

\begin{tabular}{lllllllll}
\hline
Pearson Product Moment Correlation - Ungrouped Data \tabularnewline
Statistic & Variable X & Variable Y \tabularnewline
Mean & 2546.61666666667 & 580.383333333333 \tabularnewline
Biased Variance & 611485.303055556 & 60861.3697222222 \tabularnewline
Biased Standard Deviation & 781.975257316723 & 246.700972276605 \tabularnewline
Covariance & 173794.742655367 \tabularnewline
Correlation & 0.885877197908054 \tabularnewline
Determination & 0.784778409773425 \tabularnewline
T-Test & 14.5426851617005 \tabularnewline
p-value (2 sided) & 0 \tabularnewline
p-value (1 sided) & 0 \tabularnewline
Degrees of Freedom & 58 \tabularnewline
Number of Observations & 60 \tabularnewline
\hline
\end{tabular}
%Source: https://freestatistics.org/blog/index.php?pk=33403&T=1

[TABLE]
[ROW][C]Pearson Product Moment Correlation - Ungrouped Data[/C][/ROW]
[ROW][C]Statistic[/C][C]Variable X[/C][C]Variable Y[/C][/ROW]
[ROW][C]Mean[/C][C]2546.61666666667[/C][C]580.383333333333[/C][/ROW]
[ROW][C]Biased Variance[/C][C]611485.303055556[/C][C]60861.3697222222[/C][/ROW]
[ROW][C]Biased Standard Deviation[/C][C]781.975257316723[/C][C]246.700972276605[/C][/ROW]
[ROW][C]Covariance[/C][C]173794.742655367[/C][/ROW]
[ROW][C]Correlation[/C][C]0.885877197908054[/C][/ROW]
[ROW][C]Determination[/C][C]0.784778409773425[/C][/ROW]
[ROW][C]T-Test[/C][C]14.5426851617005[/C][/ROW]
[ROW][C]p-value (2 sided)[/C][C]0[/C][/ROW]
[ROW][C]p-value (1 sided)[/C][C]0[/C][/ROW]
[ROW][C]Degrees of Freedom[/C][C]58[/C][/ROW]
[ROW][C]Number of Observations[/C][C]60[/C][/ROW]
[/TABLE]
Source: https://freestatistics.org/blog/index.php?pk=33403&T=1

Globally Unique Identifier (entire table): ba.freestatistics.org/blog/index.php?pk=33403&T=1

As an alternative you can also use a QR Code:  

The GUIDs for individual cells are displayed in the table below:

Pearson Product Moment Correlation - Ungrouped Data
StatisticVariable XVariable Y
Mean2546.61666666667580.383333333333
Biased Variance611485.30305555660861.3697222222
Biased Standard Deviation781.975257316723246.700972276605
Covariance173794.742655367
Correlation0.885877197908054
Determination0.784778409773425
T-Test14.5426851617005
p-value (2 sided)0
p-value (1 sided)0
Degrees of Freedom58
Number of Observations60


Parameters (Session):
Parameters (R input):
R code (references can be found in the software module):
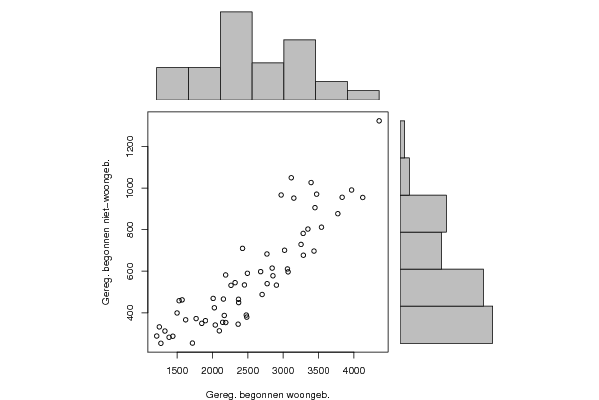
bitmap(file='test1.png')
histx <- hist(x, plot=FALSE)
histy <- hist(y, plot=FALSE)
maxcounts <- max(c(histx$counts, histx$counts))
xrange <- c(min(x),max(x))
yrange <- c(min(y),max(y))
nf <- layout(matrix(c(2,0,1,3),2,2,byrow=TRUE), c(3,1), c(1,3), TRUE)
par(mar=c(4,4,1,1))
plot(x, y, xlim=xrange, ylim=yrange, xlab=xlab, ylab=ylab)
par(mar=c(0,4,1,1))
barplot(histx$counts, axes=FALSE, ylim=c(0, maxcounts), space=0)
par(mar=c(4,0,1,1))
barplot(histy$counts, axes=FALSE, xlim=c(0, maxcounts), space=0, horiz=TRUE)
dev.off()
lx = length(x)
makebiased = (lx-1)/lx
varx = var(x)*makebiased
vary = var(y)*makebiased
corxy <- cor.test(x,y,method='pearson')
cxy <- as.matrix(corxy$estimate)[1,1]
load(file='createtable')
a<-table.start()
a<-table.row.start(a)
a<-table.element(a,'Pearson Product Moment Correlation - Ungrouped Data',3,TRUE)
a<-table.row.end(a)
a<-table.row.start(a)
a<-table.element(a,'Statistic',1,TRUE)
a<-table.element(a,'Variable X',1,TRUE)
a<-table.element(a,'Variable Y',1,TRUE)
a<-table.row.end(a)
a<-table.row.start(a)
a<-table.element(a,hyperlink('arithmetic_mean.htm','Mean',''),header=TRUE)
a<-table.element(a,mean(x))
a<-table.element(a,mean(y))
a<-table.row.end(a)
a<-table.row.start(a)
a<-table.element(a,hyperlink('biased.htm','Biased Variance',''),header=TRUE)
a<-table.element(a,varx)
a<-table.element(a,vary)
a<-table.row.end(a)
a<-table.row.start(a)
a<-table.element(a,hyperlink('biased1.htm','Biased Standard Deviation',''),header=TRUE)
a<-table.element(a,sqrt(varx))
a<-table.element(a,sqrt(vary))
a<-table.row.end(a)
a<-table.row.start(a)
a<-table.element(a,hyperlink('covariance.htm','Covariance',''),header=TRUE)
a<-table.element(a,cov(x,y),2)
a<-table.row.end(a)
a<-table.row.start(a)
a<-table.element(a,hyperlink('pearson_correlation.htm','Correlation',''),header=TRUE)
a<-table.element(a,cxy,2)
a<-table.row.end(a)
a<-table.row.start(a)
a<-table.element(a,hyperlink('coeff_of_determination.htm','Determination',''),header=TRUE)
a<-table.element(a,cxy*cxy,2)
a<-table.row.end(a)
a<-table.row.start(a)
a<-table.element(a,hyperlink('ttest_statistic.htm','T-Test',''),header=TRUE)
a<-table.element(a,as.matrix(corxy$statistic)[1,1],2)
a<-table.row.end(a)
a<-table.row.start(a)
a<-table.element(a,'p-value (2 sided)',header=TRUE)
a<-table.element(a,(p2 <- as.matrix(corxy$p.value)[1,1]),2)
a<-table.row.end(a)
a<-table.row.start(a)
a<-table.element(a,'p-value (1 sided)',header=TRUE)
a<-table.element(a,p2/2,2)
a<-table.row.end(a)
a<-table.row.start(a)
a<-table.element(a,'Degrees of Freedom',header=TRUE)
a<-table.element(a,lx-2,2)
a<-table.row.end(a)
a<-table.row.start(a)
a<-table.element(a,'Number of Observations',header=TRUE)
a<-table.element(a,lx,2)
a<-table.row.end(a)
a<-table.end(a)
table.save(a,file='mytable.tab')