Free Statistics

of Irreproducible Research!

Author's title

Author*The author of this computation has been verified*
R Software Modulerwasp_smp.wasp
Title produced by softwareStandard Deviation-Mean Plot
Date of computationSun, 14 Dec 2008 07:42:45 -0700
Cite this page as followsStatistical Computations at FreeStatistics.org, Office for Research Development and Education, URL https://freestatistics.org/blog/index.php?v=date/2008/Dec/14/t1229265937t3ytj7izthz8doy.htm/, Retrieved Wed, 15 May 2024 12:47:54 +0000
Statistical Computations at FreeStatistics.org, Office for Research Development and Education, URL https://freestatistics.org/blog/index.php?pk=33401, Retrieved Wed, 15 May 2024 12:47:54 +0000
QR Codes:

Original text written by user:
IsPrivate?No (this computation is public)
User-defined keywords
Estimated Impact159
Family? (F = Feedback message, R = changed R code, M = changed R Module, P = changed Parameters, D = changed Data)
-       [Standard Deviation-Mean Plot] [SD mean plot: wer...] [2008-12-14 14:42:45] [5925747fb2a6bb4cfcd8015825ee5e92] [Current]
Feedback Forum

Post a new message
Dataseries X:
180144
173666
165688
161570
156145
153730
182698
200765
176512
166618
158644
159585
163095
159044
155511
153745
150569
150605
179612
194690
189917
184128
175335
179566
181140
177876
175041
169292
166070
166972
206348
215706
202108
195411
193111
195198
198770
194163
190420
189733
186029
191531
232571
243477
227247
217859
208679
213188
216234
213586
209465
204045
200237
203666
241476
260307
243324
244460
233575
237217
235243
230354
227184
221678
217142
219452
256446
265845
248624
241114
229245
231805
219277
219313
212610
214771
211142
211457
240048
240636
230580
208795
197922
194596


Summary of computational transaction
Raw Inputview raw input (R code)
Raw Outputview raw output of R engine
Computing time2 seconds
R Server'Sir Ronald Aylmer Fisher' @ 193.190.124.24

\begin{tabular}{lllllllll}
\hline
Summary of computational transaction \tabularnewline
Raw Input & view raw input (R code)  \tabularnewline
Raw Output & view raw output of R engine  \tabularnewline
Computing time & 2 seconds \tabularnewline
R Server & 'Sir Ronald Aylmer Fisher' @ 193.190.124.24 \tabularnewline
\hline
\end{tabular}
%Source: https://freestatistics.org/blog/index.php?pk=33401&T=0

[TABLE]
[ROW][C]Summary of computational transaction[/C][/ROW]
[ROW][C]Raw Input[/C][C]view raw input (R code) [/C][/ROW]
[ROW][C]Raw Output[/C][C]view raw output of R engine [/C][/ROW]
[ROW][C]Computing time[/C][C]2 seconds[/C][/ROW]
[ROW][C]R Server[/C][C]'Sir Ronald Aylmer Fisher' @ 193.190.124.24[/C][/ROW]
[/TABLE]
Source: https://freestatistics.org/blog/index.php?pk=33401&T=0

Globally Unique Identifier (entire table): ba.freestatistics.org/blog/index.php?pk=33401&T=0

As an alternative you can also use a QR Code:  

The GUIDs for individual cells are displayed in the table below:

Summary of computational transaction
Raw Inputview raw input (R code)
Raw Outputview raw output of R engine
Computing time2 seconds
R Server'Sir Ronald Aylmer Fisher' @ 193.190.124.24


Standard Deviation-Mean Plot
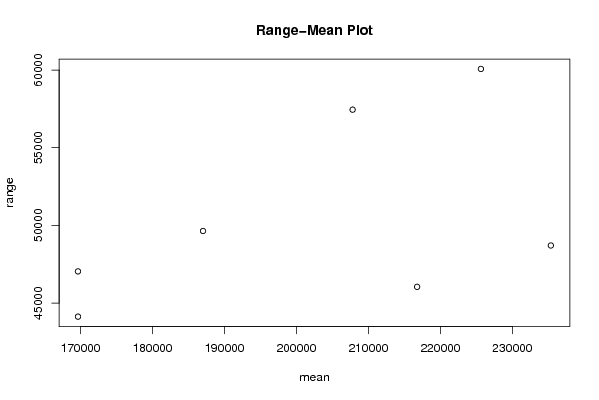
SectionMeanStandard DeviationRange
1169647.08333333313685.351548002947035
2169651.41666666715989.727574337144121
3187022.7516556.473724937549636
4207805.58333333319141.267249101257448
5225632.66666666720014.544794557160070
6235344.33333333315066.829764469948703
7216762.2514480.885445837046040

\begin{tabular}{lllllllll}
\hline
Standard Deviation-Mean Plot \tabularnewline
Section & Mean & Standard Deviation & Range \tabularnewline
1 & 169647.083333333 & 13685.3515480029 & 47035 \tabularnewline
2 & 169651.416666667 & 15989.7275743371 & 44121 \tabularnewline
3 & 187022.75 & 16556.4737249375 & 49636 \tabularnewline
4 & 207805.583333333 & 19141.2672491012 & 57448 \tabularnewline
5 & 225632.666666667 & 20014.5447945571 & 60070 \tabularnewline
6 & 235344.333333333 & 15066.8297644699 & 48703 \tabularnewline
7 & 216762.25 & 14480.8854458370 & 46040 \tabularnewline
\hline
\end{tabular}
%Source: https://freestatistics.org/blog/index.php?pk=33401&T=1

[TABLE]
[ROW][C]Standard Deviation-Mean Plot[/C][/ROW]
[ROW][C]Section[/C][C]Mean[/C][C]Standard Deviation[/C][C]Range[/C][/ROW]
[ROW][C]1[/C][C]169647.083333333[/C][C]13685.3515480029[/C][C]47035[/C][/ROW]
[ROW][C]2[/C][C]169651.416666667[/C][C]15989.7275743371[/C][C]44121[/C][/ROW]
[ROW][C]3[/C][C]187022.75[/C][C]16556.4737249375[/C][C]49636[/C][/ROW]
[ROW][C]4[/C][C]207805.583333333[/C][C]19141.2672491012[/C][C]57448[/C][/ROW]
[ROW][C]5[/C][C]225632.666666667[/C][C]20014.5447945571[/C][C]60070[/C][/ROW]
[ROW][C]6[/C][C]235344.333333333[/C][C]15066.8297644699[/C][C]48703[/C][/ROW]
[ROW][C]7[/C][C]216762.25[/C][C]14480.8854458370[/C][C]46040[/C][/ROW]
[/TABLE]
Source: https://freestatistics.org/blog/index.php?pk=33401&T=1

Globally Unique Identifier (entire table): ba.freestatistics.org/blog/index.php?pk=33401&T=1

As an alternative you can also use a QR Code:  

The GUIDs for individual cells are displayed in the table below:

Standard Deviation-Mean Plot
SectionMeanStandard DeviationRange
1169647.08333333313685.351548002947035
2169651.41666666715989.727574337144121
3187022.7516556.473724937549636
4207805.58333333319141.267249101257448
5225632.66666666720014.544794557160070
6235344.33333333315066.829764469948703
7216762.2514480.885445837046040


Regression: S.E.(k) = alpha + beta * Mean(k)
alpha10359.6658370255
beta0.0300435145675568
S.D.0.0374807412885884
T-STAT0.801572048328298
p-value0.459183046267689

\begin{tabular}{lllllllll}
\hline
Regression: S.E.(k) = alpha + beta * Mean(k) \tabularnewline
alpha & 10359.6658370255 \tabularnewline
beta & 0.0300435145675568 \tabularnewline
S.D. & 0.0374807412885884 \tabularnewline
T-STAT & 0.801572048328298 \tabularnewline
p-value & 0.459183046267689 \tabularnewline
\hline
\end{tabular}
%Source: https://freestatistics.org/blog/index.php?pk=33401&T=2

[TABLE]
[ROW][C]Regression: S.E.(k) = alpha + beta * Mean(k)[/C][/ROW]
[ROW][C]alpha[/C][C]10359.6658370255[/C][/ROW]
[ROW][C]beta[/C][C]0.0300435145675568[/C][/ROW]
[ROW][C]S.D.[/C][C]0.0374807412885884[/C][/ROW]
[ROW][C]T-STAT[/C][C]0.801572048328298[/C][/ROW]
[ROW][C]p-value[/C][C]0.459183046267689[/C][/ROW]
[/TABLE]
Source: https://freestatistics.org/blog/index.php?pk=33401&T=2

Globally Unique Identifier (entire table): ba.freestatistics.org/blog/index.php?pk=33401&T=2

As an alternative you can also use a QR Code:  

The GUIDs for individual cells are displayed in the table below:

Regression: S.E.(k) = alpha + beta * Mean(k)
alpha10359.6658370255
beta0.0300435145675568
S.D.0.0374807412885884
T-STAT0.801572048328298
p-value0.459183046267689


Regression: ln S.E.(k) = alpha + beta * ln Mean(k)
alpha5.21989803190727
beta0.366814375124703
S.D.0.441365014029502
T-STAT0.831090737745207
p-value0.443785590477415
Lambda0.633185624875297

\begin{tabular}{lllllllll}
\hline
Regression: ln S.E.(k) = alpha + beta * ln Mean(k) \tabularnewline
alpha & 5.21989803190727 \tabularnewline
beta & 0.366814375124703 \tabularnewline
S.D. & 0.441365014029502 \tabularnewline
T-STAT & 0.831090737745207 \tabularnewline
p-value & 0.443785590477415 \tabularnewline
Lambda & 0.633185624875297 \tabularnewline
\hline
\end{tabular}
%Source: https://freestatistics.org/blog/index.php?pk=33401&T=3

[TABLE]
[ROW][C]Regression: ln S.E.(k) = alpha + beta * ln Mean(k)[/C][/ROW]
[ROW][C]alpha[/C][C]5.21989803190727[/C][/ROW]
[ROW][C]beta[/C][C]0.366814375124703[/C][/ROW]
[ROW][C]S.D.[/C][C]0.441365014029502[/C][/ROW]
[ROW][C]T-STAT[/C][C]0.831090737745207[/C][/ROW]
[ROW][C]p-value[/C][C]0.443785590477415[/C][/ROW]
[ROW][C]Lambda[/C][C]0.633185624875297[/C][/ROW]
[/TABLE]
Source: https://freestatistics.org/blog/index.php?pk=33401&T=3

Globally Unique Identifier (entire table): ba.freestatistics.org/blog/index.php?pk=33401&T=3

As an alternative you can also use a QR Code:  

The GUIDs for individual cells are displayed in the table below:

Regression: ln S.E.(k) = alpha + beta * ln Mean(k)
alpha5.21989803190727
beta0.366814375124703
S.D.0.441365014029502
T-STAT0.831090737745207
p-value0.443785590477415
Lambda0.633185624875297


Parameters (Session):
par1 = 12 ;
Parameters (R input):
par1 = 12 ;
R code (references can be found in the software module):
par1 <- as.numeric(par1)
(n <- length(x))
(np <- floor(n / par1))
arr <- array(NA,dim=c(par1,np))
j <- 0
k <- 1
for (i in 1:(np*par1))
{
j = j + 1
arr[j,k] <- x[i]
if (j == par1) {
j = 0
k=k+1
}
}
arr
arr.mean <- array(NA,dim=np)
arr.sd <- array(NA,dim=np)
arr.range <- array(NA,dim=np)
for (j in 1:np)
{
arr.mean[j] <- mean(arr[,j],na.rm=TRUE)
arr.sd[j] <- sd(arr[,j],na.rm=TRUE)
arr.range[j] <- max(arr[,j],na.rm=TRUE) - min(arr[,j],na.rm=TRUE)
}
arr.mean
arr.sd
arr.range
(lm1 <- lm(arr.sd~arr.mean))
(lnlm1 <- lm(log(arr.sd)~log(arr.mean)))
(lm2 <- lm(arr.range~arr.mean))
bitmap(file='test1.png')
plot(arr.mean,arr.sd,main='Standard Deviation-Mean Plot',xlab='mean',ylab='standard deviation')
dev.off()
bitmap(file='test2.png')
plot(arr.mean,arr.range,main='Range-Mean Plot',xlab='mean',ylab='range')
dev.off()
load(file='createtable')
a<-table.start()
a<-table.row.start(a)
a<-table.element(a,'Standard Deviation-Mean Plot',4,TRUE)
a<-table.row.end(a)
a<-table.row.start(a)
a<-table.element(a,'Section',header=TRUE)
a<-table.element(a,'Mean',header=TRUE)
a<-table.element(a,'Standard Deviation',header=TRUE)
a<-table.element(a,'Range',header=TRUE)
a<-table.row.end(a)
for (j in 1:np) {
a<-table.row.start(a)
a<-table.element(a,j,header=TRUE)
a<-table.element(a,arr.mean[j])
a<-table.element(a,arr.sd[j] )
a<-table.element(a,arr.range[j] )
a<-table.row.end(a)
}
a<-table.end(a)
table.save(a,file='mytable.tab')
a<-table.start()
a<-table.row.start(a)
a<-table.element(a,'Regression: S.E.(k) = alpha + beta * Mean(k)',2,TRUE)
a<-table.row.end(a)
a<-table.row.start(a)
a<-table.element(a,'alpha',header=TRUE)
a<-table.element(a,lm1$coefficients[[1]])
a<-table.row.end(a)
a<-table.row.start(a)
a<-table.element(a,'beta',header=TRUE)
a<-table.element(a,lm1$coefficients[[2]])
a<-table.row.end(a)
a<-table.row.start(a)
a<-table.element(a,'S.D.',header=TRUE)
a<-table.element(a,summary(lm1)$coefficients[2,2])
a<-table.row.end(a)
a<-table.row.start(a)
a<-table.element(a,'T-STAT',header=TRUE)
a<-table.element(a,summary(lm1)$coefficients[2,3])
a<-table.row.end(a)
a<-table.row.start(a)
a<-table.element(a,'p-value',header=TRUE)
a<-table.element(a,summary(lm1)$coefficients[2,4])
a<-table.row.end(a)
a<-table.end(a)
table.save(a,file='mytable1.tab')
a<-table.start()
a<-table.row.start(a)
a<-table.element(a,'Regression: ln S.E.(k) = alpha + beta * ln Mean(k)',2,TRUE)
a<-table.row.end(a)
a<-table.row.start(a)
a<-table.element(a,'alpha',header=TRUE)
a<-table.element(a,lnlm1$coefficients[[1]])
a<-table.row.end(a)
a<-table.row.start(a)
a<-table.element(a,'beta',header=TRUE)
a<-table.element(a,lnlm1$coefficients[[2]])
a<-table.row.end(a)
a<-table.row.start(a)
a<-table.element(a,'S.D.',header=TRUE)
a<-table.element(a,summary(lnlm1)$coefficients[2,2])
a<-table.row.end(a)
a<-table.row.start(a)
a<-table.element(a,'T-STAT',header=TRUE)
a<-table.element(a,summary(lnlm1)$coefficients[2,3])
a<-table.row.end(a)
a<-table.row.start(a)
a<-table.element(a,'p-value',header=TRUE)
a<-table.element(a,summary(lnlm1)$coefficients[2,4])
a<-table.row.end(a)
a<-table.row.start(a)
a<-table.element(a,'Lambda',header=TRUE)
a<-table.element(a,1-lnlm1$coefficients[[2]])
a<-table.row.end(a)
a<-table.end(a)
table.save(a,file='mytable2.tab')