Free Statistics

of Irreproducible Research!

Author's title

Author*Unverified author*
R Software Modulerwasp_arimaforecasting.wasp
Title produced by softwareARIMA Forecasting
Date of computationSun, 14 Dec 2008 07:38:11 -0700
Cite this page as followsStatistical Computations at FreeStatistics.org, Office for Research Development and Education, URL https://freestatistics.org/blog/index.php?v=date/2008/Dec/14/t1229265596s8j08ymve1inj2d.htm/, Retrieved Wed, 15 May 2024 14:46:27 +0000
Statistical Computations at FreeStatistics.org, Office for Research Development and Education, URL https://freestatistics.org/blog/index.php?pk=33400, Retrieved Wed, 15 May 2024 14:46:27 +0000
QR Codes:

Original text written by user:
IsPrivate?No (this computation is public)
User-defined keywords
Estimated Impact135
Family? (F = Feedback message, R = changed R code, M = changed R Module, P = changed Parameters, D = changed Data)
-       [ARIMA Forecasting] [step 2] [2008-12-14 14:38:11] [d41d8cd98f00b204e9800998ecf8427e] [Current]
Feedback Forum

Post a new message
Dataseries X:
6340.5
7901.5
8191.1
7181.7
7594.4
7384.7
7876.7
8463.4
8317.2
7778.7
8532.8
7272.2
6680.1
8427.6
8752.8
7952.7
8694.3
7787
8474.2
9154.7
8557.2
7951.1
9156.7
7865.7
7337.4
9131.7
8814.6
8598.8
8439.6
7451.8
8016.2
9544.1
8270.7
8102.2
9369
7657.7
7816.6
9391.3
9445.4
9533.1
10068.7
8955.5
10423.9
11617.2
9391.1
10872
10230.4
9221
9428.6
10934.5
10986
11724.6
11180.9
11163.2
11240.9
12107.1
10762.3
11340.4
11266.8
9542.7
9227.7
10571.9
10774.4
10392.8
9920.2
9884.9
10174.5
11395.4
10760.2
10570.1
10536
9902.6
8889
10837.3
11624.1
10509
10984.9
10649.1
10855.7
11677.4
10760.2
10046.2
10772.8
9987.7
8638.7
11063.7
11855.7
10684.5
11337.4
10478
11123.9
12909.3
11339.9
10462.2
12733.5
10519.2
10414.9
12476.8
12384.6
12266.7
12919.9
11497.3
12142
13919.4
12656.8
12034.1
13199.7
10881.3
11301.2
13643.9
12517
13981.1
14275.7
13435
13565.7
16216.3
12970
14079.9
14235
12213.4
12581


Summary of computational transaction
Raw Inputview raw input (R code)
Raw Outputview raw output of R engine
Computing time2 seconds
R Server'Sir Ronald Aylmer Fisher' @ 193.190.124.24

\begin{tabular}{lllllllll}
\hline
Summary of computational transaction \tabularnewline
Raw Input & view raw input (R code)  \tabularnewline
Raw Output & view raw output of R engine  \tabularnewline
Computing time & 2 seconds \tabularnewline
R Server & 'Sir Ronald Aylmer Fisher' @ 193.190.124.24 \tabularnewline
\hline
\end{tabular}
%Source: https://freestatistics.org/blog/index.php?pk=33400&T=0

[TABLE]
[ROW][C]Summary of computational transaction[/C][/ROW]
[ROW][C]Raw Input[/C][C]view raw input (R code) [/C][/ROW]
[ROW][C]Raw Output[/C][C]view raw output of R engine [/C][/ROW]
[ROW][C]Computing time[/C][C]2 seconds[/C][/ROW]
[ROW][C]R Server[/C][C]'Sir Ronald Aylmer Fisher' @ 193.190.124.24[/C][/ROW]
[/TABLE]
Source: https://freestatistics.org/blog/index.php?pk=33400&T=0

Globally Unique Identifier (entire table): ba.freestatistics.org/blog/index.php?pk=33400&T=0

As an alternative you can also use a QR Code:  

The GUIDs for individual cells are displayed in the table below:

Summary of computational transaction
Raw Inputview raw input (R code)
Raw Outputview raw output of R engine
Computing time2 seconds
R Server'Sir Ronald Aylmer Fisher' @ 193.190.124.24


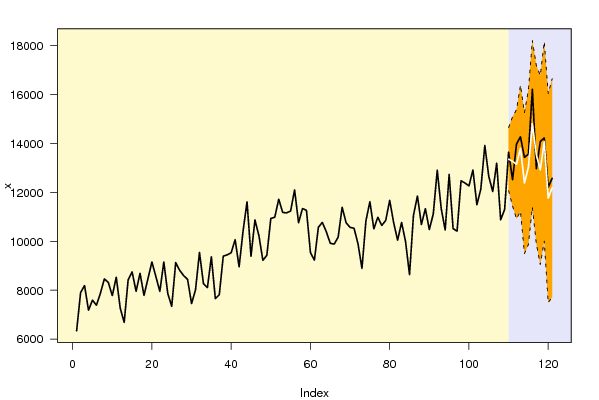
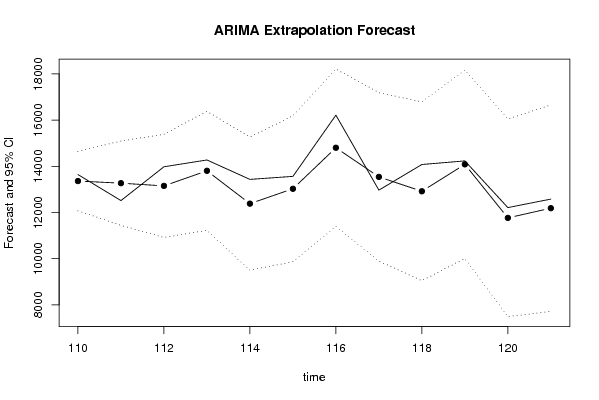
Univariate ARIMA Extrapolation Forecast
timeY[t]F[t]95% LB95% UBp-value(H0: Y[t] = F[t])P(F[t]>Y[t-1])P(F[t]>Y[t-s])P(F[t]>Y[109])
9710414.9-------
9812476.8-------
9912384.6-------
10012266.7-------
10112919.9-------
10211497.3-------
10312142-------
10413919.4-------
10512656.8-------
10612034.1-------
10713199.7-------
10810881.3-------
10911301.2-------
11013643.913363.112073.373914652.82610.33480.99910.9110.9991
1111251713270.911446.951915094.84810.20890.34430.82960.9829
11213981.11315310919.128915386.87110.23370.71160.78160.9479
11314275.713806.211226.747816385.65220.36060.44710.74970.9715
1141343512383.69499.684815267.51520.23740.09920.72650.769
11513565.713028.39869.129216187.47080.36940.40040.70880.858
11616216.314805.711393.405518217.99450.20890.76180.69470.9779
1171297013543.19895.203717190.99630.37910.07550.6830.8858
11814079.912920.49051.221716789.57830.27850.490.67330.794
119142351408610007.52818164.4720.47150.50120.66490.9096
12012213.411767.67490.062516045.13750.41910.12910.65770.5846
1211258112187.57719.757816655.24220.43150.49550.65130.6513

\begin{tabular}{lllllllll}
\hline
Univariate ARIMA Extrapolation Forecast \tabularnewline
time & Y[t] & F[t] & 95% LB & 95% UB & p-value(H0: Y[t] = F[t]) & P(F[t]>Y[t-1]) & P(F[t]>Y[t-s]) & P(F[t]>Y[109]) \tabularnewline
97 & 10414.9 & - & - & - & - & - & - & - \tabularnewline
98 & 12476.8 & - & - & - & - & - & - & - \tabularnewline
99 & 12384.6 & - & - & - & - & - & - & - \tabularnewline
100 & 12266.7 & - & - & - & - & - & - & - \tabularnewline
101 & 12919.9 & - & - & - & - & - & - & - \tabularnewline
102 & 11497.3 & - & - & - & - & - & - & - \tabularnewline
103 & 12142 & - & - & - & - & - & - & - \tabularnewline
104 & 13919.4 & - & - & - & - & - & - & - \tabularnewline
105 & 12656.8 & - & - & - & - & - & - & - \tabularnewline
106 & 12034.1 & - & - & - & - & - & - & - \tabularnewline
107 & 13199.7 & - & - & - & - & - & - & - \tabularnewline
108 & 10881.3 & - & - & - & - & - & - & - \tabularnewline
109 & 11301.2 & - & - & - & - & - & - & - \tabularnewline
110 & 13643.9 & 13363.1 & 12073.3739 & 14652.8261 & 0.3348 & 0.9991 & 0.911 & 0.9991 \tabularnewline
111 & 12517 & 13270.9 & 11446.9519 & 15094.8481 & 0.2089 & 0.3443 & 0.8296 & 0.9829 \tabularnewline
112 & 13981.1 & 13153 & 10919.1289 & 15386.8711 & 0.2337 & 0.7116 & 0.7816 & 0.9479 \tabularnewline
113 & 14275.7 & 13806.2 & 11226.7478 & 16385.6522 & 0.3606 & 0.4471 & 0.7497 & 0.9715 \tabularnewline
114 & 13435 & 12383.6 & 9499.6848 & 15267.5152 & 0.2374 & 0.0992 & 0.7265 & 0.769 \tabularnewline
115 & 13565.7 & 13028.3 & 9869.1292 & 16187.4708 & 0.3694 & 0.4004 & 0.7088 & 0.858 \tabularnewline
116 & 16216.3 & 14805.7 & 11393.4055 & 18217.9945 & 0.2089 & 0.7618 & 0.6947 & 0.9779 \tabularnewline
117 & 12970 & 13543.1 & 9895.2037 & 17190.9963 & 0.3791 & 0.0755 & 0.683 & 0.8858 \tabularnewline
118 & 14079.9 & 12920.4 & 9051.2217 & 16789.5783 & 0.2785 & 0.49 & 0.6733 & 0.794 \tabularnewline
119 & 14235 & 14086 & 10007.528 & 18164.472 & 0.4715 & 0.5012 & 0.6649 & 0.9096 \tabularnewline
120 & 12213.4 & 11767.6 & 7490.0625 & 16045.1375 & 0.4191 & 0.1291 & 0.6577 & 0.5846 \tabularnewline
121 & 12581 & 12187.5 & 7719.7578 & 16655.2422 & 0.4315 & 0.4955 & 0.6513 & 0.6513 \tabularnewline
\hline
\end{tabular}
%Source: https://freestatistics.org/blog/index.php?pk=33400&T=1

[TABLE]
[ROW][C]Univariate ARIMA Extrapolation Forecast[/C][/ROW]
[ROW][C]time[/C][C]Y[t][/C][C]F[t][/C][C]95% LB[/C][C]95% UB[/C][C]p-value(H0: Y[t] = F[t])[/C][C]P(F[t]>Y[t-1])[/C][C]P(F[t]>Y[t-s])[/C][C]P(F[t]>Y[109])[/C][/ROW]
[ROW][C]97[/C][C]10414.9[/C][C]-[/C][C]-[/C][C]-[/C][C]-[/C][C]-[/C][C]-[/C][C]-[/C][/ROW]
[ROW][C]98[/C][C]12476.8[/C][C]-[/C][C]-[/C][C]-[/C][C]-[/C][C]-[/C][C]-[/C][C]-[/C][/ROW]
[ROW][C]99[/C][C]12384.6[/C][C]-[/C][C]-[/C][C]-[/C][C]-[/C][C]-[/C][C]-[/C][C]-[/C][/ROW]
[ROW][C]100[/C][C]12266.7[/C][C]-[/C][C]-[/C][C]-[/C][C]-[/C][C]-[/C][C]-[/C][C]-[/C][/ROW]
[ROW][C]101[/C][C]12919.9[/C][C]-[/C][C]-[/C][C]-[/C][C]-[/C][C]-[/C][C]-[/C][C]-[/C][/ROW]
[ROW][C]102[/C][C]11497.3[/C][C]-[/C][C]-[/C][C]-[/C][C]-[/C][C]-[/C][C]-[/C][C]-[/C][/ROW]
[ROW][C]103[/C][C]12142[/C][C]-[/C][C]-[/C][C]-[/C][C]-[/C][C]-[/C][C]-[/C][C]-[/C][/ROW]
[ROW][C]104[/C][C]13919.4[/C][C]-[/C][C]-[/C][C]-[/C][C]-[/C][C]-[/C][C]-[/C][C]-[/C][/ROW]
[ROW][C]105[/C][C]12656.8[/C][C]-[/C][C]-[/C][C]-[/C][C]-[/C][C]-[/C][C]-[/C][C]-[/C][/ROW]
[ROW][C]106[/C][C]12034.1[/C][C]-[/C][C]-[/C][C]-[/C][C]-[/C][C]-[/C][C]-[/C][C]-[/C][/ROW]
[ROW][C]107[/C][C]13199.7[/C][C]-[/C][C]-[/C][C]-[/C][C]-[/C][C]-[/C][C]-[/C][C]-[/C][/ROW]
[ROW][C]108[/C][C]10881.3[/C][C]-[/C][C]-[/C][C]-[/C][C]-[/C][C]-[/C][C]-[/C][C]-[/C][/ROW]
[ROW][C]109[/C][C]11301.2[/C][C]-[/C][C]-[/C][C]-[/C][C]-[/C][C]-[/C][C]-[/C][C]-[/C][/ROW]
[ROW][C]110[/C][C]13643.9[/C][C]13363.1[/C][C]12073.3739[/C][C]14652.8261[/C][C]0.3348[/C][C]0.9991[/C][C]0.911[/C][C]0.9991[/C][/ROW]
[ROW][C]111[/C][C]12517[/C][C]13270.9[/C][C]11446.9519[/C][C]15094.8481[/C][C]0.2089[/C][C]0.3443[/C][C]0.8296[/C][C]0.9829[/C][/ROW]
[ROW][C]112[/C][C]13981.1[/C][C]13153[/C][C]10919.1289[/C][C]15386.8711[/C][C]0.2337[/C][C]0.7116[/C][C]0.7816[/C][C]0.9479[/C][/ROW]
[ROW][C]113[/C][C]14275.7[/C][C]13806.2[/C][C]11226.7478[/C][C]16385.6522[/C][C]0.3606[/C][C]0.4471[/C][C]0.7497[/C][C]0.9715[/C][/ROW]
[ROW][C]114[/C][C]13435[/C][C]12383.6[/C][C]9499.6848[/C][C]15267.5152[/C][C]0.2374[/C][C]0.0992[/C][C]0.7265[/C][C]0.769[/C][/ROW]
[ROW][C]115[/C][C]13565.7[/C][C]13028.3[/C][C]9869.1292[/C][C]16187.4708[/C][C]0.3694[/C][C]0.4004[/C][C]0.7088[/C][C]0.858[/C][/ROW]
[ROW][C]116[/C][C]16216.3[/C][C]14805.7[/C][C]11393.4055[/C][C]18217.9945[/C][C]0.2089[/C][C]0.7618[/C][C]0.6947[/C][C]0.9779[/C][/ROW]
[ROW][C]117[/C][C]12970[/C][C]13543.1[/C][C]9895.2037[/C][C]17190.9963[/C][C]0.3791[/C][C]0.0755[/C][C]0.683[/C][C]0.8858[/C][/ROW]
[ROW][C]118[/C][C]14079.9[/C][C]12920.4[/C][C]9051.2217[/C][C]16789.5783[/C][C]0.2785[/C][C]0.49[/C][C]0.6733[/C][C]0.794[/C][/ROW]
[ROW][C]119[/C][C]14235[/C][C]14086[/C][C]10007.528[/C][C]18164.472[/C][C]0.4715[/C][C]0.5012[/C][C]0.6649[/C][C]0.9096[/C][/ROW]
[ROW][C]120[/C][C]12213.4[/C][C]11767.6[/C][C]7490.0625[/C][C]16045.1375[/C][C]0.4191[/C][C]0.1291[/C][C]0.6577[/C][C]0.5846[/C][/ROW]
[ROW][C]121[/C][C]12581[/C][C]12187.5[/C][C]7719.7578[/C][C]16655.2422[/C][C]0.4315[/C][C]0.4955[/C][C]0.6513[/C][C]0.6513[/C][/ROW]
[/TABLE]
Source: https://freestatistics.org/blog/index.php?pk=33400&T=1

Globally Unique Identifier (entire table): ba.freestatistics.org/blog/index.php?pk=33400&T=1

As an alternative you can also use a QR Code:  

The GUIDs for individual cells are displayed in the table below:

Univariate ARIMA Extrapolation Forecast
timeY[t]F[t]95% LB95% UBp-value(H0: Y[t] = F[t])P(F[t]>Y[t-1])P(F[t]>Y[t-s])P(F[t]>Y[109])
9710414.9-------
9812476.8-------
9912384.6-------
10012266.7-------
10112919.9-------
10211497.3-------
10312142-------
10413919.4-------
10512656.8-------
10612034.1-------
10713199.7-------
10810881.3-------
10911301.2-------
11013643.913363.112073.373914652.82610.33480.99910.9110.9991
1111251713270.911446.951915094.84810.20890.34430.82960.9829
11213981.11315310919.128915386.87110.23370.71160.78160.9479
11314275.713806.211226.747816385.65220.36060.44710.74970.9715
1141343512383.69499.684815267.51520.23740.09920.72650.769
11513565.713028.39869.129216187.47080.36940.40040.70880.858
11616216.314805.711393.405518217.99450.20890.76180.69470.9779
1171297013543.19895.203717190.99630.37910.07550.6830.8858
11814079.912920.49051.221716789.57830.27850.490.67330.794
119142351408610007.52818164.4720.47150.50120.66490.9096
12012213.411767.67490.062516045.13750.41910.12910.65770.5846
1211258112187.57719.757816655.24220.43150.49550.65130.6513


Univariate ARIMA Extrapolation Forecast Performance
time% S.E.PEMAPESq.EMSERMSE
1100.04920.0210.001878848.646570.7281.06
1110.0701-0.05680.0047568365.2147363.7675217.6322
1120.08670.0630.0052685749.6157145.8008239.0519
1130.09530.0340.0028220430.2518369.1875135.533
1140.11880.08490.00711105441.9692120.1633303.513
1150.12370.04120.0034288798.7624066.5633155.134
1160.11760.09530.00791989792.36165816.03407.2051
1170.1374-0.04230.0035328443.6127370.3008165.4397
1180.15280.08970.00751344440.25112036.6875334.7188
1190.14770.01069e-04222011850.083343.0126
1200.18550.03790.0032198737.6416561.47128.6914
1210.1870.03230.0027154842.2512903.5208113.5937

\begin{tabular}{lllllllll}
\hline
Univariate ARIMA Extrapolation Forecast Performance \tabularnewline
time & % S.E. & PE & MAPE & Sq.E & MSE & RMSE \tabularnewline
110 & 0.0492 & 0.021 & 0.0018 & 78848.64 & 6570.72 & 81.06 \tabularnewline
111 & 0.0701 & -0.0568 & 0.0047 & 568365.21 & 47363.7675 & 217.6322 \tabularnewline
112 & 0.0867 & 0.063 & 0.0052 & 685749.61 & 57145.8008 & 239.0519 \tabularnewline
113 & 0.0953 & 0.034 & 0.0028 & 220430.25 & 18369.1875 & 135.533 \tabularnewline
114 & 0.1188 & 0.0849 & 0.0071 & 1105441.96 & 92120.1633 & 303.513 \tabularnewline
115 & 0.1237 & 0.0412 & 0.0034 & 288798.76 & 24066.5633 & 155.134 \tabularnewline
116 & 0.1176 & 0.0953 & 0.0079 & 1989792.36 & 165816.03 & 407.2051 \tabularnewline
117 & 0.1374 & -0.0423 & 0.0035 & 328443.61 & 27370.3008 & 165.4397 \tabularnewline
118 & 0.1528 & 0.0897 & 0.0075 & 1344440.25 & 112036.6875 & 334.7188 \tabularnewline
119 & 0.1477 & 0.0106 & 9e-04 & 22201 & 1850.0833 & 43.0126 \tabularnewline
120 & 0.1855 & 0.0379 & 0.0032 & 198737.64 & 16561.47 & 128.6914 \tabularnewline
121 & 0.187 & 0.0323 & 0.0027 & 154842.25 & 12903.5208 & 113.5937 \tabularnewline
\hline
\end{tabular}
%Source: https://freestatistics.org/blog/index.php?pk=33400&T=2

[TABLE]
[ROW][C]Univariate ARIMA Extrapolation Forecast Performance[/C][/ROW]
[ROW][C]time[/C][C]% S.E.[/C][C]PE[/C][C]MAPE[/C][C]Sq.E[/C][C]MSE[/C][C]RMSE[/C][/ROW]
[ROW][C]110[/C][C]0.0492[/C][C]0.021[/C][C]0.0018[/C][C]78848.64[/C][C]6570.72[/C][C]81.06[/C][/ROW]
[ROW][C]111[/C][C]0.0701[/C][C]-0.0568[/C][C]0.0047[/C][C]568365.21[/C][C]47363.7675[/C][C]217.6322[/C][/ROW]
[ROW][C]112[/C][C]0.0867[/C][C]0.063[/C][C]0.0052[/C][C]685749.61[/C][C]57145.8008[/C][C]239.0519[/C][/ROW]
[ROW][C]113[/C][C]0.0953[/C][C]0.034[/C][C]0.0028[/C][C]220430.25[/C][C]18369.1875[/C][C]135.533[/C][/ROW]
[ROW][C]114[/C][C]0.1188[/C][C]0.0849[/C][C]0.0071[/C][C]1105441.96[/C][C]92120.1633[/C][C]303.513[/C][/ROW]
[ROW][C]115[/C][C]0.1237[/C][C]0.0412[/C][C]0.0034[/C][C]288798.76[/C][C]24066.5633[/C][C]155.134[/C][/ROW]
[ROW][C]116[/C][C]0.1176[/C][C]0.0953[/C][C]0.0079[/C][C]1989792.36[/C][C]165816.03[/C][C]407.2051[/C][/ROW]
[ROW][C]117[/C][C]0.1374[/C][C]-0.0423[/C][C]0.0035[/C][C]328443.61[/C][C]27370.3008[/C][C]165.4397[/C][/ROW]
[ROW][C]118[/C][C]0.1528[/C][C]0.0897[/C][C]0.0075[/C][C]1344440.25[/C][C]112036.6875[/C][C]334.7188[/C][/ROW]
[ROW][C]119[/C][C]0.1477[/C][C]0.0106[/C][C]9e-04[/C][C]22201[/C][C]1850.0833[/C][C]43.0126[/C][/ROW]
[ROW][C]120[/C][C]0.1855[/C][C]0.0379[/C][C]0.0032[/C][C]198737.64[/C][C]16561.47[/C][C]128.6914[/C][/ROW]
[ROW][C]121[/C][C]0.187[/C][C]0.0323[/C][C]0.0027[/C][C]154842.25[/C][C]12903.5208[/C][C]113.5937[/C][/ROW]
[/TABLE]
Source: https://freestatistics.org/blog/index.php?pk=33400&T=2

Globally Unique Identifier (entire table): ba.freestatistics.org/blog/index.php?pk=33400&T=2

As an alternative you can also use a QR Code:  

The GUIDs for individual cells are displayed in the table below:

Univariate ARIMA Extrapolation Forecast Performance
time% S.E.PEMAPESq.EMSERMSE
1100.04920.0210.001878848.646570.7281.06
1110.0701-0.05680.0047568365.2147363.7675217.6322
1120.08670.0630.0052685749.6157145.8008239.0519
1130.09530.0340.0028220430.2518369.1875135.533
1140.11880.08490.00711105441.9692120.1633303.513
1150.12370.04120.0034288798.7624066.5633155.134
1160.11760.09530.00791989792.36165816.03407.2051
1170.1374-0.04230.0035328443.6127370.3008165.4397
1180.15280.08970.00751344440.25112036.6875334.7188
1190.14770.01069e-04222011850.083343.0126
1200.18550.03790.0032198737.6416561.47128.6914
1210.1870.03230.0027154842.2512903.5208113.5937


Parameters (Session):
par1 = 12 ; par2 = 1 ; par3 = 1 ; par4 = 1 ; par5 = 12 ; par6 = 0 ; par7 = 0 ; par8 = 0 ; par9 = 0 ; par10 = FALSE ;
Parameters (R input):
par1 = 12 ; par2 = 1 ; par3 = 1 ; par4 = 1 ; par5 = 12 ; par6 = 0 ; par7 = 0 ; par8 = 0 ; par9 = 0 ; par10 = FALSE ;
R code (references can be found in the software module):
par1 <- as.numeric(par1) #cut off periods
par2 <- as.numeric(par2) #lambda
par3 <- as.numeric(par3) #degree of non-seasonal differencing
par4 <- as.numeric(par4) #degree of seasonal differencing
par5 <- as.numeric(par5) #seasonal period
par6 <- as.numeric(par6) #p
par7 <- as.numeric(par7) #q
par8 <- as.numeric(par8) #P
par9 <- as.numeric(par9) #Q
if (par10 == 'TRUE') par10 <- TRUE
if (par10 == 'FALSE') par10 <- FALSE
if (par2 == 0) x <- log(x)
if (par2 != 0) x <- x^par2
lx <- length(x)
first <- lx - 2*par1
nx <- lx - par1
nx1 <- nx + 1
fx <- lx - nx
if (fx < 1) {
fx <- par5
nx1 <- lx + fx - 1
first <- lx - 2*fx
}
first <- 1
if (fx < 3) fx <- round(lx/10,0)
(arima.out <- arima(x[1:nx], order=c(par6,par3,par7), seasonal=list(order=c(par8,par4,par9), period=par5), include.mean=par10, method='ML'))
(forecast <- predict(arima.out,fx))
(lb <- forecast$pred - 1.96 * forecast$se)
(ub <- forecast$pred + 1.96 * forecast$se)
if (par2 == 0) {
x <- exp(x)
forecast$pred <- exp(forecast$pred)
lb <- exp(lb)
ub <- exp(ub)
}
if (par2 != 0) {
x <- x^(1/par2)
forecast$pred <- forecast$pred^(1/par2)
lb <- lb^(1/par2)
ub <- ub^(1/par2)
}
if (par2 < 0) {
olb <- lb
lb <- ub
ub <- olb
}
(actandfor <- c(x[1:nx], forecast$pred))
(perc.se <- (ub-forecast$pred)/1.96/forecast$pred)
bitmap(file='test1.png')
opar <- par(mar=c(4,4,2,2),las=1)
ylim <- c( min(x[first:nx],lb), max(x[first:nx],ub))
plot(x,ylim=ylim,type='n',xlim=c(first,lx))
usr <- par('usr')
rect(usr[1],usr[3],nx+1,usr[4],border=NA,col='lemonchiffon')
rect(nx1,usr[3],usr[2],usr[4],border=NA,col='lavender')
abline(h= (-3:3)*2 , col ='gray', lty =3)
polygon( c(nx1:lx,lx:nx1), c(lb,rev(ub)), col = 'orange', lty=2,border=NA)
lines(nx1:lx, lb , lty=2)
lines(nx1:lx, ub , lty=2)
lines(x, lwd=2)
lines(nx1:lx, forecast$pred , lwd=2 , col ='white')
box()
par(opar)
dev.off()
prob.dec <- array(NA, dim=fx)
prob.sdec <- array(NA, dim=fx)
prob.ldec <- array(NA, dim=fx)
prob.pval <- array(NA, dim=fx)
perf.pe <- array(0, dim=fx)
perf.mape <- array(0, dim=fx)
perf.se <- array(0, dim=fx)
perf.mse <- array(0, dim=fx)
perf.rmse <- array(0, dim=fx)
for (i in 1:fx) {
locSD <- (ub[i] - forecast$pred[i]) / 1.96
perf.pe[i] = (x[nx+i] - forecast$pred[i]) / forecast$pred[i]
perf.mape[i] = perf.mape[i] + abs(perf.pe[i])
perf.se[i] = (x[nx+i] - forecast$pred[i])^2
perf.mse[i] = perf.mse[i] + perf.se[i]
prob.dec[i] = pnorm((x[nx+i-1] - forecast$pred[i]) / locSD)
prob.sdec[i] = pnorm((x[nx+i-par5] - forecast$pred[i]) / locSD)
prob.ldec[i] = pnorm((x[nx] - forecast$pred[i]) / locSD)
prob.pval[i] = pnorm(abs(x[nx+i] - forecast$pred[i]) / locSD)
}
perf.mape = perf.mape / fx
perf.mse = perf.mse / fx
perf.rmse = sqrt(perf.mse)
bitmap(file='test2.png')
plot(forecast$pred, pch=19, type='b',main='ARIMA Extrapolation Forecast', ylab='Forecast and 95% CI', xlab='time',ylim=c(min(lb),max(ub)))
dum <- forecast$pred
dum[1:12] <- x[(nx+1):lx]
lines(dum, lty=1)
lines(ub,lty=3)
lines(lb,lty=3)
dev.off()
load(file='createtable')
a<-table.start()
a<-table.row.start(a)
a<-table.element(a,'Univariate ARIMA Extrapolation Forecast',9,TRUE)
a<-table.row.end(a)
a<-table.row.start(a)
a<-table.element(a,'time',1,header=TRUE)
a<-table.element(a,'Y[t]',1,header=TRUE)
a<-table.element(a,'F[t]',1,header=TRUE)
a<-table.element(a,'95% LB',1,header=TRUE)
a<-table.element(a,'95% UB',1,header=TRUE)
a<-table.element(a,'p-value
(H0: Y[t] = F[t])',1,header=TRUE)
a<-table.element(a,'P(F[t]>Y[t-1])',1,header=TRUE)
a<-table.element(a,'P(F[t]>Y[t-s])',1,header=TRUE)
mylab <- paste('P(F[t]>Y[',nx,sep='')
mylab <- paste(mylab,'])',sep='')
a<-table.element(a,mylab,1,header=TRUE)
a<-table.row.end(a)
for (i in (nx-par5):nx) {
a<-table.row.start(a)
a<-table.element(a,i,header=TRUE)
a<-table.element(a,x[i])
a<-table.element(a,'-')
a<-table.row.end(a)
}
for (i in 1:fx) {
a<-table.row.start(a)
a<-table.element(a,nx+i,header=TRUE)
a<-table.element(a,round(x[nx+i],4))
a<-table.element(a,round(forecast$pred[i],4))
a<-table.element(a,round(lb[i],4))
a<-table.element(a,round(ub[i],4))
a<-table.element(a,round((1-prob.pval[i]),4))
a<-table.element(a,round((1-prob.dec[i]),4))
a<-table.element(a,round((1-prob.sdec[i]),4))
a<-table.element(a,round((1-prob.ldec[i]),4))
a<-table.row.end(a)
}
a<-table.end(a)
table.save(a,file='mytable.tab')
a<-table.start()
a<-table.row.start(a)
a<-table.element(a,'Univariate ARIMA Extrapolation Forecast Performance',7,TRUE)
a<-table.row.end(a)
a<-table.row.start(a)
a<-table.element(a,'time',1,header=TRUE)
a<-table.element(a,'% S.E.',1,header=TRUE)
a<-table.element(a,'PE',1,header=TRUE)
a<-table.element(a,'MAPE',1,header=TRUE)
a<-table.element(a,'Sq.E',1,header=TRUE)
a<-table.element(a,'MSE',1,header=TRUE)
a<-table.element(a,'RMSE',1,header=TRUE)
a<-table.row.end(a)
for (i in 1:fx) {
a<-table.row.start(a)
a<-table.element(a,nx+i,header=TRUE)
a<-table.element(a,round(perc.se[i],4))
a<-table.element(a,round(perf.pe[i],4))
a<-table.element(a,round(perf.mape[i],4))
a<-table.element(a,round(perf.se[i],4))
a<-table.element(a,round(perf.mse[i],4))
a<-table.element(a,round(perf.rmse[i],4))
a<-table.row.end(a)
}
a<-table.end(a)
table.save(a,file='mytable1.tab')