Free Statistics

of Irreproducible Research!

Author's title

Author*The author of this computation has been verified*
R Software Modulerwasp_correlation.wasp
Title produced by softwarePearson Correlation
Date of computationSun, 14 Dec 2008 07:31:59 -0700
Cite this page as followsStatistical Computations at FreeStatistics.org, Office for Research Development and Education, URL https://freestatistics.org/blog/index.php?v=date/2008/Dec/14/t1229265169ugp46bpxwlz2ml0.htm/, Retrieved Wed, 15 May 2024 06:28:56 +0000
Statistical Computations at FreeStatistics.org, Office for Research Development and Education, URL https://freestatistics.org/blog/index.php?pk=33394, Retrieved Wed, 15 May 2024 06:28:56 +0000
QR Codes:

Original text written by user:
IsPrivate?No (this computation is public)
User-defined keywords
Estimated Impact138
Family? (F = Feedback message, R = changed R code, M = changed R Module, P = changed Parameters, D = changed Data)
-       [Pearson Correlation] [Paper - pearson -...] [2008-12-14 14:31:59] [73ec5abea95a9c3c8c3a1ac44cab1f72] [Current]
Feedback Forum

Post a new message
Dataseries X:
2490
3266
3475
3127
2955
3870
2852
3142
3029
3180
2560
2733
2452
2553
2777
2520
2318
2873
2311
2395
2099
2268
2316
2181
2175
2627
2578
3090
2634
3225
2938
3174
3350
2588
2061
2691
2061
2918
2223
2651
2379
3146
2883
2768
3258
2839
2470
5072
1463
1600
2203
2013
2169
2640
2411
2528
2292
1988
1774
2279
Dataseries Y:
535
681
830
720
582
806
728
803
830
699
622
655
571
512
674
522
627
769
633
715
702
678
531
562
504
552
511
695
559
677
636
694
694
624
524
557
490
475
492
491
489
606
618
607
637
597
539
600
448
520
607
566
595
625
667
587
629
562
511
664


Summary of computational transaction
Raw Inputview raw input (R code)
Raw Outputview raw output of R engine
Computing time0 seconds
R Server'Gwilym Jenkins' @ 72.249.127.135

\begin{tabular}{lllllllll}
\hline
Summary of computational transaction \tabularnewline
Raw Input & view raw input (R code)  \tabularnewline
Raw Output & view raw output of R engine  \tabularnewline
Computing time & 0 seconds \tabularnewline
R Server & 'Gwilym Jenkins' @ 72.249.127.135 \tabularnewline
\hline
\end{tabular}
%Source: https://freestatistics.org/blog/index.php?pk=33394&T=0

[TABLE]
[ROW][C]Summary of computational transaction[/C][/ROW]
[ROW][C]Raw Input[/C][C]view raw input (R code) [/C][/ROW]
[ROW][C]Raw Output[/C][C]view raw output of R engine [/C][/ROW]
[ROW][C]Computing time[/C][C]0 seconds[/C][/ROW]
[ROW][C]R Server[/C][C]'Gwilym Jenkins' @ 72.249.127.135[/C][/ROW]
[/TABLE]
Source: https://freestatistics.org/blog/index.php?pk=33394&T=0

Globally Unique Identifier (entire table): ba.freestatistics.org/blog/index.php?pk=33394&T=0

As an alternative you can also use a QR Code:  

The GUIDs for individual cells are displayed in the table below:

Summary of computational transaction
Raw Inputview raw input (R code)
Raw Outputview raw output of R engine
Computing time0 seconds
R Server'Gwilym Jenkins' @ 72.249.127.135


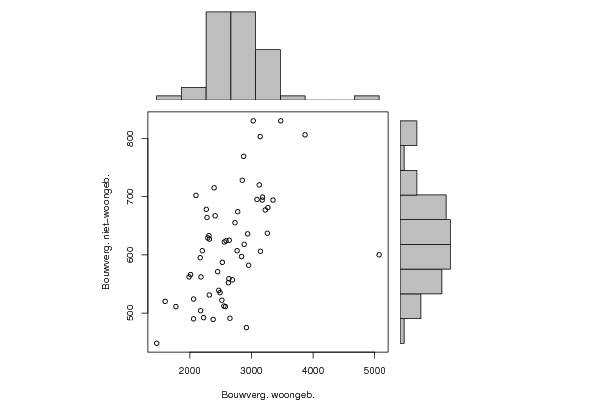
Pearson Product Moment Correlation - Ungrouped Data
StatisticVariable XVariable Y
Mean2648.35613.933333333333
Biased Variance315996.4941666678368.42888888889
Biased Standard Deviation562.13565459474991.4791172284084
Covariance27018.4305084746
Correlation0.51665160330834
Determination0.266928879201078
T-Test4.59556298545336
p-value (2 sided)2.37871587740468e-05
p-value (1 sided)1.18935793870234e-05
Degrees of Freedom58
Number of Observations60

\begin{tabular}{lllllllll}
\hline
Pearson Product Moment Correlation - Ungrouped Data \tabularnewline
Statistic & Variable X & Variable Y \tabularnewline
Mean & 2648.35 & 613.933333333333 \tabularnewline
Biased Variance & 315996.494166667 & 8368.42888888889 \tabularnewline
Biased Standard Deviation & 562.135654594749 & 91.4791172284084 \tabularnewline
Covariance & 27018.4305084746 \tabularnewline
Correlation & 0.51665160330834 \tabularnewline
Determination & 0.266928879201078 \tabularnewline
T-Test & 4.59556298545336 \tabularnewline
p-value (2 sided) & 2.37871587740468e-05 \tabularnewline
p-value (1 sided) & 1.18935793870234e-05 \tabularnewline
Degrees of Freedom & 58 \tabularnewline
Number of Observations & 60 \tabularnewline
\hline
\end{tabular}
%Source: https://freestatistics.org/blog/index.php?pk=33394&T=1

[TABLE]
[ROW][C]Pearson Product Moment Correlation - Ungrouped Data[/C][/ROW]
[ROW][C]Statistic[/C][C]Variable X[/C][C]Variable Y[/C][/ROW]
[ROW][C]Mean[/C][C]2648.35[/C][C]613.933333333333[/C][/ROW]
[ROW][C]Biased Variance[/C][C]315996.494166667[/C][C]8368.42888888889[/C][/ROW]
[ROW][C]Biased Standard Deviation[/C][C]562.135654594749[/C][C]91.4791172284084[/C][/ROW]
[ROW][C]Covariance[/C][C]27018.4305084746[/C][/ROW]
[ROW][C]Correlation[/C][C]0.51665160330834[/C][/ROW]
[ROW][C]Determination[/C][C]0.266928879201078[/C][/ROW]
[ROW][C]T-Test[/C][C]4.59556298545336[/C][/ROW]
[ROW][C]p-value (2 sided)[/C][C]2.37871587740468e-05[/C][/ROW]
[ROW][C]p-value (1 sided)[/C][C]1.18935793870234e-05[/C][/ROW]
[ROW][C]Degrees of Freedom[/C][C]58[/C][/ROW]
[ROW][C]Number of Observations[/C][C]60[/C][/ROW]
[/TABLE]
Source: https://freestatistics.org/blog/index.php?pk=33394&T=1

Globally Unique Identifier (entire table): ba.freestatistics.org/blog/index.php?pk=33394&T=1

As an alternative you can also use a QR Code:  

The GUIDs for individual cells are displayed in the table below:

Pearson Product Moment Correlation - Ungrouped Data
StatisticVariable XVariable Y
Mean2648.35613.933333333333
Biased Variance315996.4941666678368.42888888889
Biased Standard Deviation562.13565459474991.4791172284084
Covariance27018.4305084746
Correlation0.51665160330834
Determination0.266928879201078
T-Test4.59556298545336
p-value (2 sided)2.37871587740468e-05
p-value (1 sided)1.18935793870234e-05
Degrees of Freedom58
Number of Observations60


Parameters (Session):
Parameters (R input):
R code (references can be found in the software module):
bitmap(file='test1.png')
histx <- hist(x, plot=FALSE)
histy <- hist(y, plot=FALSE)
maxcounts <- max(c(histx$counts, histx$counts))
xrange <- c(min(x),max(x))
yrange <- c(min(y),max(y))
nf <- layout(matrix(c(2,0,1,3),2,2,byrow=TRUE), c(3,1), c(1,3), TRUE)
par(mar=c(4,4,1,1))
plot(x, y, xlim=xrange, ylim=yrange, xlab=xlab, ylab=ylab)
par(mar=c(0,4,1,1))
barplot(histx$counts, axes=FALSE, ylim=c(0, maxcounts), space=0)
par(mar=c(4,0,1,1))
barplot(histy$counts, axes=FALSE, xlim=c(0, maxcounts), space=0, horiz=TRUE)
dev.off()
lx = length(x)
makebiased = (lx-1)/lx
varx = var(x)*makebiased
vary = var(y)*makebiased
corxy <- cor.test(x,y,method='pearson')
cxy <- as.matrix(corxy$estimate)[1,1]
load(file='createtable')
a<-table.start()
a<-table.row.start(a)
a<-table.element(a,'Pearson Product Moment Correlation - Ungrouped Data',3,TRUE)
a<-table.row.end(a)
a<-table.row.start(a)
a<-table.element(a,'Statistic',1,TRUE)
a<-table.element(a,'Variable X',1,TRUE)
a<-table.element(a,'Variable Y',1,TRUE)
a<-table.row.end(a)
a<-table.row.start(a)
a<-table.element(a,hyperlink('arithmetic_mean.htm','Mean',''),header=TRUE)
a<-table.element(a,mean(x))
a<-table.element(a,mean(y))
a<-table.row.end(a)
a<-table.row.start(a)
a<-table.element(a,hyperlink('biased.htm','Biased Variance',''),header=TRUE)
a<-table.element(a,varx)
a<-table.element(a,vary)
a<-table.row.end(a)
a<-table.row.start(a)
a<-table.element(a,hyperlink('biased1.htm','Biased Standard Deviation',''),header=TRUE)
a<-table.element(a,sqrt(varx))
a<-table.element(a,sqrt(vary))
a<-table.row.end(a)
a<-table.row.start(a)
a<-table.element(a,hyperlink('covariance.htm','Covariance',''),header=TRUE)
a<-table.element(a,cov(x,y),2)
a<-table.row.end(a)
a<-table.row.start(a)
a<-table.element(a,hyperlink('pearson_correlation.htm','Correlation',''),header=TRUE)
a<-table.element(a,cxy,2)
a<-table.row.end(a)
a<-table.row.start(a)
a<-table.element(a,hyperlink('coeff_of_determination.htm','Determination',''),header=TRUE)
a<-table.element(a,cxy*cxy,2)
a<-table.row.end(a)
a<-table.row.start(a)
a<-table.element(a,hyperlink('ttest_statistic.htm','T-Test',''),header=TRUE)
a<-table.element(a,as.matrix(corxy$statistic)[1,1],2)
a<-table.row.end(a)
a<-table.row.start(a)
a<-table.element(a,'p-value (2 sided)',header=TRUE)
a<-table.element(a,(p2 <- as.matrix(corxy$p.value)[1,1]),2)
a<-table.row.end(a)
a<-table.row.start(a)
a<-table.element(a,'p-value (1 sided)',header=TRUE)
a<-table.element(a,p2/2,2)
a<-table.row.end(a)
a<-table.row.start(a)
a<-table.element(a,'Degrees of Freedom',header=TRUE)
a<-table.element(a,lx-2,2)
a<-table.row.end(a)
a<-table.row.start(a)
a<-table.element(a,'Number of Observations',header=TRUE)
a<-table.element(a,lx,2)
a<-table.row.end(a)
a<-table.end(a)
table.save(a,file='mytable.tab')