Free Statistics

of Irreproducible Research!

Author's title

Author*The author of this computation has been verified*
R Software Modulerwasp_smp.wasp
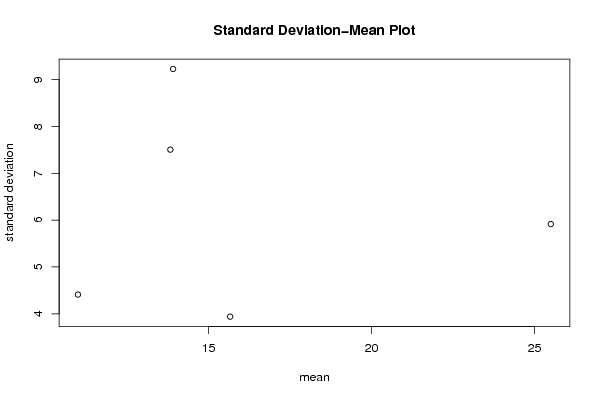
Title produced by softwareStandard Deviation-Mean Plot
Date of computationSun, 14 Dec 2008 06:40:55 -0700
Cite this page as followsStatistical Computations at FreeStatistics.org, Office for Research Development and Education, URL https://freestatistics.org/blog/index.php?v=date/2008/Dec/14/t1229262121kpxlj1au86we680.htm/, Retrieved Wed, 15 May 2024 13:12:00 +0000
Statistical Computations at FreeStatistics.org, Office for Research Development and Education, URL https://freestatistics.org/blog/index.php?pk=33370, Retrieved Wed, 15 May 2024 13:12:00 +0000
QR Codes:

Original text written by user:
IsPrivate?No (this computation is public)
User-defined keywords
Estimated Impact237
Family? (F = Feedback message, R = changed R code, M = changed R Module, P = changed Parameters, D = changed Data)
F     [Univariate Data Series] [Airline data] [2007-10-18 09:58:47] [42daae401fd3def69a25014f2252b4c2]
F RMPD  [Standard Deviation-Mean Plot] [] [2008-12-01 21:10:18] [cb714085b233acee8e8acd879ea442b6]
-   PD    [Standard Deviation-Mean Plot] [] [2008-12-08 20:34:45] [cb714085b233acee8e8acd879ea442b6]
-    D        [Standard Deviation-Mean Plot] [] [2008-12-14 13:40:55] [787873b6436f665b5b192a0bdb2e43c9] [Current]
-    D          [Standard Deviation-Mean Plot] [] [2008-12-14 13:46:14] [cb714085b233acee8e8acd879ea442b6]
Feedback Forum

Post a new message
Dataseries X:
0
9
1
4
6
21
24
23
22
21
20
16
18
18
24
16
15
24
18
15
4
3
6
5
12
12
12
14
12
17
12
20
21
15
22
19
19
26
25
19
20
30
31
35
33
26
25
17
14
8
12
7
4
10
8
16
14
20
9
10


Summary of computational transaction
Raw Inputview raw input (R code)
Raw Outputview raw output of R engine
Computing time1 seconds
R Server'Gwilym Jenkins' @ 72.249.127.135

\begin{tabular}{lllllllll}
\hline
Summary of computational transaction \tabularnewline
Raw Input & view raw input (R code)  \tabularnewline
Raw Output & view raw output of R engine  \tabularnewline
Computing time & 1 seconds \tabularnewline
R Server & 'Gwilym Jenkins' @ 72.249.127.135 \tabularnewline
\hline
\end{tabular}
%Source: https://freestatistics.org/blog/index.php?pk=33370&T=0

[TABLE]
[ROW][C]Summary of computational transaction[/C][/ROW]
[ROW][C]Raw Input[/C][C]view raw input (R code) [/C][/ROW]
[ROW][C]Raw Output[/C][C]view raw output of R engine [/C][/ROW]
[ROW][C]Computing time[/C][C]1 seconds[/C][/ROW]
[ROW][C]R Server[/C][C]'Gwilym Jenkins' @ 72.249.127.135[/C][/ROW]
[/TABLE]
Source: https://freestatistics.org/blog/index.php?pk=33370&T=0

Globally Unique Identifier (entire table): ba.freestatistics.org/blog/index.php?pk=33370&T=0

As an alternative you can also use a QR Code:  

The GUIDs for individual cells are displayed in the table below:

Summary of computational transaction
Raw Inputview raw input (R code)
Raw Outputview raw output of R engine
Computing time1 seconds
R Server'Gwilym Jenkins' @ 72.249.127.135


Standard Deviation-Mean Plot
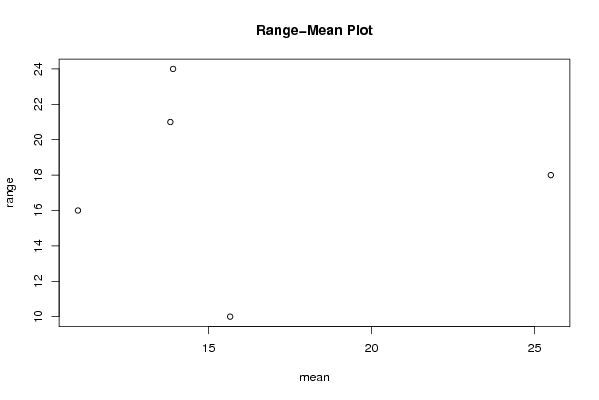
SectionMeanStandard DeviationRange
113.91666666666679.2289892417448624
213.83333333333337.5055534994651321
315.66666666666673.9389277113386510
425.55.9160797830996218
5114.4107307166211716

\begin{tabular}{lllllllll}
\hline
Standard Deviation-Mean Plot \tabularnewline
Section & Mean & Standard Deviation & Range \tabularnewline
1 & 13.9166666666667 & 9.22898924174486 & 24 \tabularnewline
2 & 13.8333333333333 & 7.50555349946513 & 21 \tabularnewline
3 & 15.6666666666667 & 3.93892771133865 & 10 \tabularnewline
4 & 25.5 & 5.91607978309962 & 18 \tabularnewline
5 & 11 & 4.41073071662117 & 16 \tabularnewline
\hline
\end{tabular}
%Source: https://freestatistics.org/blog/index.php?pk=33370&T=1

[TABLE]
[ROW][C]Standard Deviation-Mean Plot[/C][/ROW]
[ROW][C]Section[/C][C]Mean[/C][C]Standard Deviation[/C][C]Range[/C][/ROW]
[ROW][C]1[/C][C]13.9166666666667[/C][C]9.22898924174486[/C][C]24[/C][/ROW]
[ROW][C]2[/C][C]13.8333333333333[/C][C]7.50555349946513[/C][C]21[/C][/ROW]
[ROW][C]3[/C][C]15.6666666666667[/C][C]3.93892771133865[/C][C]10[/C][/ROW]
[ROW][C]4[/C][C]25.5[/C][C]5.91607978309962[/C][C]18[/C][/ROW]
[ROW][C]5[/C][C]11[/C][C]4.41073071662117[/C][C]16[/C][/ROW]
[/TABLE]
Source: https://freestatistics.org/blog/index.php?pk=33370&T=1

Globally Unique Identifier (entire table): ba.freestatistics.org/blog/index.php?pk=33370&T=1

As an alternative you can also use a QR Code:  

The GUIDs for individual cells are displayed in the table below:

Standard Deviation-Mean Plot
SectionMeanStandard DeviationRange
113.91666666666679.2289892417448624
213.83333333333337.5055534994651321
315.66666666666673.9389277113386510
425.55.9160797830996218
5114.4107307166211716


Regression: S.E.(k) = alpha + beta * Mean(k)
alpha6.47454669900397
beta-0.0171735458946873
S.D.0.227043302182357
T-STAT-0.0756399582353403
p-value0.944467248057228

\begin{tabular}{lllllllll}
\hline
Regression: S.E.(k) = alpha + beta * Mean(k) \tabularnewline
alpha & 6.47454669900397 \tabularnewline
beta & -0.0171735458946873 \tabularnewline
S.D. & 0.227043302182357 \tabularnewline
T-STAT & -0.0756399582353403 \tabularnewline
p-value & 0.944467248057228 \tabularnewline
\hline
\end{tabular}
%Source: https://freestatistics.org/blog/index.php?pk=33370&T=2

[TABLE]
[ROW][C]Regression: S.E.(k) = alpha + beta * Mean(k)[/C][/ROW]
[ROW][C]alpha[/C][C]6.47454669900397[/C][/ROW]
[ROW][C]beta[/C][C]-0.0171735458946873[/C][/ROW]
[ROW][C]S.D.[/C][C]0.227043302182357[/C][/ROW]
[ROW][C]T-STAT[/C][C]-0.0756399582353403[/C][/ROW]
[ROW][C]p-value[/C][C]0.944467248057228[/C][/ROW]
[/TABLE]
Source: https://freestatistics.org/blog/index.php?pk=33370&T=2

Globally Unique Identifier (entire table): ba.freestatistics.org/blog/index.php?pk=33370&T=2

As an alternative you can also use a QR Code:  

The GUIDs for individual cells are displayed in the table below:

Regression: S.E.(k) = alpha + beta * Mean(k)
alpha6.47454669900397
beta-0.0171735458946873
S.D.0.227043302182357
T-STAT-0.0756399582353403
p-value0.944467248057228


Regression: ln S.E.(k) = alpha + beta * ln Mean(k)
alpha1.62579538910765
beta0.0543393658688087
S.D.0.657297036494777
T-STAT0.082670943046676
p-value0.939320270262153
Lambda0.945660634131191

\begin{tabular}{lllllllll}
\hline
Regression: ln S.E.(k) = alpha + beta * ln Mean(k) \tabularnewline
alpha & 1.62579538910765 \tabularnewline
beta & 0.0543393658688087 \tabularnewline
S.D. & 0.657297036494777 \tabularnewline
T-STAT & 0.082670943046676 \tabularnewline
p-value & 0.939320270262153 \tabularnewline
Lambda & 0.945660634131191 \tabularnewline
\hline
\end{tabular}
%Source: https://freestatistics.org/blog/index.php?pk=33370&T=3

[TABLE]
[ROW][C]Regression: ln S.E.(k) = alpha + beta * ln Mean(k)[/C][/ROW]
[ROW][C]alpha[/C][C]1.62579538910765[/C][/ROW]
[ROW][C]beta[/C][C]0.0543393658688087[/C][/ROW]
[ROW][C]S.D.[/C][C]0.657297036494777[/C][/ROW]
[ROW][C]T-STAT[/C][C]0.082670943046676[/C][/ROW]
[ROW][C]p-value[/C][C]0.939320270262153[/C][/ROW]
[ROW][C]Lambda[/C][C]0.945660634131191[/C][/ROW]
[/TABLE]
Source: https://freestatistics.org/blog/index.php?pk=33370&T=3

Globally Unique Identifier (entire table): ba.freestatistics.org/blog/index.php?pk=33370&T=3

As an alternative you can also use a QR Code:  

The GUIDs for individual cells are displayed in the table below:

Regression: ln S.E.(k) = alpha + beta * ln Mean(k)
alpha1.62579538910765
beta0.0543393658688087
S.D.0.657297036494777
T-STAT0.082670943046676
p-value0.939320270262153
Lambda0.945660634131191


Parameters (Session):
par1 = 12 ;
Parameters (R input):
par1 = 12 ;
R code (references can be found in the software module):
par1 <- as.numeric(par1)
(n <- length(x))
(np <- floor(n / par1))
arr <- array(NA,dim=c(par1,np))
j <- 0
k <- 1
for (i in 1:(np*par1))
{
j = j + 1
arr[j,k] <- x[i]
if (j == par1) {
j = 0
k=k+1
}
}
arr
arr.mean <- array(NA,dim=np)
arr.sd <- array(NA,dim=np)
arr.range <- array(NA,dim=np)
for (j in 1:np)
{
arr.mean[j] <- mean(arr[,j],na.rm=TRUE)
arr.sd[j] <- sd(arr[,j],na.rm=TRUE)
arr.range[j] <- max(arr[,j],na.rm=TRUE) - min(arr[,j],na.rm=TRUE)
}
arr.mean
arr.sd
arr.range
(lm1 <- lm(arr.sd~arr.mean))
(lnlm1 <- lm(log(arr.sd)~log(arr.mean)))
(lm2 <- lm(arr.range~arr.mean))
bitmap(file='test1.png')
plot(arr.mean,arr.sd,main='Standard Deviation-Mean Plot',xlab='mean',ylab='standard deviation')
dev.off()
bitmap(file='test2.png')
plot(arr.mean,arr.range,main='Range-Mean Plot',xlab='mean',ylab='range')
dev.off()
load(file='createtable')
a<-table.start()
a<-table.row.start(a)
a<-table.element(a,'Standard Deviation-Mean Plot',4,TRUE)
a<-table.row.end(a)
a<-table.row.start(a)
a<-table.element(a,'Section',header=TRUE)
a<-table.element(a,'Mean',header=TRUE)
a<-table.element(a,'Standard Deviation',header=TRUE)
a<-table.element(a,'Range',header=TRUE)
a<-table.row.end(a)
for (j in 1:np) {
a<-table.row.start(a)
a<-table.element(a,j,header=TRUE)
a<-table.element(a,arr.mean[j])
a<-table.element(a,arr.sd[j] )
a<-table.element(a,arr.range[j] )
a<-table.row.end(a)
}
a<-table.end(a)
table.save(a,file='mytable.tab')
a<-table.start()
a<-table.row.start(a)
a<-table.element(a,'Regression: S.E.(k) = alpha + beta * Mean(k)',2,TRUE)
a<-table.row.end(a)
a<-table.row.start(a)
a<-table.element(a,'alpha',header=TRUE)
a<-table.element(a,lm1$coefficients[[1]])
a<-table.row.end(a)
a<-table.row.start(a)
a<-table.element(a,'beta',header=TRUE)
a<-table.element(a,lm1$coefficients[[2]])
a<-table.row.end(a)
a<-table.row.start(a)
a<-table.element(a,'S.D.',header=TRUE)
a<-table.element(a,summary(lm1)$coefficients[2,2])
a<-table.row.end(a)
a<-table.row.start(a)
a<-table.element(a,'T-STAT',header=TRUE)
a<-table.element(a,summary(lm1)$coefficients[2,3])
a<-table.row.end(a)
a<-table.row.start(a)
a<-table.element(a,'p-value',header=TRUE)
a<-table.element(a,summary(lm1)$coefficients[2,4])
a<-table.row.end(a)
a<-table.end(a)
table.save(a,file='mytable1.tab')
a<-table.start()
a<-table.row.start(a)
a<-table.element(a,'Regression: ln S.E.(k) = alpha + beta * ln Mean(k)',2,TRUE)
a<-table.row.end(a)
a<-table.row.start(a)
a<-table.element(a,'alpha',header=TRUE)
a<-table.element(a,lnlm1$coefficients[[1]])
a<-table.row.end(a)
a<-table.row.start(a)
a<-table.element(a,'beta',header=TRUE)
a<-table.element(a,lnlm1$coefficients[[2]])
a<-table.row.end(a)
a<-table.row.start(a)
a<-table.element(a,'S.D.',header=TRUE)
a<-table.element(a,summary(lnlm1)$coefficients[2,2])
a<-table.row.end(a)
a<-table.row.start(a)
a<-table.element(a,'T-STAT',header=TRUE)
a<-table.element(a,summary(lnlm1)$coefficients[2,3])
a<-table.row.end(a)
a<-table.row.start(a)
a<-table.element(a,'p-value',header=TRUE)
a<-table.element(a,summary(lnlm1)$coefficients[2,4])
a<-table.row.end(a)
a<-table.row.start(a)
a<-table.element(a,'Lambda',header=TRUE)
a<-table.element(a,1-lnlm1$coefficients[[2]])
a<-table.row.end(a)
a<-table.end(a)
table.save(a,file='mytable2.tab')