Free Statistics

of Irreproducible Research!

Author's title

Author*The author of this computation has been verified*
R Software Modulerwasp_arimabackwardselection.wasp
Title produced by softwareARIMA Backward Selection
Date of computationSun, 14 Dec 2008 06:36:42 -0700
Cite this page as followsStatistical Computations at FreeStatistics.org, Office for Research Development and Education, URL https://freestatistics.org/blog/index.php?v=date/2008/Dec/14/t1229261865aitt6224danr9ov.htm/, Retrieved Wed, 15 May 2024 05:34:02 +0000
Statistical Computations at FreeStatistics.org, Office for Research Development and Education, URL https://freestatistics.org/blog/index.php?pk=33368, Retrieved Wed, 15 May 2024 05:34:02 +0000
QR Codes:

Original text written by user:
IsPrivate?No (this computation is public)
User-defined keywords
Estimated Impact162
Family? (F = Feedback message, R = changed R code, M = changed R Module, P = changed Parameters, D = changed Data)
F     [ARIMA Backward Selection] [Step5] [2008-12-09 20:14:49] [bd6e9fd01b4fddda83ee6fb85abada8c]
-   PD    [ARIMA Backward Selection] [verbetering] [2008-12-14 13:36:42] [821c4b3d195be8e737cf8c9dc649d3cf] [Current]
Feedback Forum

Post a new message
Dataseries X:
1846.5
2796.3
2895.6
2472.2
2584.4
2630.4
2663.1
3176.2
2856.7
2551.4
3088.7
2628.3
2226.2
3023.6
3077.9
3084.1
2990.3
2949.6
3014.7
3517.7
3121.2
3067.4
3174.6
2676.3
2424
3195.1
3146.6
3506.7
3528.5
3365.1
3153
3843.3
3123.2
3361.1
3481.9
2970.5
2537
3257.6
3301.3
3391.6
2933.6
3283.2
3139.7
3486.4
3202.2
3294.4
3550.3
3279.3
2678.6
3451.4
3977.1
3814.8
3310.5
3971.8
4051.9
4057.6
4391.4
3628.9
4092.2
3822.5


Summary of computational transaction
Raw Inputview raw input (R code)
Raw Outputview raw output of R engine
Computing time7 seconds
R Server'George Udny Yule' @ 72.249.76.132

\begin{tabular}{lllllllll}
\hline
Summary of computational transaction \tabularnewline
Raw Input & view raw input (R code)  \tabularnewline
Raw Output & view raw output of R engine  \tabularnewline
Computing time & 7 seconds \tabularnewline
R Server & 'George Udny Yule' @ 72.249.76.132 \tabularnewline
\hline
\end{tabular}
%Source: https://freestatistics.org/blog/index.php?pk=33368&T=0

[TABLE]
[ROW][C]Summary of computational transaction[/C][/ROW]
[ROW][C]Raw Input[/C][C]view raw input (R code) [/C][/ROW]
[ROW][C]Raw Output[/C][C]view raw output of R engine [/C][/ROW]
[ROW][C]Computing time[/C][C]7 seconds[/C][/ROW]
[ROW][C]R Server[/C][C]'George Udny Yule' @ 72.249.76.132[/C][/ROW]
[/TABLE]
Source: https://freestatistics.org/blog/index.php?pk=33368&T=0

Globally Unique Identifier (entire table): ba.freestatistics.org/blog/index.php?pk=33368&T=0

As an alternative you can also use a QR Code:  

The GUIDs for individual cells are displayed in the table below:

Summary of computational transaction
Raw Inputview raw input (R code)
Raw Outputview raw output of R engine
Computing time7 seconds
R Server'George Udny Yule' @ 72.249.76.132


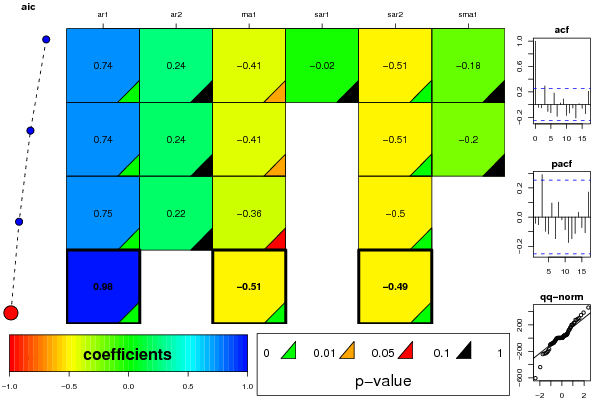
ARIMA Parameter Estimation and Backward Selection
Iterationar1ar2ma1sar1sar2sma1
Estimates ( 1 )0.74220.2414-0.4074-0.0196-0.5113-0.1804
(p-val)(7e-04 )(0.2369 )(0.031 )(0.9618 )(0.005 )(0.7259 )
Estimates ( 2 )0.74380.24-0.40710-0.5073-0.2008
(p-val)(6e-04 )(0.2362 )(0.0312 )(NA )(0.0015 )(0.4719 )
Estimates ( 3 )0.74990.2228-0.36080-0.49710
(p-val)(0.0011 )(0.29 )(0.0623 )(NA )(0.0029 )(NA )
Estimates ( 4 )0.98010-0.50860-0.48650
(p-val)(0 )(NA )(0 )(NA )(0.0038 )(NA )
Estimates ( 5 )NANANANANANA
(p-val)(NA )(NA )(NA )(NA )(NA )(NA )
Estimates ( 6 )NANANANANANA
(p-val)(NA )(NA )(NA )(NA )(NA )(NA )
Estimates ( 7 )NANANANANANA
(p-val)(NA )(NA )(NA )(NA )(NA )(NA )
Estimates ( 8 )NANANANANANA
(p-val)(NA )(NA )(NA )(NA )(NA )(NA )
Estimates ( 9 )NANANANANANA
(p-val)(NA )(NA )(NA )(NA )(NA )(NA )
Estimates ( 10 )NANANANANANA
(p-val)(NA )(NA )(NA )(NA )(NA )(NA )
Estimates ( 11 )NANANANANANA
(p-val)(NA )(NA )(NA )(NA )(NA )(NA )

\begin{tabular}{lllllllll}
\hline
ARIMA Parameter Estimation and Backward Selection \tabularnewline
Iteration & ar1 & ar2 & ma1 & sar1 & sar2 & sma1 \tabularnewline
Estimates ( 1 ) & 0.7422 & 0.2414 & -0.4074 & -0.0196 & -0.5113 & -0.1804 \tabularnewline
(p-val) & (7e-04 ) & (0.2369 ) & (0.031 ) & (0.9618 ) & (0.005 ) & (0.7259 ) \tabularnewline
Estimates ( 2 ) & 0.7438 & 0.24 & -0.4071 & 0 & -0.5073 & -0.2008 \tabularnewline
(p-val) & (6e-04 ) & (0.2362 ) & (0.0312 ) & (NA ) & (0.0015 ) & (0.4719 ) \tabularnewline
Estimates ( 3 ) & 0.7499 & 0.2228 & -0.3608 & 0 & -0.4971 & 0 \tabularnewline
(p-val) & (0.0011 ) & (0.29 ) & (0.0623 ) & (NA ) & (0.0029 ) & (NA ) \tabularnewline
Estimates ( 4 ) & 0.9801 & 0 & -0.5086 & 0 & -0.4865 & 0 \tabularnewline
(p-val) & (0 ) & (NA ) & (0 ) & (NA ) & (0.0038 ) & (NA ) \tabularnewline
Estimates ( 5 ) & NA & NA & NA & NA & NA & NA \tabularnewline
(p-val) & (NA ) & (NA ) & (NA ) & (NA ) & (NA ) & (NA ) \tabularnewline
Estimates ( 6 ) & NA & NA & NA & NA & NA & NA \tabularnewline
(p-val) & (NA ) & (NA ) & (NA ) & (NA ) & (NA ) & (NA ) \tabularnewline
Estimates ( 7 ) & NA & NA & NA & NA & NA & NA \tabularnewline
(p-val) & (NA ) & (NA ) & (NA ) & (NA ) & (NA ) & (NA ) \tabularnewline
Estimates ( 8 ) & NA & NA & NA & NA & NA & NA \tabularnewline
(p-val) & (NA ) & (NA ) & (NA ) & (NA ) & (NA ) & (NA ) \tabularnewline
Estimates ( 9 ) & NA & NA & NA & NA & NA & NA \tabularnewline
(p-val) & (NA ) & (NA ) & (NA ) & (NA ) & (NA ) & (NA ) \tabularnewline
Estimates ( 10 ) & NA & NA & NA & NA & NA & NA \tabularnewline
(p-val) & (NA ) & (NA ) & (NA ) & (NA ) & (NA ) & (NA ) \tabularnewline
Estimates ( 11 ) & NA & NA & NA & NA & NA & NA \tabularnewline
(p-val) & (NA ) & (NA ) & (NA ) & (NA ) & (NA ) & (NA ) \tabularnewline
\hline
\end{tabular}
%Source: https://freestatistics.org/blog/index.php?pk=33368&T=1

[TABLE]
[ROW][C]ARIMA Parameter Estimation and Backward Selection[/C][/ROW]
[ROW][C]Iteration[/C][C]ar1[/C][C]ar2[/C][C]ma1[/C][C]sar1[/C][C]sar2[/C][C]sma1[/C][/ROW]
[ROW][C]Estimates ( 1 )[/C][C]0.7422[/C][C]0.2414[/C][C]-0.4074[/C][C]-0.0196[/C][C]-0.5113[/C][C]-0.1804[/C][/ROW]
[ROW][C](p-val)[/C][C](7e-04 )[/C][C](0.2369 )[/C][C](0.031 )[/C][C](0.9618 )[/C][C](0.005 )[/C][C](0.7259 )[/C][/ROW]
[ROW][C]Estimates ( 2 )[/C][C]0.7438[/C][C]0.24[/C][C]-0.4071[/C][C]0[/C][C]-0.5073[/C][C]-0.2008[/C][/ROW]
[ROW][C](p-val)[/C][C](6e-04 )[/C][C](0.2362 )[/C][C](0.0312 )[/C][C](NA )[/C][C](0.0015 )[/C][C](0.4719 )[/C][/ROW]
[ROW][C]Estimates ( 3 )[/C][C]0.7499[/C][C]0.2228[/C][C]-0.3608[/C][C]0[/C][C]-0.4971[/C][C]0[/C][/ROW]
[ROW][C](p-val)[/C][C](0.0011 )[/C][C](0.29 )[/C][C](0.0623 )[/C][C](NA )[/C][C](0.0029 )[/C][C](NA )[/C][/ROW]
[ROW][C]Estimates ( 4 )[/C][C]0.9801[/C][C]0[/C][C]-0.5086[/C][C]0[/C][C]-0.4865[/C][C]0[/C][/ROW]
[ROW][C](p-val)[/C][C](0 )[/C][C](NA )[/C][C](0 )[/C][C](NA )[/C][C](0.0038 )[/C][C](NA )[/C][/ROW]
[ROW][C]Estimates ( 5 )[/C][C]NA[/C][C]NA[/C][C]NA[/C][C]NA[/C][C]NA[/C][C]NA[/C][/ROW]
[ROW][C](p-val)[/C][C](NA )[/C][C](NA )[/C][C](NA )[/C][C](NA )[/C][C](NA )[/C][C](NA )[/C][/ROW]
[ROW][C]Estimates ( 6 )[/C][C]NA[/C][C]NA[/C][C]NA[/C][C]NA[/C][C]NA[/C][C]NA[/C][/ROW]
[ROW][C](p-val)[/C][C](NA )[/C][C](NA )[/C][C](NA )[/C][C](NA )[/C][C](NA )[/C][C](NA )[/C][/ROW]
[ROW][C]Estimates ( 7 )[/C][C]NA[/C][C]NA[/C][C]NA[/C][C]NA[/C][C]NA[/C][C]NA[/C][/ROW]
[ROW][C](p-val)[/C][C](NA )[/C][C](NA )[/C][C](NA )[/C][C](NA )[/C][C](NA )[/C][C](NA )[/C][/ROW]
[ROW][C]Estimates ( 8 )[/C][C]NA[/C][C]NA[/C][C]NA[/C][C]NA[/C][C]NA[/C][C]NA[/C][/ROW]
[ROW][C](p-val)[/C][C](NA )[/C][C](NA )[/C][C](NA )[/C][C](NA )[/C][C](NA )[/C][C](NA )[/C][/ROW]
[ROW][C]Estimates ( 9 )[/C][C]NA[/C][C]NA[/C][C]NA[/C][C]NA[/C][C]NA[/C][C]NA[/C][/ROW]
[ROW][C](p-val)[/C][C](NA )[/C][C](NA )[/C][C](NA )[/C][C](NA )[/C][C](NA )[/C][C](NA )[/C][/ROW]
[ROW][C]Estimates ( 10 )[/C][C]NA[/C][C]NA[/C][C]NA[/C][C]NA[/C][C]NA[/C][C]NA[/C][/ROW]
[ROW][C](p-val)[/C][C](NA )[/C][C](NA )[/C][C](NA )[/C][C](NA )[/C][C](NA )[/C][C](NA )[/C][/ROW]
[ROW][C]Estimates ( 11 )[/C][C]NA[/C][C]NA[/C][C]NA[/C][C]NA[/C][C]NA[/C][C]NA[/C][/ROW]
[ROW][C](p-val)[/C][C](NA )[/C][C](NA )[/C][C](NA )[/C][C](NA )[/C][C](NA )[/C][C](NA )[/C][/ROW]
[/TABLE]
Source: https://freestatistics.org/blog/index.php?pk=33368&T=1

Globally Unique Identifier (entire table): ba.freestatistics.org/blog/index.php?pk=33368&T=1

As an alternative you can also use a QR Code:  

The GUIDs for individual cells are displayed in the table below:

ARIMA Parameter Estimation and Backward Selection
Iterationar1ar2ma1sar1sar2sma1
Estimates ( 1 )0.74220.2414-0.4074-0.0196-0.5113-0.1804
(p-val)(7e-04 )(0.2369 )(0.031 )(0.9618 )(0.005 )(0.7259 )
Estimates ( 2 )0.74380.24-0.40710-0.5073-0.2008
(p-val)(6e-04 )(0.2362 )(0.0312 )(NA )(0.0015 )(0.4719 )
Estimates ( 3 )0.74990.2228-0.36080-0.49710
(p-val)(0.0011 )(0.29 )(0.0623 )(NA )(0.0029 )(NA )
Estimates ( 4 )0.98010-0.50860-0.48650
(p-val)(0 )(NA )(0 )(NA )(0.0038 )(NA )
Estimates ( 5 )NANANANANANA
(p-val)(NA )(NA )(NA )(NA )(NA )(NA )
Estimates ( 6 )NANANANANANA
(p-val)(NA )(NA )(NA )(NA )(NA )(NA )
Estimates ( 7 )NANANANANANA
(p-val)(NA )(NA )(NA )(NA )(NA )(NA )
Estimates ( 8 )NANANANANANA
(p-val)(NA )(NA )(NA )(NA )(NA )(NA )
Estimates ( 9 )NANANANANANA
(p-val)(NA )(NA )(NA )(NA )(NA )(NA )
Estimates ( 10 )NANANANANANA
(p-val)(NA )(NA )(NA )(NA )(NA )(NA )
Estimates ( 11 )NANANANANANA
(p-val)(NA )(NA )(NA )(NA )(NA )(NA )


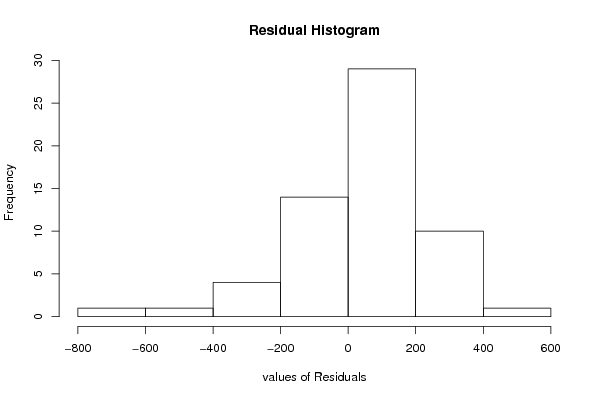
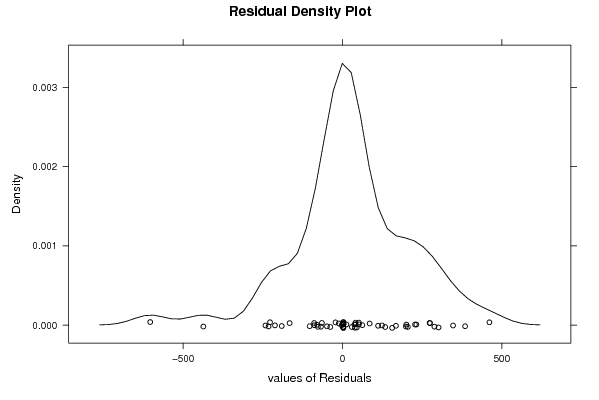
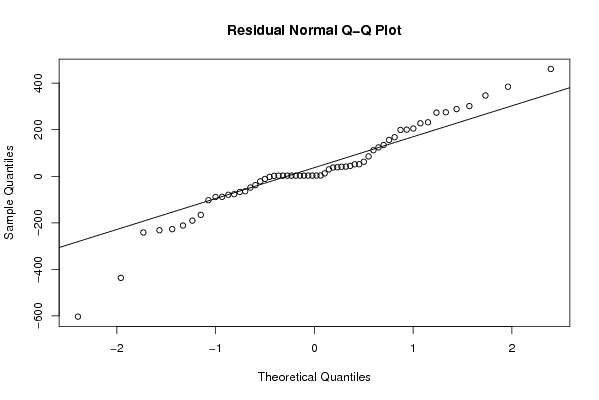
Estimated ARIMA Residuals
Value
2.62819039212997
167.805319131688
-64.4832606325364
-77.1218474335752
347.039984072395
51.4384733532109
-79.6069334734106
-2.54248624143037
12.4468774592791
-48.590124608712
200.329698670183
-231.915160844983
-190.623878015465
62.3040302640346
41.2689372544
-67.4243139737208
273.461481388127
288.574420358166
44.7635114669074
-227.334247099782
40.7605071784888
-211.804250272405
124.127565550426
134.071072397557
51.6936771582164
-88.9870886617614
-165.907062653418
-11.5651115494259
-38.1481230709128
-603.303005134494
111.812089587022
231.845027344008
-241.700864291202
227.641302631231
155.782688071699
-21.9314968382758
199.137798927114
37.540688073785
38.5409088690271
461.123573973949
205.040138127808
85.2998363136187
301.52206216355
274.838820432923
-102.899590696299
384.74497286886
-436.607129587580
-88.4181589648439
29.5292493410766

\begin{tabular}{lllllllll}
\hline
Estimated ARIMA Residuals \tabularnewline
Value \tabularnewline
2.62819039212997 \tabularnewline
167.805319131688 \tabularnewline
-64.4832606325364 \tabularnewline
-77.1218474335752 \tabularnewline
347.039984072395 \tabularnewline
51.4384733532109 \tabularnewline
-79.6069334734106 \tabularnewline
-2.54248624143037 \tabularnewline
12.4468774592791 \tabularnewline
-48.590124608712 \tabularnewline
200.329698670183 \tabularnewline
-231.915160844983 \tabularnewline
-190.623878015465 \tabularnewline
62.3040302640346 \tabularnewline
41.2689372544 \tabularnewline
-67.4243139737208 \tabularnewline
273.461481388127 \tabularnewline
288.574420358166 \tabularnewline
44.7635114669074 \tabularnewline
-227.334247099782 \tabularnewline
40.7605071784888 \tabularnewline
-211.804250272405 \tabularnewline
124.127565550426 \tabularnewline
134.071072397557 \tabularnewline
51.6936771582164 \tabularnewline
-88.9870886617614 \tabularnewline
-165.907062653418 \tabularnewline
-11.5651115494259 \tabularnewline
-38.1481230709128 \tabularnewline
-603.303005134494 \tabularnewline
111.812089587022 \tabularnewline
231.845027344008 \tabularnewline
-241.700864291202 \tabularnewline
227.641302631231 \tabularnewline
155.782688071699 \tabularnewline
-21.9314968382758 \tabularnewline
199.137798927114 \tabularnewline
37.540688073785 \tabularnewline
38.5409088690271 \tabularnewline
461.123573973949 \tabularnewline
205.040138127808 \tabularnewline
85.2998363136187 \tabularnewline
301.52206216355 \tabularnewline
274.838820432923 \tabularnewline
-102.899590696299 \tabularnewline
384.74497286886 \tabularnewline
-436.607129587580 \tabularnewline
-88.4181589648439 \tabularnewline
29.5292493410766 \tabularnewline
\hline
\end{tabular}
%Source: https://freestatistics.org/blog/index.php?pk=33368&T=2

[TABLE]
[ROW][C]Estimated ARIMA Residuals[/C][/ROW]
[ROW][C]Value[/C][/ROW]
[ROW][C]2.62819039212997[/C][/ROW]
[ROW][C]167.805319131688[/C][/ROW]
[ROW][C]-64.4832606325364[/C][/ROW]
[ROW][C]-77.1218474335752[/C][/ROW]
[ROW][C]347.039984072395[/C][/ROW]
[ROW][C]51.4384733532109[/C][/ROW]
[ROW][C]-79.6069334734106[/C][/ROW]
[ROW][C]-2.54248624143037[/C][/ROW]
[ROW][C]12.4468774592791[/C][/ROW]
[ROW][C]-48.590124608712[/C][/ROW]
[ROW][C]200.329698670183[/C][/ROW]
[ROW][C]-231.915160844983[/C][/ROW]
[ROW][C]-190.623878015465[/C][/ROW]
[ROW][C]62.3040302640346[/C][/ROW]
[ROW][C]41.2689372544[/C][/ROW]
[ROW][C]-67.4243139737208[/C][/ROW]
[ROW][C]273.461481388127[/C][/ROW]
[ROW][C]288.574420358166[/C][/ROW]
[ROW][C]44.7635114669074[/C][/ROW]
[ROW][C]-227.334247099782[/C][/ROW]
[ROW][C]40.7605071784888[/C][/ROW]
[ROW][C]-211.804250272405[/C][/ROW]
[ROW][C]124.127565550426[/C][/ROW]
[ROW][C]134.071072397557[/C][/ROW]
[ROW][C]51.6936771582164[/C][/ROW]
[ROW][C]-88.9870886617614[/C][/ROW]
[ROW][C]-165.907062653418[/C][/ROW]
[ROW][C]-11.5651115494259[/C][/ROW]
[ROW][C]-38.1481230709128[/C][/ROW]
[ROW][C]-603.303005134494[/C][/ROW]
[ROW][C]111.812089587022[/C][/ROW]
[ROW][C]231.845027344008[/C][/ROW]
[ROW][C]-241.700864291202[/C][/ROW]
[ROW][C]227.641302631231[/C][/ROW]
[ROW][C]155.782688071699[/C][/ROW]
[ROW][C]-21.9314968382758[/C][/ROW]
[ROW][C]199.137798927114[/C][/ROW]
[ROW][C]37.540688073785[/C][/ROW]
[ROW][C]38.5409088690271[/C][/ROW]
[ROW][C]461.123573973949[/C][/ROW]
[ROW][C]205.040138127808[/C][/ROW]
[ROW][C]85.2998363136187[/C][/ROW]
[ROW][C]301.52206216355[/C][/ROW]
[ROW][C]274.838820432923[/C][/ROW]
[ROW][C]-102.899590696299[/C][/ROW]
[ROW][C]384.74497286886[/C][/ROW]
[ROW][C]-436.607129587580[/C][/ROW]
[ROW][C]-88.4181589648439[/C][/ROW]
[ROW][C]29.5292493410766[/C][/ROW]
[/TABLE]
Source: https://freestatistics.org/blog/index.php?pk=33368&T=2

Globally Unique Identifier (entire table): ba.freestatistics.org/blog/index.php?pk=33368&T=2

As an alternative you can also use a QR Code:  

The GUIDs for individual cells are displayed in the table below:

Estimated ARIMA Residuals
Value
2.62819039212997
167.805319131688
-64.4832606325364
-77.1218474335752
347.039984072395
51.4384733532109
-79.6069334734106
-2.54248624143037
12.4468774592791
-48.590124608712
200.329698670183
-231.915160844983
-190.623878015465
62.3040302640346
41.2689372544
-67.4243139737208
273.461481388127
288.574420358166
44.7635114669074
-227.334247099782
40.7605071784888
-211.804250272405
124.127565550426
134.071072397557
51.6936771582164
-88.9870886617614
-165.907062653418
-11.5651115494259
-38.1481230709128
-603.303005134494
111.812089587022
231.845027344008
-241.700864291202
227.641302631231
155.782688071699
-21.9314968382758
199.137798927114
37.540688073785
38.5409088690271
461.123573973949
205.040138127808
85.2998363136187
301.52206216355
274.838820432923
-102.899590696299
384.74497286886
-436.607129587580
-88.4181589648439
29.5292493410766


Parameters (Session):
par1 = 1 ; par2 = 0 ; par3 = 0 ; par4 = 12 ;
Parameters (R input):
par1 = FALSE ; par2 = 1 ; par3 = 0 ; par4 = 1 ; par5 = 12 ; par6 = 2 ; par7 = 1 ; par8 = 2 ; par9 = 1 ;
R code (references can be found in the software module):
library(lattice)
if (par1 == 'TRUE') par1 <- TRUE
if (par1 == 'FALSE') par1 <- FALSE
par2 <- as.numeric(par2) #Box-Cox lambda transformation parameter
par3 <- as.numeric(par3) #degree of non-seasonal differencing
par4 <- as.numeric(par4) #degree of seasonal differencing
par5 <- as.numeric(par5) #seasonal period
par6 <- as.numeric(par6) #degree (p) of the non-seasonal AR(p) polynomial
par7 <- as.numeric(par7) #degree (q) of the non-seasonal MA(q) polynomial
par8 <- as.numeric(par8) #degree (P) of the seasonal AR(P) polynomial
par9 <- as.numeric(par9) #degree (Q) of the seasonal MA(Q) polynomial
armaGR <- function(arima.out, names, n){
try1 <- arima.out$coef
try2 <- sqrt(diag(arima.out$var.coef))
try.data.frame <- data.frame(matrix(NA,ncol=4,nrow=length(names)))
dimnames(try.data.frame) <- list(names,c('coef','std','tstat','pv'))
try.data.frame[,1] <- try1
for(i in 1:length(try2)) try.data.frame[which(rownames(try.data.frame)==names(try2)[i]),2] <- try2[i]
try.data.frame[,3] <- try.data.frame[,1] / try.data.frame[,2]
try.data.frame[,4] <- round((1-pt(abs(try.data.frame[,3]),df=n-(length(try2)+1)))*2,5)
vector <- rep(NA,length(names))
vector[is.na(try.data.frame[,4])] <- 0
maxi <- which.max(try.data.frame[,4])
continue <- max(try.data.frame[,4],na.rm=TRUE) > .05
vector[maxi] <- 0
list(summary=try.data.frame,next.vector=vector,continue=continue)
}
arimaSelect <- function(series, order=c(13,0,0), seasonal=list(order=c(2,0,0),period=12), include.mean=F){
nrc <- order[1]+order[3]+seasonal$order[1]+seasonal$order[3]
coeff <- matrix(NA, nrow=nrc*2, ncol=nrc)
pval <- matrix(NA, nrow=nrc*2, ncol=nrc)
mylist <- rep(list(NULL), nrc)
names <- NULL
if(order[1] > 0) names <- paste('ar',1:order[1],sep='')
if(order[3] > 0) names <- c( names , paste('ma',1:order[3],sep='') )
if(seasonal$order[1] > 0) names <- c(names, paste('sar',1:seasonal$order[1],sep=''))
if(seasonal$order[3] > 0) names <- c(names, paste('sma',1:seasonal$order[3],sep=''))
arima.out <- arima(series, order=order, seasonal=seasonal, include.mean=include.mean, method='ML')
mylist[[1]] <- arima.out
last.arma <- armaGR(arima.out, names, length(series))
mystop <- FALSE
i <- 1
coeff[i,] <- last.arma[[1]][,1]
pval [i,] <- last.arma[[1]][,4]
i <- 2
aic <- arima.out$aic
while(!mystop){
mylist[[i]] <- arima.out
arima.out <- arima(series, order=order, seasonal=seasonal, include.mean=include.mean, method='ML', fixed=last.arma$next.vector)
aic <- c(aic, arima.out$aic)
last.arma <- armaGR(arima.out, names, length(series))
mystop <- !last.arma$continue
coeff[i,] <- last.arma[[1]][,1]
pval [i,] <- last.arma[[1]][,4]
i <- i+1
}
list(coeff, pval, mylist, aic=aic)
}
arimaSelectplot <- function(arimaSelect.out,noms,choix){
noms <- names(arimaSelect.out[[3]][[1]]$coef)
coeff <- arimaSelect.out[[1]]
k <- min(which(is.na(coeff[,1])))-1
coeff <- coeff[1:k,]
pval <- arimaSelect.out[[2]][1:k,]
aic <- arimaSelect.out$aic[1:k]
coeff[coeff==0] <- NA
n <- ncol(coeff)
if(missing(choix)) choix <- k
layout(matrix(c(1,1,1,2,
3,3,3,2,
3,3,3,4,
5,6,7,7),nr=4),
widths=c(10,35,45,15),
heights=c(30,30,15,15))
couleurs <- rainbow(75)[1:50]#(50)
ticks <- pretty(coeff)
par(mar=c(1,1,3,1))
plot(aic,k:1-.5,type='o',pch=21,bg='blue',cex=2,axes=F,lty=2,xpd=NA)
points(aic[choix],k-choix+.5,pch=21,cex=4,bg=2,xpd=NA)
title('aic',line=2)
par(mar=c(3,0,0,0))
plot(0,axes=F,xlab='',ylab='',xlim=range(ticks),ylim=c(.1,1))
rect(xleft = min(ticks) + (0:49)/50*(max(ticks)-min(ticks)),
xright = min(ticks) + (1:50)/50*(max(ticks)-min(ticks)),
ytop = rep(1,50),
ybottom= rep(0,50),col=couleurs,border=NA)
axis(1,ticks)
rect(xleft=min(ticks),xright=max(ticks),ytop=1,ybottom=0)
text(mean(coeff,na.rm=T),.5,'coefficients',cex=2,font=2)
par(mar=c(1,1,3,1))
image(1:n,1:k,t(coeff[k:1,]),axes=F,col=couleurs,zlim=range(ticks))
for(i in 1:n) for(j in 1:k) if(!is.na(coeff[j,i])) {
if(pval[j,i]<.01) symb = 'green'
else if( (pval[j,i]<.05) & (pval[j,i]>=.01)) symb = 'orange'
else if( (pval[j,i]<.1) & (pval[j,i]>=.05)) symb = 'red'
else symb = 'black'
polygon(c(i+.5 ,i+.2 ,i+.5 ,i+.5),
c(k-j+0.5,k-j+0.5,k-j+0.8,k-j+0.5),
col=symb)
if(j==choix) {
rect(xleft=i-.5,
xright=i+.5,
ybottom=k-j+1.5,
ytop=k-j+.5,
lwd=4)
text(i,
k-j+1,
round(coeff[j,i],2),
cex=1.2,
font=2)
}
else{
rect(xleft=i-.5,xright=i+.5,ybottom=k-j+1.5,ytop=k-j+.5)
text(i,k-j+1,round(coeff[j,i],2),cex=1.2,font=1)
}
}
axis(3,1:n,noms)
par(mar=c(0.5,0,0,0.5))
plot(0,axes=F,xlab='',ylab='',type='n',xlim=c(0,8),ylim=c(-.2,.8))
cols <- c('green','orange','red','black')
niv <- c('0','0.01','0.05','0.1')
for(i in 0:3){
polygon(c(1+2*i ,1+2*i ,1+2*i-.5 ,1+2*i),
c(.4 ,.7 , .4 , .4),
col=cols[i+1])
text(2*i,0.5,niv[i+1],cex=1.5)
}
text(8,.5,1,cex=1.5)
text(4,0,'p-value',cex=2)
box()
residus <- arimaSelect.out[[3]][[choix]]$res
par(mar=c(1,2,4,1))
acf(residus,main='')
title('acf',line=.5)
par(mar=c(1,2,4,1))
pacf(residus,main='')
title('pacf',line=.5)
par(mar=c(2,2,4,1))
qqnorm(residus,main='')
title('qq-norm',line=.5)
qqline(residus)
residus
}
if (par2 == 0) x <- log(x)
if (par2 != 0) x <- x^par2
(selection <- arimaSelect(x, order=c(par6,par3,par7), seasonal=list(order=c(par8,par4,par9), period=par5)))
bitmap(file='test1.png')
resid <- arimaSelectplot(selection)
dev.off()
resid
bitmap(file='test2.png')
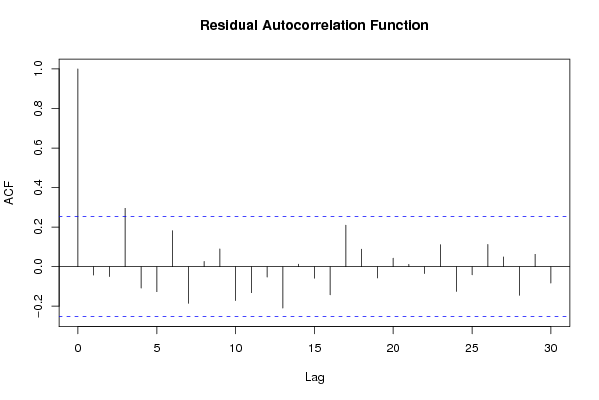
acf(resid,length(resid)/2, main='Residual Autocorrelation Function')
dev.off()
bitmap(file='test3.png')
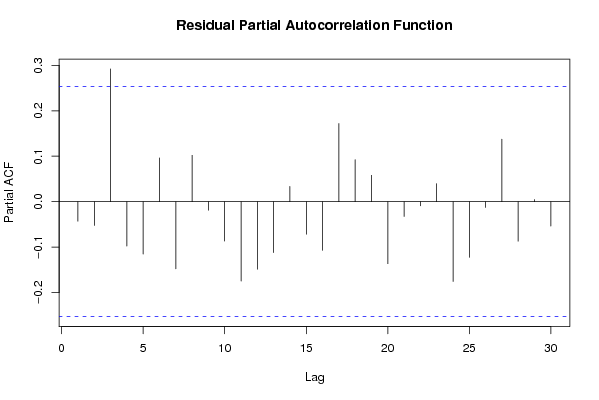
pacf(resid,length(resid)/2, main='Residual Partial Autocorrelation Function')
dev.off()
bitmap(file='test4.png')
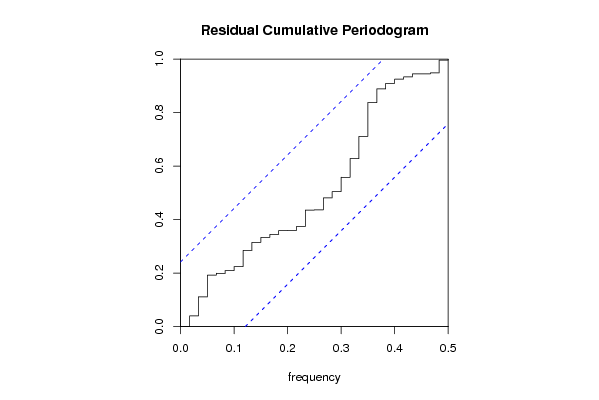
cpgram(resid, main='Residual Cumulative Periodogram')
dev.off()
bitmap(file='test5.png')
hist(resid, main='Residual Histogram', xlab='values of Residuals')
dev.off()
bitmap(file='test6.png')
densityplot(~resid,col='black',main='Residual Density Plot', xlab='values of Residuals')
dev.off()
bitmap(file='test7.png')
qqnorm(resid, main='Residual Normal Q-Q Plot')
qqline(resid)
dev.off()
ncols <- length(selection[[1]][1,])
nrows <- length(selection[[2]][,1])-1
load(file='createtable')
a<-table.start()
a<-table.row.start(a)
a<-table.element(a,'ARIMA Parameter Estimation and Backward Selection', ncols+1,TRUE)
a<-table.row.end(a)
a<-table.row.start(a)
a<-table.element(a,'Iteration', header=TRUE)
for (i in 1:ncols) {
a<-table.element(a,names(selection[[3]][[1]]$coef)[i],header=TRUE)
}
a<-table.row.end(a)
for (j in 1:nrows) {
a<-table.row.start(a)
mydum <- 'Estimates ('
mydum <- paste(mydum,j)
mydum <- paste(mydum,')')
a<-table.element(a,mydum, header=TRUE)
for (i in 1:ncols) {
a<-table.element(a,round(selection[[1]][j,i],4))
}
a<-table.row.end(a)
a<-table.row.start(a)
a<-table.element(a,'(p-val)', header=TRUE)
for (i in 1:ncols) {
mydum <- '('
mydum <- paste(mydum,round(selection[[2]][j,i],4),sep='')
mydum <- paste(mydum,')')
a<-table.element(a,mydum)
}
a<-table.row.end(a)
}
a<-table.end(a)
table.save(a,file='mytable.tab')
a<-table.start()
a<-table.row.start(a)
a<-table.element(a,'Estimated ARIMA Residuals', 1,TRUE)
a<-table.row.end(a)
a<-table.row.start(a)
a<-table.element(a,'Value', 1,TRUE)
a<-table.row.end(a)
for (i in (par4*par5+par3):length(resid)) {
a<-table.row.start(a)
a<-table.element(a,resid[i])
a<-table.row.end(a)
}
a<-table.end(a)
table.save(a,file='mytable1.tab')