Free Statistics

of Irreproducible Research!

Author's title

Author*The author of this computation has been verified*
R Software Modulerwasp_arimaforecasting.wasp
Title produced by softwareARIMA Forecasting
Date of computationSun, 14 Dec 2008 06:00:41 -0700
Cite this page as followsStatistical Computations at FreeStatistics.org, Office for Research Development and Education, URL https://freestatistics.org/blog/index.php?v=date/2008/Dec/14/t1229261294gop33j376jq4hr7.htm/, Retrieved Wed, 15 May 2024 14:54:33 +0000
Statistical Computations at FreeStatistics.org, Office for Research Development and Education, URL https://freestatistics.org/blog/index.php?pk=33359, Retrieved Wed, 15 May 2024 14:54:33 +0000
QR Codes:

Original text written by user:
IsPrivate?No (this computation is public)
User-defined keywords
Estimated Impact252
Family? (F = Feedback message, R = changed R code, M = changed R Module, P = changed Parameters, D = changed Data)
-     [Univariate Data Series] [data set] [2008-12-01 19:54:57] [b98453cac15ba1066b407e146608df68]
-   PD  [Univariate Data Series] [Werkloosheids Bel...] [2008-12-03 18:39:41] [74be16979710d4c4e7c6647856088456]
-   PD    [Univariate Data Series] [Werkloosheids Bel...] [2008-12-03 18:47:55] [74be16979710d4c4e7c6647856088456]
-   PD      [Univariate Data Series] [Paper: tijdreeks ...] [2008-12-05 09:45:57] [74be16979710d4c4e7c6647856088456]
F RMPD          [ARIMA Forecasting] [Arima Forecast] [2008-12-14 13:00:41] [07b7cf1321bc38017c2c7efcf91ca696] [Current]
Feedback Forum
2008-12-21 15:05:47 [Olivier Uyttendaele] [reply
je hebt volgens mij het model goed uitgevoerd;

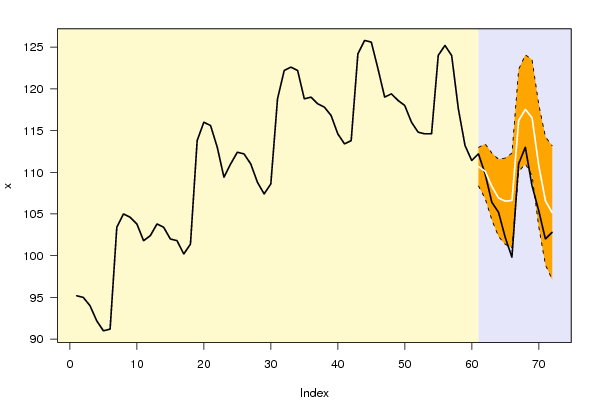
de software gaat de laatste 12 waarden van de reeks 'afknippen' en zelf een voorspelling maken. Deze voorspelling wordt dan vergeleken met de effectieve reeks. De bedoeling hiervan is heel praktisch. Je kan nl bekijken waar er significant verschillende resultaten waar te nemen zijn; dit zou dan impliceren dat (cf ceteris paribus voorwaarde) er een externe invloed was op de reeks.

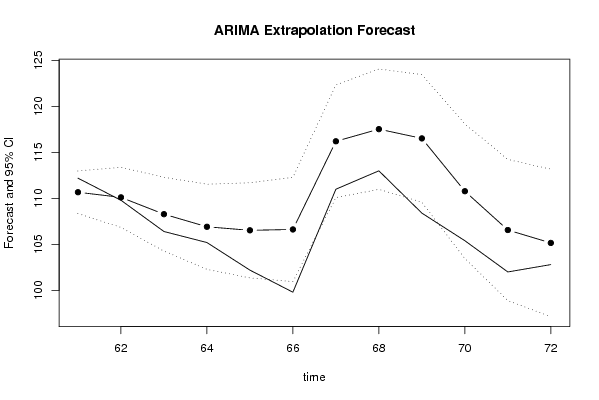
in je document schreef je dat het een goede voorspelling was, ik zou dit toch willen nuanceren, het is zeker geen slechte voorspelling, maar de voorspelde waarden balanceren toch op het B-interval.
2008-12-22 17:16:55 [] [reply
goede berekening en goede conclusie, toch een kleine opmerking; zoals Olivier ook al zei, balanceren de voorspelde waarden op het B-interval
2008-12-22 18:54:47 [Jan Van Riet] [reply
Je vergeet te vermelden dat je op de grafiek ziet dat het gevonden betrouwbaarheidsinterval vrij nauw aansluit bij je voorspelling. Dit duidt erop dat deze tijdreeks redelijk goed valt te voorspellen (op basis van de geschiedenis). Dit lijkt me toch belangrijk om weten.
2008-12-22 18:58:44 [Jan Van Riet] [reply
step 3:

Het zijn de werkelijke waarden die buiten het betrouwbaarheidsinterval liggen op lag 66 en 69, en niet de voorspelde waarden zoals je zei. Dit zou nooit kunnen trouwens, want het betrouwbaarheidsinterval is opgebouwd rond de voorspelde waarden.
2008-12-22 20:09:31 [Kevin Truyts] [reply
Step 3:

De student heeft de verkeerde tabel genomen om te beoordelen. Er moest de kleinste tabel gekozen worden. Hier gaan we dan kijken naar de voorspellingsfout (% S.E.). Deze is klein waardoor we kunnen stellen dat de voorspellingsfout ook klein is voor de komende voorspelde perioden.

Post a new message
Dataseries X:
95.20
95.00
94.00
92.20
91.00
91.20
103.40
105.00
104.60
103.80
101.80
102.40
103.80
103.40
102.00
101.80
100.20
101.40
113.80
116.00
115.60
113.00
109.40
111.00
112.40
112.20
111.00
108.80
107.40
108.60
118.80
122.20
122.60
122.20
118.80
119.00
118.20
117.80
116.80
114.60
113.40
113.80
124.20
125.80
125.60
122.40
119.00
119.40
118.60
118.00
116.00
114.80
114.60
114.60
124.00
125.20
124.00
117.60
113.20
111.40
112.20
109.80
106.40
105.20
102.20
99.80
111.00
113.00
108.40
105.40
102.00
102.80


Summary of computational transaction
Raw Inputview raw input (R code)
Raw Outputview raw output of R engine
Computing time1 seconds
R Server'Gwilym Jenkins' @ 72.249.127.135

\begin{tabular}{lllllllll}
\hline
Summary of computational transaction \tabularnewline
Raw Input & view raw input (R code)  \tabularnewline
Raw Output & view raw output of R engine  \tabularnewline
Computing time & 1 seconds \tabularnewline
R Server & 'Gwilym Jenkins' @ 72.249.127.135 \tabularnewline
\hline
\end{tabular}
%Source: https://freestatistics.org/blog/index.php?pk=33359&T=0

[TABLE]
[ROW][C]Summary of computational transaction[/C][/ROW]
[ROW][C]Raw Input[/C][C]view raw input (R code) [/C][/ROW]
[ROW][C]Raw Output[/C][C]view raw output of R engine [/C][/ROW]
[ROW][C]Computing time[/C][C]1 seconds[/C][/ROW]
[ROW][C]R Server[/C][C]'Gwilym Jenkins' @ 72.249.127.135[/C][/ROW]
[/TABLE]
Source: https://freestatistics.org/blog/index.php?pk=33359&T=0

Globally Unique Identifier (entire table): ba.freestatistics.org/blog/index.php?pk=33359&T=0

As an alternative you can also use a QR Code:  

The GUIDs for individual cells are displayed in the table below:

Summary of computational transaction
Raw Inputview raw input (R code)
Raw Outputview raw output of R engine
Computing time1 seconds
R Server'Gwilym Jenkins' @ 72.249.127.135


Univariate ARIMA Extrapolation Forecast
timeY[t]F[t]95% LB95% UBp-value(H0: Y[t] = F[t])P(F[t]>Y[t-1])P(F[t]>Y[t-s])P(F[t]>Y[60])
48119.4-------
49118.6-------
50118-------
51116-------
52114.8-------
53114.6-------
54114.6-------
55124-------
56125.2-------
57124-------
58117.6-------
59113.2-------
60111.4-------
61112.2110.6709108.3564112.98540.09770.268500.2685
62109.8110.1123106.8391113.38550.42580.105600.2203
63106.4108.2847104.2758112.29360.17840.22941e-040.0639
64105.2106.9151102.286111.54410.23390.58634e-040.0288
65102.2106.5283101.3528111.70370.05060.69250.00110.0325
6699.8106.6249100.9555112.29430.00920.9370.00290.0494
67111116.2106110.0869122.33420.047710.00630.9382
68113117.5329110.9864124.07940.08740.97480.01090.9668
69108.4116.5272109.5836123.47080.01090.84030.01750.9261
70105.4110.7813103.4621118.10050.07480.73820.03390.4342
71102106.561498.8849114.23780.12210.61660.0450.1083
72102.8105.157197.1394113.17490.28220.77990.06350.0635

\begin{tabular}{lllllllll}
\hline
Univariate ARIMA Extrapolation Forecast \tabularnewline
time & Y[t] & F[t] & 95% LB & 95% UB & p-value(H0: Y[t] = F[t]) & P(F[t]>Y[t-1]) & P(F[t]>Y[t-s]) & P(F[t]>Y[60]) \tabularnewline
48 & 119.4 & - & - & - & - & - & - & - \tabularnewline
49 & 118.6 & - & - & - & - & - & - & - \tabularnewline
50 & 118 & - & - & - & - & - & - & - \tabularnewline
51 & 116 & - & - & - & - & - & - & - \tabularnewline
52 & 114.8 & - & - & - & - & - & - & - \tabularnewline
53 & 114.6 & - & - & - & - & - & - & - \tabularnewline
54 & 114.6 & - & - & - & - & - & - & - \tabularnewline
55 & 124 & - & - & - & - & - & - & - \tabularnewline
56 & 125.2 & - & - & - & - & - & - & - \tabularnewline
57 & 124 & - & - & - & - & - & - & - \tabularnewline
58 & 117.6 & - & - & - & - & - & - & - \tabularnewline
59 & 113.2 & - & - & - & - & - & - & - \tabularnewline
60 & 111.4 & - & - & - & - & - & - & - \tabularnewline
61 & 112.2 & 110.6709 & 108.3564 & 112.9854 & 0.0977 & 0.2685 & 0 & 0.2685 \tabularnewline
62 & 109.8 & 110.1123 & 106.8391 & 113.3855 & 0.4258 & 0.1056 & 0 & 0.2203 \tabularnewline
63 & 106.4 & 108.2847 & 104.2758 & 112.2936 & 0.1784 & 0.2294 & 1e-04 & 0.0639 \tabularnewline
64 & 105.2 & 106.9151 & 102.286 & 111.5441 & 0.2339 & 0.5863 & 4e-04 & 0.0288 \tabularnewline
65 & 102.2 & 106.5283 & 101.3528 & 111.7037 & 0.0506 & 0.6925 & 0.0011 & 0.0325 \tabularnewline
66 & 99.8 & 106.6249 & 100.9555 & 112.2943 & 0.0092 & 0.937 & 0.0029 & 0.0494 \tabularnewline
67 & 111 & 116.2106 & 110.0869 & 122.3342 & 0.0477 & 1 & 0.0063 & 0.9382 \tabularnewline
68 & 113 & 117.5329 & 110.9864 & 124.0794 & 0.0874 & 0.9748 & 0.0109 & 0.9668 \tabularnewline
69 & 108.4 & 116.5272 & 109.5836 & 123.4708 & 0.0109 & 0.8403 & 0.0175 & 0.9261 \tabularnewline
70 & 105.4 & 110.7813 & 103.4621 & 118.1005 & 0.0748 & 0.7382 & 0.0339 & 0.4342 \tabularnewline
71 & 102 & 106.5614 & 98.8849 & 114.2378 & 0.1221 & 0.6166 & 0.045 & 0.1083 \tabularnewline
72 & 102.8 & 105.1571 & 97.1394 & 113.1749 & 0.2822 & 0.7799 & 0.0635 & 0.0635 \tabularnewline
\hline
\end{tabular}
%Source: https://freestatistics.org/blog/index.php?pk=33359&T=1

[TABLE]
[ROW][C]Univariate ARIMA Extrapolation Forecast[/C][/ROW]
[ROW][C]time[/C][C]Y[t][/C][C]F[t][/C][C]95% LB[/C][C]95% UB[/C][C]p-value(H0: Y[t] = F[t])[/C][C]P(F[t]>Y[t-1])[/C][C]P(F[t]>Y[t-s])[/C][C]P(F[t]>Y[60])[/C][/ROW]
[ROW][C]48[/C][C]119.4[/C][C]-[/C][C]-[/C][C]-[/C][C]-[/C][C]-[/C][C]-[/C][C]-[/C][/ROW]
[ROW][C]49[/C][C]118.6[/C][C]-[/C][C]-[/C][C]-[/C][C]-[/C][C]-[/C][C]-[/C][C]-[/C][/ROW]
[ROW][C]50[/C][C]118[/C][C]-[/C][C]-[/C][C]-[/C][C]-[/C][C]-[/C][C]-[/C][C]-[/C][/ROW]
[ROW][C]51[/C][C]116[/C][C]-[/C][C]-[/C][C]-[/C][C]-[/C][C]-[/C][C]-[/C][C]-[/C][/ROW]
[ROW][C]52[/C][C]114.8[/C][C]-[/C][C]-[/C][C]-[/C][C]-[/C][C]-[/C][C]-[/C][C]-[/C][/ROW]
[ROW][C]53[/C][C]114.6[/C][C]-[/C][C]-[/C][C]-[/C][C]-[/C][C]-[/C][C]-[/C][C]-[/C][/ROW]
[ROW][C]54[/C][C]114.6[/C][C]-[/C][C]-[/C][C]-[/C][C]-[/C][C]-[/C][C]-[/C][C]-[/C][/ROW]
[ROW][C]55[/C][C]124[/C][C]-[/C][C]-[/C][C]-[/C][C]-[/C][C]-[/C][C]-[/C][C]-[/C][/ROW]
[ROW][C]56[/C][C]125.2[/C][C]-[/C][C]-[/C][C]-[/C][C]-[/C][C]-[/C][C]-[/C][C]-[/C][/ROW]
[ROW][C]57[/C][C]124[/C][C]-[/C][C]-[/C][C]-[/C][C]-[/C][C]-[/C][C]-[/C][C]-[/C][/ROW]
[ROW][C]58[/C][C]117.6[/C][C]-[/C][C]-[/C][C]-[/C][C]-[/C][C]-[/C][C]-[/C][C]-[/C][/ROW]
[ROW][C]59[/C][C]113.2[/C][C]-[/C][C]-[/C][C]-[/C][C]-[/C][C]-[/C][C]-[/C][C]-[/C][/ROW]
[ROW][C]60[/C][C]111.4[/C][C]-[/C][C]-[/C][C]-[/C][C]-[/C][C]-[/C][C]-[/C][C]-[/C][/ROW]
[ROW][C]61[/C][C]112.2[/C][C]110.6709[/C][C]108.3564[/C][C]112.9854[/C][C]0.0977[/C][C]0.2685[/C][C]0[/C][C]0.2685[/C][/ROW]
[ROW][C]62[/C][C]109.8[/C][C]110.1123[/C][C]106.8391[/C][C]113.3855[/C][C]0.4258[/C][C]0.1056[/C][C]0[/C][C]0.2203[/C][/ROW]
[ROW][C]63[/C][C]106.4[/C][C]108.2847[/C][C]104.2758[/C][C]112.2936[/C][C]0.1784[/C][C]0.2294[/C][C]1e-04[/C][C]0.0639[/C][/ROW]
[ROW][C]64[/C][C]105.2[/C][C]106.9151[/C][C]102.286[/C][C]111.5441[/C][C]0.2339[/C][C]0.5863[/C][C]4e-04[/C][C]0.0288[/C][/ROW]
[ROW][C]65[/C][C]102.2[/C][C]106.5283[/C][C]101.3528[/C][C]111.7037[/C][C]0.0506[/C][C]0.6925[/C][C]0.0011[/C][C]0.0325[/C][/ROW]
[ROW][C]66[/C][C]99.8[/C][C]106.6249[/C][C]100.9555[/C][C]112.2943[/C][C]0.0092[/C][C]0.937[/C][C]0.0029[/C][C]0.0494[/C][/ROW]
[ROW][C]67[/C][C]111[/C][C]116.2106[/C][C]110.0869[/C][C]122.3342[/C][C]0.0477[/C][C]1[/C][C]0.0063[/C][C]0.9382[/C][/ROW]
[ROW][C]68[/C][C]113[/C][C]117.5329[/C][C]110.9864[/C][C]124.0794[/C][C]0.0874[/C][C]0.9748[/C][C]0.0109[/C][C]0.9668[/C][/ROW]
[ROW][C]69[/C][C]108.4[/C][C]116.5272[/C][C]109.5836[/C][C]123.4708[/C][C]0.0109[/C][C]0.8403[/C][C]0.0175[/C][C]0.9261[/C][/ROW]
[ROW][C]70[/C][C]105.4[/C][C]110.7813[/C][C]103.4621[/C][C]118.1005[/C][C]0.0748[/C][C]0.7382[/C][C]0.0339[/C][C]0.4342[/C][/ROW]
[ROW][C]71[/C][C]102[/C][C]106.5614[/C][C]98.8849[/C][C]114.2378[/C][C]0.1221[/C][C]0.6166[/C][C]0.045[/C][C]0.1083[/C][/ROW]
[ROW][C]72[/C][C]102.8[/C][C]105.1571[/C][C]97.1394[/C][C]113.1749[/C][C]0.2822[/C][C]0.7799[/C][C]0.0635[/C][C]0.0635[/C][/ROW]
[/TABLE]
Source: https://freestatistics.org/blog/index.php?pk=33359&T=1

Globally Unique Identifier (entire table): ba.freestatistics.org/blog/index.php?pk=33359&T=1

As an alternative you can also use a QR Code:  

The GUIDs for individual cells are displayed in the table below:

Univariate ARIMA Extrapolation Forecast
timeY[t]F[t]95% LB95% UBp-value(H0: Y[t] = F[t])P(F[t]>Y[t-1])P(F[t]>Y[t-s])P(F[t]>Y[60])
48119.4-------
49118.6-------
50118-------
51116-------
52114.8-------
53114.6-------
54114.6-------
55124-------
56125.2-------
57124-------
58117.6-------
59113.2-------
60111.4-------
61112.2110.6709108.3564112.98540.09770.268500.2685
62109.8110.1123106.8391113.38550.42580.105600.2203
63106.4108.2847104.2758112.29360.17840.22941e-040.0639
64105.2106.9151102.286111.54410.23390.58634e-040.0288
65102.2106.5283101.3528111.70370.05060.69250.00110.0325
6699.8106.6249100.9555112.29430.00920.9370.00290.0494
67111116.2106110.0869122.33420.047710.00630.9382
68113117.5329110.9864124.07940.08740.97480.01090.9668
69108.4116.5272109.5836123.47080.01090.84030.01750.9261
70105.4110.7813103.4621118.10050.07480.73820.03390.4342
71102106.561498.8849114.23780.12210.61660.0450.1083
72102.8105.157197.1394113.17490.28220.77990.06350.0635


Univariate ARIMA Extrapolation Forecast Performance
time% S.E.PEMAPESq.EMSERMSE
610.01070.01380.00122.33820.19480.4414
620.0152-0.00282e-040.09750.00810.0902
630.0189-0.01740.00153.55210.2960.5441
640.0221-0.0160.00132.94140.24510.4951
650.0248-0.04060.003418.73381.56121.2495
660.0271-0.0640.005346.57923.88161.9702
670.0269-0.04480.003727.152.26251.5042
680.0284-0.03860.003220.54731.71231.3085
690.0304-0.06970.005866.05195.50432.3461
700.0337-0.04860.00428.95872.41321.5535
710.0368-0.04280.003620.80611.73381.3168
720.0389-0.02240.00195.55610.4630.6804

\begin{tabular}{lllllllll}
\hline
Univariate ARIMA Extrapolation Forecast Performance \tabularnewline
time & % S.E. & PE & MAPE & Sq.E & MSE & RMSE \tabularnewline
61 & 0.0107 & 0.0138 & 0.0012 & 2.3382 & 0.1948 & 0.4414 \tabularnewline
62 & 0.0152 & -0.0028 & 2e-04 & 0.0975 & 0.0081 & 0.0902 \tabularnewline
63 & 0.0189 & -0.0174 & 0.0015 & 3.5521 & 0.296 & 0.5441 \tabularnewline
64 & 0.0221 & -0.016 & 0.0013 & 2.9414 & 0.2451 & 0.4951 \tabularnewline
65 & 0.0248 & -0.0406 & 0.0034 & 18.7338 & 1.5612 & 1.2495 \tabularnewline
66 & 0.0271 & -0.064 & 0.0053 & 46.5792 & 3.8816 & 1.9702 \tabularnewline
67 & 0.0269 & -0.0448 & 0.0037 & 27.15 & 2.2625 & 1.5042 \tabularnewline
68 & 0.0284 & -0.0386 & 0.0032 & 20.5473 & 1.7123 & 1.3085 \tabularnewline
69 & 0.0304 & -0.0697 & 0.0058 & 66.0519 & 5.5043 & 2.3461 \tabularnewline
70 & 0.0337 & -0.0486 & 0.004 & 28.9587 & 2.4132 & 1.5535 \tabularnewline
71 & 0.0368 & -0.0428 & 0.0036 & 20.8061 & 1.7338 & 1.3168 \tabularnewline
72 & 0.0389 & -0.0224 & 0.0019 & 5.5561 & 0.463 & 0.6804 \tabularnewline
\hline
\end{tabular}
%Source: https://freestatistics.org/blog/index.php?pk=33359&T=2

[TABLE]
[ROW][C]Univariate ARIMA Extrapolation Forecast Performance[/C][/ROW]
[ROW][C]time[/C][C]% S.E.[/C][C]PE[/C][C]MAPE[/C][C]Sq.E[/C][C]MSE[/C][C]RMSE[/C][/ROW]
[ROW][C]61[/C][C]0.0107[/C][C]0.0138[/C][C]0.0012[/C][C]2.3382[/C][C]0.1948[/C][C]0.4414[/C][/ROW]
[ROW][C]62[/C][C]0.0152[/C][C]-0.0028[/C][C]2e-04[/C][C]0.0975[/C][C]0.0081[/C][C]0.0902[/C][/ROW]
[ROW][C]63[/C][C]0.0189[/C][C]-0.0174[/C][C]0.0015[/C][C]3.5521[/C][C]0.296[/C][C]0.5441[/C][/ROW]
[ROW][C]64[/C][C]0.0221[/C][C]-0.016[/C][C]0.0013[/C][C]2.9414[/C][C]0.2451[/C][C]0.4951[/C][/ROW]
[ROW][C]65[/C][C]0.0248[/C][C]-0.0406[/C][C]0.0034[/C][C]18.7338[/C][C]1.5612[/C][C]1.2495[/C][/ROW]
[ROW][C]66[/C][C]0.0271[/C][C]-0.064[/C][C]0.0053[/C][C]46.5792[/C][C]3.8816[/C][C]1.9702[/C][/ROW]
[ROW][C]67[/C][C]0.0269[/C][C]-0.0448[/C][C]0.0037[/C][C]27.15[/C][C]2.2625[/C][C]1.5042[/C][/ROW]
[ROW][C]68[/C][C]0.0284[/C][C]-0.0386[/C][C]0.0032[/C][C]20.5473[/C][C]1.7123[/C][C]1.3085[/C][/ROW]
[ROW][C]69[/C][C]0.0304[/C][C]-0.0697[/C][C]0.0058[/C][C]66.0519[/C][C]5.5043[/C][C]2.3461[/C][/ROW]
[ROW][C]70[/C][C]0.0337[/C][C]-0.0486[/C][C]0.004[/C][C]28.9587[/C][C]2.4132[/C][C]1.5535[/C][/ROW]
[ROW][C]71[/C][C]0.0368[/C][C]-0.0428[/C][C]0.0036[/C][C]20.8061[/C][C]1.7338[/C][C]1.3168[/C][/ROW]
[ROW][C]72[/C][C]0.0389[/C][C]-0.0224[/C][C]0.0019[/C][C]5.5561[/C][C]0.463[/C][C]0.6804[/C][/ROW]
[/TABLE]
Source: https://freestatistics.org/blog/index.php?pk=33359&T=2

Globally Unique Identifier (entire table): ba.freestatistics.org/blog/index.php?pk=33359&T=2

As an alternative you can also use a QR Code:  

The GUIDs for individual cells are displayed in the table below:

Univariate ARIMA Extrapolation Forecast Performance
time% S.E.PEMAPESq.EMSERMSE
610.01070.01380.00122.33820.19480.4414
620.0152-0.00282e-040.09750.00810.0902
630.0189-0.01740.00153.55210.2960.5441
640.0221-0.0160.00132.94140.24510.4951
650.0248-0.04060.003418.73381.56121.2495
660.0271-0.0640.005346.57923.88161.9702
670.0269-0.04480.003727.152.26251.5042
680.0284-0.03860.003220.54731.71231.3085
690.0304-0.06970.005866.05195.50432.3461
700.0337-0.04860.00428.95872.41321.5535
710.0368-0.04280.003620.80611.73381.3168
720.0389-0.02240.00195.55610.4630.6804


Parameters (Session):
par1 = 12 ; par2 = 1 ; par3 = 1 ; par4 = 1 ; par5 = 12 ; par6 = 0 ; par7 = 0 ; par8 = 0 ; par9 = 1 ; par10 = FALSE ;
Parameters (R input):
par1 = 12 ; par2 = 1 ; par3 = 1 ; par4 = 1 ; par5 = 12 ; par6 = 0 ; par7 = 0 ; par8 = 0 ; par9 = 1 ; par10 = FALSE ;
R code (references can be found in the software module):
par1 <- as.numeric(par1) #cut off periods
par2 <- as.numeric(par2) #lambda
par3 <- as.numeric(par3) #degree of non-seasonal differencing
par4 <- as.numeric(par4) #degree of seasonal differencing
par5 <- as.numeric(par5) #seasonal period
par6 <- as.numeric(par6) #p
par7 <- as.numeric(par7) #q
par8 <- as.numeric(par8) #P
par9 <- as.numeric(par9) #Q
if (par10 == 'TRUE') par10 <- TRUE
if (par10 == 'FALSE') par10 <- FALSE
if (par2 == 0) x <- log(x)
if (par2 != 0) x <- x^par2
lx <- length(x)
first <- lx - 2*par1
nx <- lx - par1
nx1 <- nx + 1
fx <- lx - nx
if (fx < 1) {
fx <- par5
nx1 <- lx + fx - 1
first <- lx - 2*fx
}
first <- 1
if (fx < 3) fx <- round(lx/10,0)
(arima.out <- arima(x[1:nx], order=c(par6,par3,par7), seasonal=list(order=c(par8,par4,par9), period=par5), include.mean=par10, method='ML'))
(forecast <- predict(arima.out,fx))
(lb <- forecast$pred - 1.96 * forecast$se)
(ub <- forecast$pred + 1.96 * forecast$se)
if (par2 == 0) {
x <- exp(x)
forecast$pred <- exp(forecast$pred)
lb <- exp(lb)
ub <- exp(ub)
}
if (par2 != 0) {
x <- x^(1/par2)
forecast$pred <- forecast$pred^(1/par2)
lb <- lb^(1/par2)
ub <- ub^(1/par2)
}
if (par2 < 0) {
olb <- lb
lb <- ub
ub <- olb
}
(actandfor <- c(x[1:nx], forecast$pred))
(perc.se <- (ub-forecast$pred)/1.96/forecast$pred)
bitmap(file='test1.png')
opar <- par(mar=c(4,4,2,2),las=1)
ylim <- c( min(x[first:nx],lb), max(x[first:nx],ub))
plot(x,ylim=ylim,type='n',xlim=c(first,lx))
usr <- par('usr')
rect(usr[1],usr[3],nx+1,usr[4],border=NA,col='lemonchiffon')
rect(nx1,usr[3],usr[2],usr[4],border=NA,col='lavender')
abline(h= (-3:3)*2 , col ='gray', lty =3)
polygon( c(nx1:lx,lx:nx1), c(lb,rev(ub)), col = 'orange', lty=2,border=NA)
lines(nx1:lx, lb , lty=2)
lines(nx1:lx, ub , lty=2)
lines(x, lwd=2)
lines(nx1:lx, forecast$pred , lwd=2 , col ='white')
box()
par(opar)
dev.off()
prob.dec <- array(NA, dim=fx)
prob.sdec <- array(NA, dim=fx)
prob.ldec <- array(NA, dim=fx)
prob.pval <- array(NA, dim=fx)
perf.pe <- array(0, dim=fx)
perf.mape <- array(0, dim=fx)
perf.se <- array(0, dim=fx)
perf.mse <- array(0, dim=fx)
perf.rmse <- array(0, dim=fx)
for (i in 1:fx) {
locSD <- (ub[i] - forecast$pred[i]) / 1.96
perf.pe[i] = (x[nx+i] - forecast$pred[i]) / forecast$pred[i]
perf.mape[i] = perf.mape[i] + abs(perf.pe[i])
perf.se[i] = (x[nx+i] - forecast$pred[i])^2
perf.mse[i] = perf.mse[i] + perf.se[i]
prob.dec[i] = pnorm((x[nx+i-1] - forecast$pred[i]) / locSD)
prob.sdec[i] = pnorm((x[nx+i-par5] - forecast$pred[i]) / locSD)
prob.ldec[i] = pnorm((x[nx] - forecast$pred[i]) / locSD)
prob.pval[i] = pnorm(abs(x[nx+i] - forecast$pred[i]) / locSD)
}
perf.mape = perf.mape / fx
perf.mse = perf.mse / fx
perf.rmse = sqrt(perf.mse)
bitmap(file='test2.png')
plot(forecast$pred, pch=19, type='b',main='ARIMA Extrapolation Forecast', ylab='Forecast and 95% CI', xlab='time',ylim=c(min(lb),max(ub)))
dum <- forecast$pred
dum[1:12] <- x[(nx+1):lx]
lines(dum, lty=1)
lines(ub,lty=3)
lines(lb,lty=3)
dev.off()
load(file='createtable')
a<-table.start()
a<-table.row.start(a)
a<-table.element(a,'Univariate ARIMA Extrapolation Forecast',9,TRUE)
a<-table.row.end(a)
a<-table.row.start(a)
a<-table.element(a,'time',1,header=TRUE)
a<-table.element(a,'Y[t]',1,header=TRUE)
a<-table.element(a,'F[t]',1,header=TRUE)
a<-table.element(a,'95% LB',1,header=TRUE)
a<-table.element(a,'95% UB',1,header=TRUE)
a<-table.element(a,'p-value
(H0: Y[t] = F[t])',1,header=TRUE)
a<-table.element(a,'P(F[t]>Y[t-1])',1,header=TRUE)
a<-table.element(a,'P(F[t]>Y[t-s])',1,header=TRUE)
mylab <- paste('P(F[t]>Y[',nx,sep='')
mylab <- paste(mylab,'])',sep='')
a<-table.element(a,mylab,1,header=TRUE)
a<-table.row.end(a)
for (i in (nx-par5):nx) {
a<-table.row.start(a)
a<-table.element(a,i,header=TRUE)
a<-table.element(a,x[i])
a<-table.element(a,'-')
a<-table.row.end(a)
}
for (i in 1:fx) {
a<-table.row.start(a)
a<-table.element(a,nx+i,header=TRUE)
a<-table.element(a,round(x[nx+i],4))
a<-table.element(a,round(forecast$pred[i],4))
a<-table.element(a,round(lb[i],4))
a<-table.element(a,round(ub[i],4))
a<-table.element(a,round((1-prob.pval[i]),4))
a<-table.element(a,round((1-prob.dec[i]),4))
a<-table.element(a,round((1-prob.sdec[i]),4))
a<-table.element(a,round((1-prob.ldec[i]),4))
a<-table.row.end(a)
}
a<-table.end(a)
table.save(a,file='mytable.tab')
a<-table.start()
a<-table.row.start(a)
a<-table.element(a,'Univariate ARIMA Extrapolation Forecast Performance',7,TRUE)
a<-table.row.end(a)
a<-table.row.start(a)
a<-table.element(a,'time',1,header=TRUE)
a<-table.element(a,'% S.E.',1,header=TRUE)
a<-table.element(a,'PE',1,header=TRUE)
a<-table.element(a,'MAPE',1,header=TRUE)
a<-table.element(a,'Sq.E',1,header=TRUE)
a<-table.element(a,'MSE',1,header=TRUE)
a<-table.element(a,'RMSE',1,header=TRUE)
a<-table.row.end(a)
for (i in 1:fx) {
a<-table.row.start(a)
a<-table.element(a,nx+i,header=TRUE)
a<-table.element(a,round(perc.se[i],4))
a<-table.element(a,round(perf.pe[i],4))
a<-table.element(a,round(perf.mape[i],4))
a<-table.element(a,round(perf.se[i],4))
a<-table.element(a,round(perf.mse[i],4))
a<-table.element(a,round(perf.rmse[i],4))
a<-table.row.end(a)
}
a<-table.end(a)
table.save(a,file='mytable1.tab')