Free Statistics

of Irreproducible Research!

Author's title

Author*The author of this computation has been verified*
R Software Modulerwasp_autocorrelation.wasp
Title produced by software(Partial) Autocorrelation Function
Date of computationSun, 14 Dec 2008 06:22:30 -0700
Cite this page as followsStatistical Computations at FreeStatistics.org, Office for Research Development and Education, URL https://freestatistics.org/blog/index.php?v=date/2008/Dec/14/t1229261002724javyl530y25o.htm/, Retrieved Wed, 15 May 2024 02:09:19 +0000
Statistical Computations at FreeStatistics.org, Office for Research Development and Education, URL https://freestatistics.org/blog/index.php?pk=33353, Retrieved Wed, 15 May 2024 02:09:19 +0000
QR Codes:

Original text written by user:
IsPrivate?No (this computation is public)
User-defined keywords
Estimated Impact224
Family? (F = Feedback message, R = changed R code, M = changed R Module, P = changed Parameters, D = changed Data)
-     [Maximum-likelihood Fitting - Normal Distribution] [Maximum-likelihoo...] [2008-12-10 19:35:16] [82d201ca7b4e7cd2c6f885d29b5b6937]
- RMP   [(Partial) Autocorrelation Function] [P(ACF)] [2008-12-10 20:35:05] [82d201ca7b4e7cd2c6f885d29b5b6937]
-   P     [(Partial) Autocorrelation Function] [ACF] [2008-12-13 15:48:44] [82d201ca7b4e7cd2c6f885d29b5b6937]
-   P       [(Partial) Autocorrelation Function] [ACF] [2008-12-13 16:05:24] [82d201ca7b4e7cd2c6f885d29b5b6937]
-   PD          [(Partial) Autocorrelation Function] [ACF lambda 1: invoer] [2008-12-14 13:22:30] [00a0a665d7a07edd2e460056b0c0c354] [Current]
Feedback Forum

Post a new message
Dataseries X:
11857.9
14616
15643.4
14077.2
14887.5
14159.9
14643
17192.5
15386.1
14287.1
17526.6
14497
14398.3
16629.6
16670.7
16614.8
16869.2
15663.9
16359.9
18447.7
16889
16505
18320.9
15052.1
15699.8
18135.3
16768.7
18883
19021
18101.9
17776.1
21489.9
17065.3
18690
18953.1
16398.9
16895.7
18553
19270
19422.1
17579.4
18637.3
18076.7
20438.6
18075.2
19563
19899.2
19227.5
17789.6
19220.8
21968.9
21131.5
19484.6
22404.1
21099
22486.5
23707.5
21897.5
23326.4
23765.4
20444


Summary of computational transaction
Raw Inputview raw input (R code)
Raw Outputview raw output of R engine
Computing time4 seconds
R Server'Herman Ole Andreas Wold' @ 193.190.124.10:1001

\begin{tabular}{lllllllll}
\hline
Summary of computational transaction \tabularnewline
Raw Input & view raw input (R code)  \tabularnewline
Raw Output & view raw output of R engine  \tabularnewline
Computing time & 4 seconds \tabularnewline
R Server & 'Herman Ole Andreas Wold' @ 193.190.124.10:1001 \tabularnewline
\hline
\end{tabular}
%Source: https://freestatistics.org/blog/index.php?pk=33353&T=0

[TABLE]
[ROW][C]Summary of computational transaction[/C][/ROW]
[ROW][C]Raw Input[/C][C]view raw input (R code) [/C][/ROW]
[ROW][C]Raw Output[/C][C]view raw output of R engine [/C][/ROW]
[ROW][C]Computing time[/C][C]4 seconds[/C][/ROW]
[ROW][C]R Server[/C][C]'Herman Ole Andreas Wold' @ 193.190.124.10:1001[/C][/ROW]
[/TABLE]
Source: https://freestatistics.org/blog/index.php?pk=33353&T=0

Globally Unique Identifier (entire table): ba.freestatistics.org/blog/index.php?pk=33353&T=0

As an alternative you can also use a QR Code:  

The GUIDs for individual cells are displayed in the table below:

Summary of computational transaction
Raw Inputview raw input (R code)
Raw Outputview raw output of R engine
Computing time4 seconds
R Server'Herman Ole Andreas Wold' @ 193.190.124.10:1001


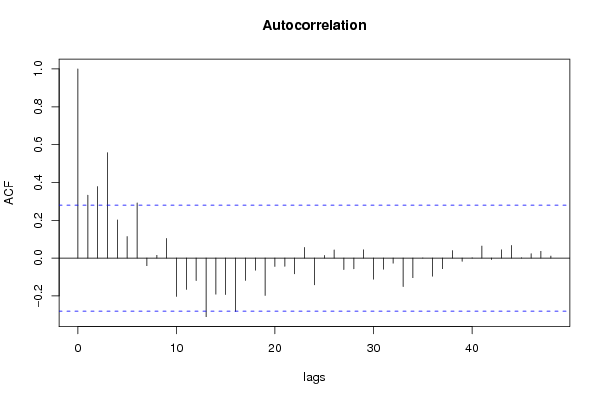
Autocorrelation Function
Time lag kACF(k)T-STATP-value
10.3326162.32830.012033
20.3779192.64540.005467
30.5573593.90150.000146
40.2018781.41310.081967
50.1140910.79860.214177
60.2914912.04040.023357
7-0.04034-0.28240.389421
80.0147150.1030.459191
90.1036330.72540.23582
10-0.202738-1.41920.08109
11-0.165433-1.1580.126232
12-0.118822-0.83180.204792
13-0.309616-2.16730.01755
14-0.191101-1.33770.093584
15-0.192647-1.34850.091844
16-0.281873-1.97310.027069
17-0.117976-0.82580.206451
18-0.064003-0.4480.328056
19-0.197651-1.38360.086382
20-0.044362-0.31050.378736
21-0.043674-0.30570.380558
22-0.083023-0.58120.281899
230.0561520.39310.347989
24-0.141197-0.98840.163911
250.0141570.09910.460731
260.0431430.3020.381964
27-0.060353-0.42250.337265
28-0.056564-0.3960.34693
290.0435570.30490.380868
30-0.111603-0.78120.219216
31-0.058846-0.41190.341097
32-0.027158-0.19010.425005
33-0.150502-1.05350.148636
34-0.103341-0.72340.236441
350.0005660.0040.498429
36-0.095424-0.6680.253644
37-0.055843-0.39090.348782
380.0401280.28090.389985
39-0.017108-0.11980.452584
400.0016980.01190.495283
410.0639230.44750.328258
42-0.008109-0.05680.477484
430.0437260.30610.380418
440.0669620.46870.320669
450.0017940.01260.495017
460.0234220.1640.435221
470.0356360.24950.402027
480.0107450.07520.470176

\begin{tabular}{lllllllll}
\hline
Autocorrelation Function \tabularnewline
Time lag k & ACF(k) & T-STAT & P-value \tabularnewline
1 & 0.332616 & 2.3283 & 0.012033 \tabularnewline
2 & 0.377919 & 2.6454 & 0.005467 \tabularnewline
3 & 0.557359 & 3.9015 & 0.000146 \tabularnewline
4 & 0.201878 & 1.4131 & 0.081967 \tabularnewline
5 & 0.114091 & 0.7986 & 0.214177 \tabularnewline
6 & 0.291491 & 2.0404 & 0.023357 \tabularnewline
7 & -0.04034 & -0.2824 & 0.389421 \tabularnewline
8 & 0.014715 & 0.103 & 0.459191 \tabularnewline
9 & 0.103633 & 0.7254 & 0.23582 \tabularnewline
10 & -0.202738 & -1.4192 & 0.08109 \tabularnewline
11 & -0.165433 & -1.158 & 0.126232 \tabularnewline
12 & -0.118822 & -0.8318 & 0.204792 \tabularnewline
13 & -0.309616 & -2.1673 & 0.01755 \tabularnewline
14 & -0.191101 & -1.3377 & 0.093584 \tabularnewline
15 & -0.192647 & -1.3485 & 0.091844 \tabularnewline
16 & -0.281873 & -1.9731 & 0.027069 \tabularnewline
17 & -0.117976 & -0.8258 & 0.206451 \tabularnewline
18 & -0.064003 & -0.448 & 0.328056 \tabularnewline
19 & -0.197651 & -1.3836 & 0.086382 \tabularnewline
20 & -0.044362 & -0.3105 & 0.378736 \tabularnewline
21 & -0.043674 & -0.3057 & 0.380558 \tabularnewline
22 & -0.083023 & -0.5812 & 0.281899 \tabularnewline
23 & 0.056152 & 0.3931 & 0.347989 \tabularnewline
24 & -0.141197 & -0.9884 & 0.163911 \tabularnewline
25 & 0.014157 & 0.0991 & 0.460731 \tabularnewline
26 & 0.043143 & 0.302 & 0.381964 \tabularnewline
27 & -0.060353 & -0.4225 & 0.337265 \tabularnewline
28 & -0.056564 & -0.396 & 0.34693 \tabularnewline
29 & 0.043557 & 0.3049 & 0.380868 \tabularnewline
30 & -0.111603 & -0.7812 & 0.219216 \tabularnewline
31 & -0.058846 & -0.4119 & 0.341097 \tabularnewline
32 & -0.027158 & -0.1901 & 0.425005 \tabularnewline
33 & -0.150502 & -1.0535 & 0.148636 \tabularnewline
34 & -0.103341 & -0.7234 & 0.236441 \tabularnewline
35 & 0.000566 & 0.004 & 0.498429 \tabularnewline
36 & -0.095424 & -0.668 & 0.253644 \tabularnewline
37 & -0.055843 & -0.3909 & 0.348782 \tabularnewline
38 & 0.040128 & 0.2809 & 0.389985 \tabularnewline
39 & -0.017108 & -0.1198 & 0.452584 \tabularnewline
40 & 0.001698 & 0.0119 & 0.495283 \tabularnewline
41 & 0.063923 & 0.4475 & 0.328258 \tabularnewline
42 & -0.008109 & -0.0568 & 0.477484 \tabularnewline
43 & 0.043726 & 0.3061 & 0.380418 \tabularnewline
44 & 0.066962 & 0.4687 & 0.320669 \tabularnewline
45 & 0.001794 & 0.0126 & 0.495017 \tabularnewline
46 & 0.023422 & 0.164 & 0.435221 \tabularnewline
47 & 0.035636 & 0.2495 & 0.402027 \tabularnewline
48 & 0.010745 & 0.0752 & 0.470176 \tabularnewline
\hline
\end{tabular}
%Source: https://freestatistics.org/blog/index.php?pk=33353&T=1

[TABLE]
[ROW][C]Autocorrelation Function[/C][/ROW]
[ROW][C]Time lag k[/C][C]ACF(k)[/C][C]T-STAT[/C][C]P-value[/C][/ROW]
[ROW][C]1[/C][C]0.332616[/C][C]2.3283[/C][C]0.012033[/C][/ROW]
[ROW][C]2[/C][C]0.377919[/C][C]2.6454[/C][C]0.005467[/C][/ROW]
[ROW][C]3[/C][C]0.557359[/C][C]3.9015[/C][C]0.000146[/C][/ROW]
[ROW][C]4[/C][C]0.201878[/C][C]1.4131[/C][C]0.081967[/C][/ROW]
[ROW][C]5[/C][C]0.114091[/C][C]0.7986[/C][C]0.214177[/C][/ROW]
[ROW][C]6[/C][C]0.291491[/C][C]2.0404[/C][C]0.023357[/C][/ROW]
[ROW][C]7[/C][C]-0.04034[/C][C]-0.2824[/C][C]0.389421[/C][/ROW]
[ROW][C]8[/C][C]0.014715[/C][C]0.103[/C][C]0.459191[/C][/ROW]
[ROW][C]9[/C][C]0.103633[/C][C]0.7254[/C][C]0.23582[/C][/ROW]
[ROW][C]10[/C][C]-0.202738[/C][C]-1.4192[/C][C]0.08109[/C][/ROW]
[ROW][C]11[/C][C]-0.165433[/C][C]-1.158[/C][C]0.126232[/C][/ROW]
[ROW][C]12[/C][C]-0.118822[/C][C]-0.8318[/C][C]0.204792[/C][/ROW]
[ROW][C]13[/C][C]-0.309616[/C][C]-2.1673[/C][C]0.01755[/C][/ROW]
[ROW][C]14[/C][C]-0.191101[/C][C]-1.3377[/C][C]0.093584[/C][/ROW]
[ROW][C]15[/C][C]-0.192647[/C][C]-1.3485[/C][C]0.091844[/C][/ROW]
[ROW][C]16[/C][C]-0.281873[/C][C]-1.9731[/C][C]0.027069[/C][/ROW]
[ROW][C]17[/C][C]-0.117976[/C][C]-0.8258[/C][C]0.206451[/C][/ROW]
[ROW][C]18[/C][C]-0.064003[/C][C]-0.448[/C][C]0.328056[/C][/ROW]
[ROW][C]19[/C][C]-0.197651[/C][C]-1.3836[/C][C]0.086382[/C][/ROW]
[ROW][C]20[/C][C]-0.044362[/C][C]-0.3105[/C][C]0.378736[/C][/ROW]
[ROW][C]21[/C][C]-0.043674[/C][C]-0.3057[/C][C]0.380558[/C][/ROW]
[ROW][C]22[/C][C]-0.083023[/C][C]-0.5812[/C][C]0.281899[/C][/ROW]
[ROW][C]23[/C][C]0.056152[/C][C]0.3931[/C][C]0.347989[/C][/ROW]
[ROW][C]24[/C][C]-0.141197[/C][C]-0.9884[/C][C]0.163911[/C][/ROW]
[ROW][C]25[/C][C]0.014157[/C][C]0.0991[/C][C]0.460731[/C][/ROW]
[ROW][C]26[/C][C]0.043143[/C][C]0.302[/C][C]0.381964[/C][/ROW]
[ROW][C]27[/C][C]-0.060353[/C][C]-0.4225[/C][C]0.337265[/C][/ROW]
[ROW][C]28[/C][C]-0.056564[/C][C]-0.396[/C][C]0.34693[/C][/ROW]
[ROW][C]29[/C][C]0.043557[/C][C]0.3049[/C][C]0.380868[/C][/ROW]
[ROW][C]30[/C][C]-0.111603[/C][C]-0.7812[/C][C]0.219216[/C][/ROW]
[ROW][C]31[/C][C]-0.058846[/C][C]-0.4119[/C][C]0.341097[/C][/ROW]
[ROW][C]32[/C][C]-0.027158[/C][C]-0.1901[/C][C]0.425005[/C][/ROW]
[ROW][C]33[/C][C]-0.150502[/C][C]-1.0535[/C][C]0.148636[/C][/ROW]
[ROW][C]34[/C][C]-0.103341[/C][C]-0.7234[/C][C]0.236441[/C][/ROW]
[ROW][C]35[/C][C]0.000566[/C][C]0.004[/C][C]0.498429[/C][/ROW]
[ROW][C]36[/C][C]-0.095424[/C][C]-0.668[/C][C]0.253644[/C][/ROW]
[ROW][C]37[/C][C]-0.055843[/C][C]-0.3909[/C][C]0.348782[/C][/ROW]
[ROW][C]38[/C][C]0.040128[/C][C]0.2809[/C][C]0.389985[/C][/ROW]
[ROW][C]39[/C][C]-0.017108[/C][C]-0.1198[/C][C]0.452584[/C][/ROW]
[ROW][C]40[/C][C]0.001698[/C][C]0.0119[/C][C]0.495283[/C][/ROW]
[ROW][C]41[/C][C]0.063923[/C][C]0.4475[/C][C]0.328258[/C][/ROW]
[ROW][C]42[/C][C]-0.008109[/C][C]-0.0568[/C][C]0.477484[/C][/ROW]
[ROW][C]43[/C][C]0.043726[/C][C]0.3061[/C][C]0.380418[/C][/ROW]
[ROW][C]44[/C][C]0.066962[/C][C]0.4687[/C][C]0.320669[/C][/ROW]
[ROW][C]45[/C][C]0.001794[/C][C]0.0126[/C][C]0.495017[/C][/ROW]
[ROW][C]46[/C][C]0.023422[/C][C]0.164[/C][C]0.435221[/C][/ROW]
[ROW][C]47[/C][C]0.035636[/C][C]0.2495[/C][C]0.402027[/C][/ROW]
[ROW][C]48[/C][C]0.010745[/C][C]0.0752[/C][C]0.470176[/C][/ROW]
[/TABLE]
Source: https://freestatistics.org/blog/index.php?pk=33353&T=1

Globally Unique Identifier (entire table): ba.freestatistics.org/blog/index.php?pk=33353&T=1

As an alternative you can also use a QR Code:  

The GUIDs for individual cells are displayed in the table below:

Autocorrelation Function
Time lag kACF(k)T-STATP-value
10.3326162.32830.012033
20.3779192.64540.005467
30.5573593.90150.000146
40.2018781.41310.081967
50.1140910.79860.214177
60.2914912.04040.023357
7-0.04034-0.28240.389421
80.0147150.1030.459191
90.1036330.72540.23582
10-0.202738-1.41920.08109
11-0.165433-1.1580.126232
12-0.118822-0.83180.204792
13-0.309616-2.16730.01755
14-0.191101-1.33770.093584
15-0.192647-1.34850.091844
16-0.281873-1.97310.027069
17-0.117976-0.82580.206451
18-0.064003-0.4480.328056
19-0.197651-1.38360.086382
20-0.044362-0.31050.378736
21-0.043674-0.30570.380558
22-0.083023-0.58120.281899
230.0561520.39310.347989
24-0.141197-0.98840.163911
250.0141570.09910.460731
260.0431430.3020.381964
27-0.060353-0.42250.337265
28-0.056564-0.3960.34693
290.0435570.30490.380868
30-0.111603-0.78120.219216
31-0.058846-0.41190.341097
32-0.027158-0.19010.425005
33-0.150502-1.05350.148636
34-0.103341-0.72340.236441
350.0005660.0040.498429
36-0.095424-0.6680.253644
37-0.055843-0.39090.348782
380.0401280.28090.389985
39-0.017108-0.11980.452584
400.0016980.01190.495283
410.0639230.44750.328258
42-0.008109-0.05680.477484
430.0437260.30610.380418
440.0669620.46870.320669
450.0017940.01260.495017
460.0234220.1640.435221
470.0356360.24950.402027
480.0107450.07520.470176


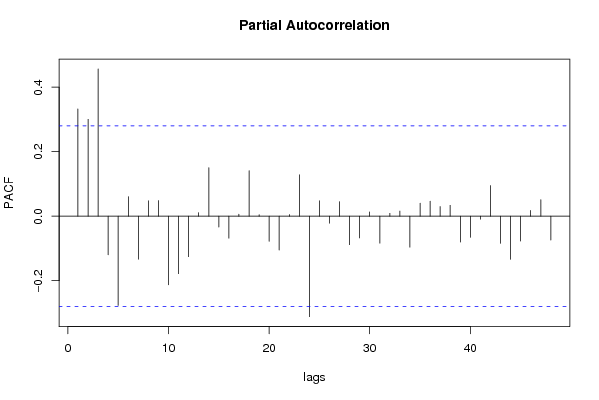
Partial Autocorrelation Function
Time lag kPACF(k)T-STATP-value
10.3326162.32830.012033
20.3005342.10370.020279
30.456683.19680.001217
4-0.119662-0.83760.203151
5-0.276559-1.93590.029329
60.0603840.42270.337187
7-0.133084-0.93160.178059
80.0476370.33350.370105
90.0485890.34010.367608
10-0.212628-1.48840.071527
11-0.178378-1.24860.108863
12-0.125403-0.87780.192163
130.011070.07750.469274
140.1503851.05270.148822
15-0.033481-0.23440.407839
16-0.068005-0.4760.318082
170.0061620.04310.482885
180.1413070.98920.163724
190.0049010.03430.486386
20-0.077846-0.54490.294139
21-0.105025-0.73520.232868
220.0050880.03560.485866
230.1284510.89920.186484
24-0.311473-2.18030.017033
250.0476550.33360.370058
26-0.021517-0.15060.440447
270.0449030.31430.377307
28-0.088265-0.61790.269767
29-0.067405-0.47180.319569
300.0134370.09410.462723
31-0.083758-0.58630.28018
320.0088030.06160.475556
330.0161670.11320.455181
34-0.096216-0.67350.251893
350.0405010.28350.388993
360.0465770.3260.372891
370.0299620.20970.417374
380.0339430.23760.406592
39-0.080244-0.56170.288439
40-0.065545-0.45880.324197
41-0.009395-0.06580.473917
420.094910.66440.254783
43-0.083979-0.58790.279665
44-0.133572-0.9350.177186
45-0.076985-0.53890.296199
460.0179920.12590.450145
470.0511960.35840.360802
48-0.073855-0.5170.303746

\begin{tabular}{lllllllll}
\hline
Partial Autocorrelation Function \tabularnewline
Time lag k & PACF(k) & T-STAT & P-value \tabularnewline
1 & 0.332616 & 2.3283 & 0.012033 \tabularnewline
2 & 0.300534 & 2.1037 & 0.020279 \tabularnewline
3 & 0.45668 & 3.1968 & 0.001217 \tabularnewline
4 & -0.119662 & -0.8376 & 0.203151 \tabularnewline
5 & -0.276559 & -1.9359 & 0.029329 \tabularnewline
6 & 0.060384 & 0.4227 & 0.337187 \tabularnewline
7 & -0.133084 & -0.9316 & 0.178059 \tabularnewline
8 & 0.047637 & 0.3335 & 0.370105 \tabularnewline
9 & 0.048589 & 0.3401 & 0.367608 \tabularnewline
10 & -0.212628 & -1.4884 & 0.071527 \tabularnewline
11 & -0.178378 & -1.2486 & 0.108863 \tabularnewline
12 & -0.125403 & -0.8778 & 0.192163 \tabularnewline
13 & 0.01107 & 0.0775 & 0.469274 \tabularnewline
14 & 0.150385 & 1.0527 & 0.148822 \tabularnewline
15 & -0.033481 & -0.2344 & 0.407839 \tabularnewline
16 & -0.068005 & -0.476 & 0.318082 \tabularnewline
17 & 0.006162 & 0.0431 & 0.482885 \tabularnewline
18 & 0.141307 & 0.9892 & 0.163724 \tabularnewline
19 & 0.004901 & 0.0343 & 0.486386 \tabularnewline
20 & -0.077846 & -0.5449 & 0.294139 \tabularnewline
21 & -0.105025 & -0.7352 & 0.232868 \tabularnewline
22 & 0.005088 & 0.0356 & 0.485866 \tabularnewline
23 & 0.128451 & 0.8992 & 0.186484 \tabularnewline
24 & -0.311473 & -2.1803 & 0.017033 \tabularnewline
25 & 0.047655 & 0.3336 & 0.370058 \tabularnewline
26 & -0.021517 & -0.1506 & 0.440447 \tabularnewline
27 & 0.044903 & 0.3143 & 0.377307 \tabularnewline
28 & -0.088265 & -0.6179 & 0.269767 \tabularnewline
29 & -0.067405 & -0.4718 & 0.319569 \tabularnewline
30 & 0.013437 & 0.0941 & 0.462723 \tabularnewline
31 & -0.083758 & -0.5863 & 0.28018 \tabularnewline
32 & 0.008803 & 0.0616 & 0.475556 \tabularnewline
33 & 0.016167 & 0.1132 & 0.455181 \tabularnewline
34 & -0.096216 & -0.6735 & 0.251893 \tabularnewline
35 & 0.040501 & 0.2835 & 0.388993 \tabularnewline
36 & 0.046577 & 0.326 & 0.372891 \tabularnewline
37 & 0.029962 & 0.2097 & 0.417374 \tabularnewline
38 & 0.033943 & 0.2376 & 0.406592 \tabularnewline
39 & -0.080244 & -0.5617 & 0.288439 \tabularnewline
40 & -0.065545 & -0.4588 & 0.324197 \tabularnewline
41 & -0.009395 & -0.0658 & 0.473917 \tabularnewline
42 & 0.09491 & 0.6644 & 0.254783 \tabularnewline
43 & -0.083979 & -0.5879 & 0.279665 \tabularnewline
44 & -0.133572 & -0.935 & 0.177186 \tabularnewline
45 & -0.076985 & -0.5389 & 0.296199 \tabularnewline
46 & 0.017992 & 0.1259 & 0.450145 \tabularnewline
47 & 0.051196 & 0.3584 & 0.360802 \tabularnewline
48 & -0.073855 & -0.517 & 0.303746 \tabularnewline
\hline
\end{tabular}
%Source: https://freestatistics.org/blog/index.php?pk=33353&T=2

[TABLE]
[ROW][C]Partial Autocorrelation Function[/C][/ROW]
[ROW][C]Time lag k[/C][C]PACF(k)[/C][C]T-STAT[/C][C]P-value[/C][/ROW]
[ROW][C]1[/C][C]0.332616[/C][C]2.3283[/C][C]0.012033[/C][/ROW]
[ROW][C]2[/C][C]0.300534[/C][C]2.1037[/C][C]0.020279[/C][/ROW]
[ROW][C]3[/C][C]0.45668[/C][C]3.1968[/C][C]0.001217[/C][/ROW]
[ROW][C]4[/C][C]-0.119662[/C][C]-0.8376[/C][C]0.203151[/C][/ROW]
[ROW][C]5[/C][C]-0.276559[/C][C]-1.9359[/C][C]0.029329[/C][/ROW]
[ROW][C]6[/C][C]0.060384[/C][C]0.4227[/C][C]0.337187[/C][/ROW]
[ROW][C]7[/C][C]-0.133084[/C][C]-0.9316[/C][C]0.178059[/C][/ROW]
[ROW][C]8[/C][C]0.047637[/C][C]0.3335[/C][C]0.370105[/C][/ROW]
[ROW][C]9[/C][C]0.048589[/C][C]0.3401[/C][C]0.367608[/C][/ROW]
[ROW][C]10[/C][C]-0.212628[/C][C]-1.4884[/C][C]0.071527[/C][/ROW]
[ROW][C]11[/C][C]-0.178378[/C][C]-1.2486[/C][C]0.108863[/C][/ROW]
[ROW][C]12[/C][C]-0.125403[/C][C]-0.8778[/C][C]0.192163[/C][/ROW]
[ROW][C]13[/C][C]0.01107[/C][C]0.0775[/C][C]0.469274[/C][/ROW]
[ROW][C]14[/C][C]0.150385[/C][C]1.0527[/C][C]0.148822[/C][/ROW]
[ROW][C]15[/C][C]-0.033481[/C][C]-0.2344[/C][C]0.407839[/C][/ROW]
[ROW][C]16[/C][C]-0.068005[/C][C]-0.476[/C][C]0.318082[/C][/ROW]
[ROW][C]17[/C][C]0.006162[/C][C]0.0431[/C][C]0.482885[/C][/ROW]
[ROW][C]18[/C][C]0.141307[/C][C]0.9892[/C][C]0.163724[/C][/ROW]
[ROW][C]19[/C][C]0.004901[/C][C]0.0343[/C][C]0.486386[/C][/ROW]
[ROW][C]20[/C][C]-0.077846[/C][C]-0.5449[/C][C]0.294139[/C][/ROW]
[ROW][C]21[/C][C]-0.105025[/C][C]-0.7352[/C][C]0.232868[/C][/ROW]
[ROW][C]22[/C][C]0.005088[/C][C]0.0356[/C][C]0.485866[/C][/ROW]
[ROW][C]23[/C][C]0.128451[/C][C]0.8992[/C][C]0.186484[/C][/ROW]
[ROW][C]24[/C][C]-0.311473[/C][C]-2.1803[/C][C]0.017033[/C][/ROW]
[ROW][C]25[/C][C]0.047655[/C][C]0.3336[/C][C]0.370058[/C][/ROW]
[ROW][C]26[/C][C]-0.021517[/C][C]-0.1506[/C][C]0.440447[/C][/ROW]
[ROW][C]27[/C][C]0.044903[/C][C]0.3143[/C][C]0.377307[/C][/ROW]
[ROW][C]28[/C][C]-0.088265[/C][C]-0.6179[/C][C]0.269767[/C][/ROW]
[ROW][C]29[/C][C]-0.067405[/C][C]-0.4718[/C][C]0.319569[/C][/ROW]
[ROW][C]30[/C][C]0.013437[/C][C]0.0941[/C][C]0.462723[/C][/ROW]
[ROW][C]31[/C][C]-0.083758[/C][C]-0.5863[/C][C]0.28018[/C][/ROW]
[ROW][C]32[/C][C]0.008803[/C][C]0.0616[/C][C]0.475556[/C][/ROW]
[ROW][C]33[/C][C]0.016167[/C][C]0.1132[/C][C]0.455181[/C][/ROW]
[ROW][C]34[/C][C]-0.096216[/C][C]-0.6735[/C][C]0.251893[/C][/ROW]
[ROW][C]35[/C][C]0.040501[/C][C]0.2835[/C][C]0.388993[/C][/ROW]
[ROW][C]36[/C][C]0.046577[/C][C]0.326[/C][C]0.372891[/C][/ROW]
[ROW][C]37[/C][C]0.029962[/C][C]0.2097[/C][C]0.417374[/C][/ROW]
[ROW][C]38[/C][C]0.033943[/C][C]0.2376[/C][C]0.406592[/C][/ROW]
[ROW][C]39[/C][C]-0.080244[/C][C]-0.5617[/C][C]0.288439[/C][/ROW]
[ROW][C]40[/C][C]-0.065545[/C][C]-0.4588[/C][C]0.324197[/C][/ROW]
[ROW][C]41[/C][C]-0.009395[/C][C]-0.0658[/C][C]0.473917[/C][/ROW]
[ROW][C]42[/C][C]0.09491[/C][C]0.6644[/C][C]0.254783[/C][/ROW]
[ROW][C]43[/C][C]-0.083979[/C][C]-0.5879[/C][C]0.279665[/C][/ROW]
[ROW][C]44[/C][C]-0.133572[/C][C]-0.935[/C][C]0.177186[/C][/ROW]
[ROW][C]45[/C][C]-0.076985[/C][C]-0.5389[/C][C]0.296199[/C][/ROW]
[ROW][C]46[/C][C]0.017992[/C][C]0.1259[/C][C]0.450145[/C][/ROW]
[ROW][C]47[/C][C]0.051196[/C][C]0.3584[/C][C]0.360802[/C][/ROW]
[ROW][C]48[/C][C]-0.073855[/C][C]-0.517[/C][C]0.303746[/C][/ROW]
[/TABLE]
Source: https://freestatistics.org/blog/index.php?pk=33353&T=2

Globally Unique Identifier (entire table): ba.freestatistics.org/blog/index.php?pk=33353&T=2

As an alternative you can also use a QR Code:  

The GUIDs for individual cells are displayed in the table below:

Partial Autocorrelation Function
Time lag kPACF(k)T-STATP-value
10.3326162.32830.012033
20.3005342.10370.020279
30.456683.19680.001217
4-0.119662-0.83760.203151
5-0.276559-1.93590.029329
60.0603840.42270.337187
7-0.133084-0.93160.178059
80.0476370.33350.370105
90.0485890.34010.367608
10-0.212628-1.48840.071527
11-0.178378-1.24860.108863
12-0.125403-0.87780.192163
130.011070.07750.469274
140.1503851.05270.148822
15-0.033481-0.23440.407839
16-0.068005-0.4760.318082
170.0061620.04310.482885
180.1413070.98920.163724
190.0049010.03430.486386
20-0.077846-0.54490.294139
21-0.105025-0.73520.232868
220.0050880.03560.485866
230.1284510.89920.186484
24-0.311473-2.18030.017033
250.0476550.33360.370058
26-0.021517-0.15060.440447
270.0449030.31430.377307
28-0.088265-0.61790.269767
29-0.067405-0.47180.319569
300.0134370.09410.462723
31-0.083758-0.58630.28018
320.0088030.06160.475556
330.0161670.11320.455181
34-0.096216-0.67350.251893
350.0405010.28350.388993
360.0465770.3260.372891
370.0299620.20970.417374
380.0339430.23760.406592
39-0.080244-0.56170.288439
40-0.065545-0.45880.324197
41-0.009395-0.06580.473917
420.094910.66440.254783
43-0.083979-0.58790.279665
44-0.133572-0.9350.177186
45-0.076985-0.53890.296199
460.0179920.12590.450145
470.0511960.35840.360802
48-0.073855-0.5170.303746


Parameters (Session):
par1 = 12 ;
Parameters (R input):
par1 = 48 ; par2 = 1 ; par3 = 0 ; par4 = 1 ; par5 = 12 ;
R code (references can be found in the software module):
if (par1 == 'Default') {
par1 = 10*log10(length(x))
} else {
par1 <- as.numeric(par1)
}
par2 <- as.numeric(par2)
par3 <- as.numeric(par3)
par4 <- as.numeric(par4)
par5 <- as.numeric(par5)
if (par2 == 0) {
x <- log(x)
} else {
x <- (x ^ par2 - 1) / par2
}
if (par3 > 0) x <- diff(x,lag=1,difference=par3)
if (par4 > 0) x <- diff(x,lag=par5,difference=par4)
bitmap(file='pic1.png')
racf <- acf(x,par1,main='Autocorrelation',xlab='lags',ylab='ACF')
dev.off()
bitmap(file='pic2.png')
rpacf <- pacf(x,par1,main='Partial Autocorrelation',xlab='lags',ylab='PACF')
dev.off()
(myacf <- c(racf$acf))
(mypacf <- c(rpacf$acf))
lengthx <- length(x)
sqrtn <- sqrt(lengthx)
load(file='createtable')
a<-table.start()
a<-table.row.start(a)
a<-table.element(a,'Autocorrelation Function',4,TRUE)
a<-table.row.end(a)
a<-table.row.start(a)
a<-table.element(a,'Time lag k',header=TRUE)
a<-table.element(a,hyperlink('basics.htm','ACF(k)','click here for more information about the Autocorrelation Function'),header=TRUE)
a<-table.element(a,'T-STAT',header=TRUE)
a<-table.element(a,'P-value',header=TRUE)
a<-table.row.end(a)
for (i in 2:(par1+1)) {
a<-table.row.start(a)
a<-table.element(a,i-1,header=TRUE)
a<-table.element(a,round(myacf[i],6))
mytstat <- myacf[i]*sqrtn
a<-table.element(a,round(mytstat,4))
a<-table.element(a,round(1-pt(abs(mytstat),lengthx),6))
a<-table.row.end(a)
}
a<-table.end(a)
table.save(a,file='mytable.tab')
a<-table.start()
a<-table.row.start(a)
a<-table.element(a,'Partial Autocorrelation Function',4,TRUE)
a<-table.row.end(a)
a<-table.row.start(a)
a<-table.element(a,'Time lag k',header=TRUE)
a<-table.element(a,hyperlink('basics.htm','PACF(k)','click here for more information about the Partial Autocorrelation Function'),header=TRUE)
a<-table.element(a,'T-STAT',header=TRUE)
a<-table.element(a,'P-value',header=TRUE)
a<-table.row.end(a)
for (i in 1:par1) {
a<-table.row.start(a)
a<-table.element(a,i,header=TRUE)
a<-table.element(a,round(mypacf[i],6))
mytstat <- mypacf[i]*sqrtn
a<-table.element(a,round(mytstat,4))
a<-table.element(a,round(1-pt(abs(mytstat),lengthx),6))
a<-table.row.end(a)
}
a<-table.end(a)
table.save(a,file='mytable1.tab')