Free Statistics

of Irreproducible Research!

Author's title

Author*Unverified author*
R Software Modulerwasp_notchedbox1.wasp
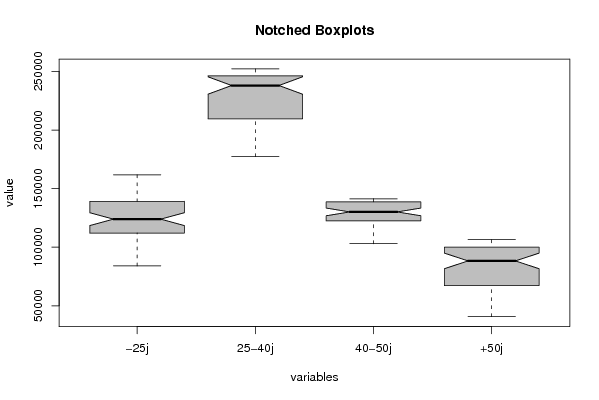
Title produced by softwareNotched Boxplots
Date of computationSun, 14 Dec 2008 06:17:25 -0700
Cite this page as followsStatistical Computations at FreeStatistics.org, Office for Research Development and Education, URL https://freestatistics.org/blog/index.php?v=date/2008/Dec/14/t1229260706icu2nwyl67pr40b.htm/, Retrieved Wed, 15 May 2024 10:22:27 +0000
Statistical Computations at FreeStatistics.org, Office for Research Development and Education, URL https://freestatistics.org/blog/index.php?pk=33351, Retrieved Wed, 15 May 2024 10:22:27 +0000
QR Codes:

Original text written by user:
IsPrivate?No (this computation is public)
User-defined keywords
Estimated Impact157
Family? (F = Feedback message, R = changed R code, M = changed R Module, P = changed Parameters, D = changed Data)
-       [Notched Boxplots] [paper notched box...] [2008-12-14 13:17:25] [4940af498c7c54f3992f17142bd40069] [Current]
Feedback Forum

Post a new message
Dataseries X:
111078	231814	123364	40715
150739	246796	127760	44028
159129	247891	127130	45564
157928	248291	127496	44277
147768	245766	126954	44976
137507	238776	125655	45406
136919	242541	127949	47379
136151	246861	130113	49200
133001	246843	130789	50221
125554	246947	131258	51573
119647	241679	129182	53091
114158	240085	129082	53337
116193	241514	130037	54978
152803	250525	132317	57885
161761	250567	131336	67099
160942	252145	132357	67169
149470	251877	140181	69796
139208	245817	138542	70600
134588	248269	140615	71982
130322	246310	140276	73957
126611	246733	140762	75273
122401	245028	140677	76322
117352	240022	138648	77078
112135	238614	138753	77954
112879	238096	138815	79238
148729	248530	141297	82179
157230	248381	139439	83834
157221	247567	139700	83744
146681	241783	138792	84861
136524	235000	137402	86478
132111	237384	139356	88290
125326	238020	139775	90287
122716	236412	139714	91230
116615	232279	138525	92380
113719	230408	137572	92506
110737	230254	137612	94172
112093	229217	136904	94728
143565	239658	139763	96581
149946	239906	138613	97344
149147	236558	135865	98346
134339	223566	131506	98214
122683	216054	128639	98366
115614	214685	128207	98768
116566	216086	128092	99832
111272	211692	125914	99976
104609	204681	122422	99961
101802	203075	120878	100164
94542	198401	118131	99964
93051	191246	115061	99304
124129	206750	120475	104008
130374	209611	119962	104644
123946	199573	114188	103950
114971	195635	112201	104263
105531	190062	110012	104241
104919	193134	111064	105141
104782	194795	111327	106018
101281	190835	109579	105866
94545	185045	107088	105944
93248	184425	106191	106379
84031	177293	102951	105082
87486	180549	104630	104915


Summary of computational transaction
Raw Inputview raw input (R code)
Raw Outputview raw output of R engine
Computing time2 seconds
R Server'Sir Ronald Aylmer Fisher' @ 193.190.124.24

\begin{tabular}{lllllllll}
\hline
Summary of computational transaction \tabularnewline
Raw Input & view raw input (R code)  \tabularnewline
Raw Output & view raw output of R engine  \tabularnewline
Computing time & 2 seconds \tabularnewline
R Server & 'Sir Ronald Aylmer Fisher' @ 193.190.124.24 \tabularnewline
\hline
\end{tabular}
%Source: https://freestatistics.org/blog/index.php?pk=33351&T=0

[TABLE]
[ROW][C]Summary of computational transaction[/C][/ROW]
[ROW][C]Raw Input[/C][C]view raw input (R code) [/C][/ROW]
[ROW][C]Raw Output[/C][C]view raw output of R engine [/C][/ROW]
[ROW][C]Computing time[/C][C]2 seconds[/C][/ROW]
[ROW][C]R Server[/C][C]'Sir Ronald Aylmer Fisher' @ 193.190.124.24[/C][/ROW]
[/TABLE]
Source: https://freestatistics.org/blog/index.php?pk=33351&T=0

Globally Unique Identifier (entire table): ba.freestatistics.org/blog/index.php?pk=33351&T=0

As an alternative you can also use a QR Code:  

The GUIDs for individual cells are displayed in the table below:

Summary of computational transaction
Raw Inputview raw input (R code)
Raw Outputview raw output of R engine
Computing time2 seconds
R Server'Sir Ronald Aylmer Fisher' @ 193.190.124.24


Boxplot statistics
Variablelower whiskerlower hingemedianupper hingeupper whisker
-25j84031112093123946139208161761
25-40j177293209611238020246310252145
40-50j102951122422130113138648141297
+50j40715671698829099961106379

\begin{tabular}{lllllllll}
\hline
Boxplot statistics \tabularnewline
Variable & lower whisker & lower hinge & median & upper hinge & upper whisker \tabularnewline
-25j & 84031 & 112093 & 123946 & 139208 & 161761 \tabularnewline
25-40j & 177293 & 209611 & 238020 & 246310 & 252145 \tabularnewline
40-50j & 102951 & 122422 & 130113 & 138648 & 141297 \tabularnewline
+50j & 40715 & 67169 & 88290 & 99961 & 106379 \tabularnewline
\hline
\end{tabular}
%Source: https://freestatistics.org/blog/index.php?pk=33351&T=1

[TABLE]
[ROW][C]Boxplot statistics[/C][/ROW]
[ROW][C]Variable[/C][C]lower whisker[/C][C]lower hinge[/C][C]median[/C][C]upper hinge[/C][C]upper whisker[/C][/ROW]
[ROW][C]-25j[/C][C]84031[/C][C]112093[/C][C]123946[/C][C]139208[/C][C]161761[/C][/ROW]
[ROW][C]25-40j[/C][C]177293[/C][C]209611[/C][C]238020[/C][C]246310[/C][C]252145[/C][/ROW]
[ROW][C]40-50j[/C][C]102951[/C][C]122422[/C][C]130113[/C][C]138648[/C][C]141297[/C][/ROW]
[ROW][C]+50j[/C][C]40715[/C][C]67169[/C][C]88290[/C][C]99961[/C][C]106379[/C][/ROW]
[/TABLE]
Source: https://freestatistics.org/blog/index.php?pk=33351&T=1

Globally Unique Identifier (entire table): ba.freestatistics.org/blog/index.php?pk=33351&T=1

As an alternative you can also use a QR Code:  

The GUIDs for individual cells are displayed in the table below:

Boxplot statistics
Variablelower whiskerlower hingemedianupper hingeupper whisker
-25j84031112093123946139208161761
25-40j177293209611238020246310252145
40-50j102951122422130113138648141297
+50j40715671698829099961106379


Boxplot Notches
Variablelower boundmedianupper bound
-25j118460.682400979123946129431.317599021
25-40j230595.855778481238020245444.144221519
40-50j126830.50826621130113133395.49173379
+50j81656.235120528829094923.76487948

\begin{tabular}{lllllllll}
\hline
Boxplot Notches \tabularnewline
Variable & lower bound & median & upper bound \tabularnewline
-25j & 118460.682400979 & 123946 & 129431.317599021 \tabularnewline
25-40j & 230595.855778481 & 238020 & 245444.144221519 \tabularnewline
40-50j & 126830.50826621 & 130113 & 133395.49173379 \tabularnewline
+50j & 81656.23512052 & 88290 & 94923.76487948 \tabularnewline
\hline
\end{tabular}
%Source: https://freestatistics.org/blog/index.php?pk=33351&T=2

[TABLE]
[ROW][C]Boxplot Notches[/C][/ROW]
[ROW][C]Variable[/C][C]lower bound[/C][C]median[/C][C]upper bound[/C][/ROW]
[ROW][C]-25j[/C][C]118460.682400979[/C][C]123946[/C][C]129431.317599021[/C][/ROW]
[ROW][C]25-40j[/C][C]230595.855778481[/C][C]238020[/C][C]245444.144221519[/C][/ROW]
[ROW][C]40-50j[/C][C]126830.50826621[/C][C]130113[/C][C]133395.49173379[/C][/ROW]
[ROW][C]+50j[/C][C]81656.23512052[/C][C]88290[/C][C]94923.76487948[/C][/ROW]
[/TABLE]
Source: https://freestatistics.org/blog/index.php?pk=33351&T=2

Globally Unique Identifier (entire table): ba.freestatistics.org/blog/index.php?pk=33351&T=2

As an alternative you can also use a QR Code:  

The GUIDs for individual cells are displayed in the table below:

Boxplot Notches
Variablelower boundmedianupper bound
-25j118460.682400979123946129431.317599021
25-40j230595.855778481238020245444.144221519
40-50j126830.50826621130113133395.49173379
+50j81656.235120528829094923.76487948


Parameters (Session):
par1 = grey ;
Parameters (R input):
par1 = grey ;
R code (references can be found in the software module):
z <- as.data.frame(t(y))
bitmap(file='test1.png')
(r<-boxplot(z ,xlab=xlab,ylab=ylab,main=main,notch=TRUE,col=par1))
dev.off()
load(file='createtable')
a<-table.start()
a<-table.row.start(a)
a<-table.element(a,hyperlink('overview.htm','Boxplot statistics','Boxplot overview'),6,TRUE)
a<-table.row.end(a)
a<-table.row.start(a)
a<-table.element(a,'Variable',1,TRUE)
a<-table.element(a,hyperlink('lower_whisker.htm','lower whisker','definition of lower whisker'),1,TRUE)
a<-table.element(a,hyperlink('lower_hinge.htm','lower hinge','definition of lower hinge'),1,TRUE)
a<-table.element(a,hyperlink('central_tendency.htm','median','definitions about measures of central tendency'),1,TRUE)
a<-table.element(a,hyperlink('upper_hinge.htm','upper hinge','definition of upper hinge'),1,TRUE)
a<-table.element(a,hyperlink('upper_whisker.htm','upper whisker','definition of upper whisker'),1,TRUE)
a<-table.row.end(a)
for (i in 1:length(y[,1]))
{
a<-table.row.start(a)
a<-table.element(a,dimnames(t(x))[[2]][i],1,TRUE)
for (j in 1:5)
{
a<-table.element(a,r$stats[j,i])
}
a<-table.row.end(a)
}
a<-table.end(a)
table.save(a,file='mytable.tab')
a<-table.start()
a<-table.row.start(a)
a<-table.element(a,'Boxplot Notches',4,TRUE)
a<-table.row.end(a)
a<-table.row.start(a)
a<-table.element(a,'Variable',1,TRUE)
a<-table.element(a,'lower bound',1,TRUE)
a<-table.element(a,'median',1,TRUE)
a<-table.element(a,'upper bound',1,TRUE)
a<-table.row.end(a)
for (i in 1:length(y[,1]))
{
a<-table.row.start(a)
a<-table.element(a,dimnames(t(x))[[2]][i],1,TRUE)
a<-table.element(a,r$conf[1,i])
a<-table.element(a,r$stats[3,i])
a<-table.element(a,r$conf[2,i])
a<-table.row.end(a)
}
a<-table.end(a)
table.save(a,file='mytable1.tab')