Free Statistics

of Irreproducible Research!

Author's title

Author*Unverified author*
R Software Modulerwasp_arimaforecasting.wasp
Title produced by softwareARIMA Forecasting
Date of computationSun, 14 Dec 2008 05:51:41 -0700
Cite this page as followsStatistical Computations at FreeStatistics.org, Office for Research Development and Education, URL https://freestatistics.org/blog/index.php?v=date/2008/Dec/14/t1229259290v0q9m7j6etmfya9.htm/, Retrieved Wed, 15 May 2024 04:28:46 +0000
Statistical Computations at FreeStatistics.org, Office for Research Development and Education, URL https://freestatistics.org/blog/index.php?pk=33334, Retrieved Wed, 15 May 2024 04:28:46 +0000
QR Codes:

Original text written by user:
IsPrivate?No (this computation is public)
User-defined keywords
Estimated Impact158
Family? (F = Feedback message, R = changed R code, M = changed R Module, P = changed Parameters, D = changed Data)
F       [ARIMA Forecasting] [W9Q1] [2008-12-14 12:51:41] [823d674fbf3a4e0ec71bbbd5140f82c6] [Current]
Feedback Forum
2008-12-23 13:49:08 [Jonas Janssens] [reply
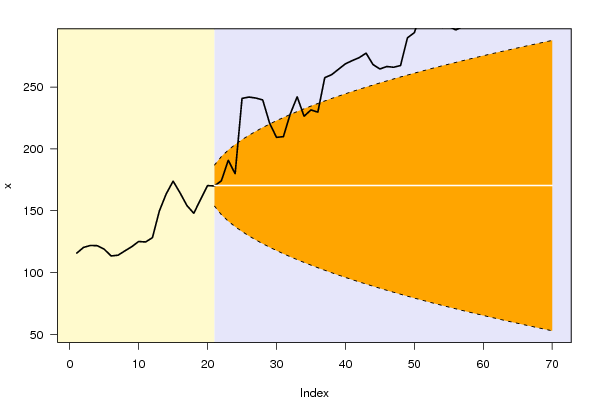
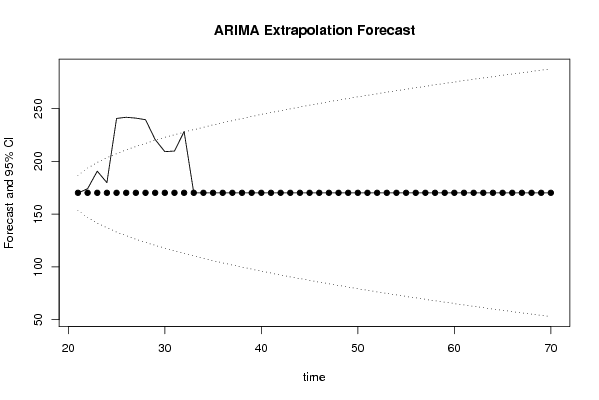
Ik denk dat je de testing period op 12 moest zetten ipv 50. Maar dan nog krijg je een zeer merkwaardige uitkomst.
2008-12-23 16:55:28 [Glenn Maras] [reply
De berekening was helemaal verkeerd uitgevoerd. De testing period die geselcteerd moest worden waren de laatste 12maanden en niet de 50laatste. Ook heeft de student hier geen waarden aan d D p P q Q gegeven. Dit is toch wel opmerkelijk. De overige vragen zijn niet opgelost.

Post a new message
Dataseries X:
115,6
120,3
121,9
121,7
118,9
113,4
114
117,5
120,9
125,1
124,7
128,2
149,7
163,6
173,9
164,5
154,2
147,9
159,3
170,3
170
174,2
190,8
179,9
240,8
241,9
241,1
239,6
220,8
209,3
209,9
228,3
242,1
226,4
231,5
229,7
257,6
260
264,4
268,8
271,4
273,8
277,4
268,2
264,6
266,6
266
267,4
289,8
294
310,3
311,7
302,1
298,2
299,2
296,2
299
300
299,4
300,2
470,2
472,1
484,8
513,4
547,2
548,1
544,7
521,1
459
413,2


Summary of computational transaction
Raw Inputview raw input (R code)
Raw Outputview raw output of R engine
Computing time3 seconds
R Server'Sir Ronald Aylmer Fisher' @ 193.190.124.24

\begin{tabular}{lllllllll}
\hline
Summary of computational transaction \tabularnewline
Raw Input & view raw input (R code)  \tabularnewline
Raw Output & view raw output of R engine  \tabularnewline
Computing time & 3 seconds \tabularnewline
R Server & 'Sir Ronald Aylmer Fisher' @ 193.190.124.24 \tabularnewline
\hline
\end{tabular}
%Source: https://freestatistics.org/blog/index.php?pk=33334&T=0

[TABLE]
[ROW][C]Summary of computational transaction[/C][/ROW]
[ROW][C]Raw Input[/C][C]view raw input (R code) [/C][/ROW]
[ROW][C]Raw Output[/C][C]view raw output of R engine [/C][/ROW]
[ROW][C]Computing time[/C][C]3 seconds[/C][/ROW]
[ROW][C]R Server[/C][C]'Sir Ronald Aylmer Fisher' @ 193.190.124.24[/C][/ROW]
[/TABLE]
Source: https://freestatistics.org/blog/index.php?pk=33334&T=0

Globally Unique Identifier (entire table): ba.freestatistics.org/blog/index.php?pk=33334&T=0

As an alternative you can also use a QR Code:  

The GUIDs for individual cells are displayed in the table below:

Summary of computational transaction
Raw Inputview raw input (R code)
Raw Outputview raw output of R engine
Computing time3 seconds
R Server'Sir Ronald Aylmer Fisher' @ 193.190.124.24


Univariate ARIMA Extrapolation Forecast
timeY[t]F[t]95% LB95% UBp-value(H0: Y[t] = F[t])P(F[t]>Y[t-1])P(F[t]>Y[t-s])P(F[t]>Y[20])
8117.5-------
9120.9-------
10125.1-------
11124.7-------
12128.2-------
13149.7-------
14163.6-------
15173.9-------
16164.5-------
17154.2-------
18147.9-------
19159.3-------
20170.3-------
21170170.3153.6953186.90470.48590.510.5
22174.2170.3146.8174193.78260.37240.510.99990.5
23190.8170.3141.5398199.06020.08120.39520.99910.5
24179.9170.3137.0906203.50940.28550.11320.99350.5
25240.8170.3133.1708207.42921e-040.30620.86160.5
26241.9170.3129.627210.9733e-043e-040.62660.5
27241.1170.3126.3681214.23198e-047e-040.43620.5
28239.6170.3123.3348217.26520.00190.00160.59560.5
29220.8170.3120.4859220.11410.02350.00320.73680.5
30209.3170.3117.7914222.80860.07270.02970.79850.5
31209.9170.3115.2285225.37150.07940.08260.65230.5
32228.3170.3112.7797227.82030.02410.08860.50.5
33242.1170.3110.4309230.16910.00940.02880.50390.5
34226.4170.3108.1709232.42910.03840.01180.4510.5
35231.5170.3105.9903234.60970.03110.04370.26610.5
36229.7170.3103.8812236.71880.03980.03550.38850.5
37257.6170.3101.8371238.76290.00620.04450.02180.5
38260170.399.8523240.74770.00630.00760.02320.5
39264.4170.397.9218242.67820.00540.00760.02760.5
40268.8170.396.0416244.55840.00470.00650.03370.5
41271.4170.394.2078246.39220.00460.00560.09670.5
42273.8170.392.4171248.18290.00460.00550.16320.5
43277.4170.390.6667249.93330.00420.00540.16490.5
44268.2170.388.954251.6460.00920.00490.08110.5
45264.6170.387.2766253.32340.0130.01040.0450.5
46266.6170.385.6324254.96760.01290.01450.0970.5
47266170.384.0195256.58050.01490.01430.08220.5
48267.4170.382.4362258.16380.01520.01640.09260.5
49289.8170.380.881259.7190.00440.01670.02780.5
50294170.379.3524261.24760.00380.0050.02660.5
51310.3170.377.849262.7510.00150.00440.0230.5
52311.7170.376.3697264.23030.00160.00170.01990.5
53302.1170.374.9133265.68670.00340.00180.01890.5
54298.2170.373.4789267.12110.00480.00380.01810.5
55299.2170.372.0653268.53470.00510.00540.01630.5
56296.2170.370.6719269.92810.00660.00560.02710.5
57299170.369.2976271.30240.00630.00730.03360.5
58300170.367.9418272.65820.00650.00690.03260.5
59299.4170.366.6038273.99620.00730.00710.03520.5
60300.2170.365.2827275.31730.00770.0080.0350.5
61470.2170.363.9781276.621900.00830.01380.5
62472.1170.362.6893277.9107000.01210.5
63484.8170.361.4158279.1842000.00590.5
64513.4170.360.157280.443000.00590.5
65547.2170.358.9124281.6876000.01020.5
66548.1170.357.6815282.9185000.0130.5
67544.7170.356.464284.136000.01320.5
68521.1170.355.2593285.3407000.0160.5
69459170.354.0672286.5328000.0150.5
70413.2170.352.8871287.7129000.01520.5

\begin{tabular}{lllllllll}
\hline
Univariate ARIMA Extrapolation Forecast \tabularnewline
time & Y[t] & F[t] & 95% LB & 95% UB & p-value(H0: Y[t] = F[t]) & P(F[t]>Y[t-1]) & P(F[t]>Y[t-s]) & P(F[t]>Y[20]) \tabularnewline
8 & 117.5 & - & - & - & - & - & - & - \tabularnewline
9 & 120.9 & - & - & - & - & - & - & - \tabularnewline
10 & 125.1 & - & - & - & - & - & - & - \tabularnewline
11 & 124.7 & - & - & - & - & - & - & - \tabularnewline
12 & 128.2 & - & - & - & - & - & - & - \tabularnewline
13 & 149.7 & - & - & - & - & - & - & - \tabularnewline
14 & 163.6 & - & - & - & - & - & - & - \tabularnewline
15 & 173.9 & - & - & - & - & - & - & - \tabularnewline
16 & 164.5 & - & - & - & - & - & - & - \tabularnewline
17 & 154.2 & - & - & - & - & - & - & - \tabularnewline
18 & 147.9 & - & - & - & - & - & - & - \tabularnewline
19 & 159.3 & - & - & - & - & - & - & - \tabularnewline
20 & 170.3 & - & - & - & - & - & - & - \tabularnewline
21 & 170 & 170.3 & 153.6953 & 186.9047 & 0.4859 & 0.5 & 1 & 0.5 \tabularnewline
22 & 174.2 & 170.3 & 146.8174 & 193.7826 & 0.3724 & 0.51 & 0.9999 & 0.5 \tabularnewline
23 & 190.8 & 170.3 & 141.5398 & 199.0602 & 0.0812 & 0.3952 & 0.9991 & 0.5 \tabularnewline
24 & 179.9 & 170.3 & 137.0906 & 203.5094 & 0.2855 & 0.1132 & 0.9935 & 0.5 \tabularnewline
25 & 240.8 & 170.3 & 133.1708 & 207.4292 & 1e-04 & 0.3062 & 0.8616 & 0.5 \tabularnewline
26 & 241.9 & 170.3 & 129.627 & 210.973 & 3e-04 & 3e-04 & 0.6266 & 0.5 \tabularnewline
27 & 241.1 & 170.3 & 126.3681 & 214.2319 & 8e-04 & 7e-04 & 0.4362 & 0.5 \tabularnewline
28 & 239.6 & 170.3 & 123.3348 & 217.2652 & 0.0019 & 0.0016 & 0.5956 & 0.5 \tabularnewline
29 & 220.8 & 170.3 & 120.4859 & 220.1141 & 0.0235 & 0.0032 & 0.7368 & 0.5 \tabularnewline
30 & 209.3 & 170.3 & 117.7914 & 222.8086 & 0.0727 & 0.0297 & 0.7985 & 0.5 \tabularnewline
31 & 209.9 & 170.3 & 115.2285 & 225.3715 & 0.0794 & 0.0826 & 0.6523 & 0.5 \tabularnewline
32 & 228.3 & 170.3 & 112.7797 & 227.8203 & 0.0241 & 0.0886 & 0.5 & 0.5 \tabularnewline
33 & 242.1 & 170.3 & 110.4309 & 230.1691 & 0.0094 & 0.0288 & 0.5039 & 0.5 \tabularnewline
34 & 226.4 & 170.3 & 108.1709 & 232.4291 & 0.0384 & 0.0118 & 0.451 & 0.5 \tabularnewline
35 & 231.5 & 170.3 & 105.9903 & 234.6097 & 0.0311 & 0.0437 & 0.2661 & 0.5 \tabularnewline
36 & 229.7 & 170.3 & 103.8812 & 236.7188 & 0.0398 & 0.0355 & 0.3885 & 0.5 \tabularnewline
37 & 257.6 & 170.3 & 101.8371 & 238.7629 & 0.0062 & 0.0445 & 0.0218 & 0.5 \tabularnewline
38 & 260 & 170.3 & 99.8523 & 240.7477 & 0.0063 & 0.0076 & 0.0232 & 0.5 \tabularnewline
39 & 264.4 & 170.3 & 97.9218 & 242.6782 & 0.0054 & 0.0076 & 0.0276 & 0.5 \tabularnewline
40 & 268.8 & 170.3 & 96.0416 & 244.5584 & 0.0047 & 0.0065 & 0.0337 & 0.5 \tabularnewline
41 & 271.4 & 170.3 & 94.2078 & 246.3922 & 0.0046 & 0.0056 & 0.0967 & 0.5 \tabularnewline
42 & 273.8 & 170.3 & 92.4171 & 248.1829 & 0.0046 & 0.0055 & 0.1632 & 0.5 \tabularnewline
43 & 277.4 & 170.3 & 90.6667 & 249.9333 & 0.0042 & 0.0054 & 0.1649 & 0.5 \tabularnewline
44 & 268.2 & 170.3 & 88.954 & 251.646 & 0.0092 & 0.0049 & 0.0811 & 0.5 \tabularnewline
45 & 264.6 & 170.3 & 87.2766 & 253.3234 & 0.013 & 0.0104 & 0.045 & 0.5 \tabularnewline
46 & 266.6 & 170.3 & 85.6324 & 254.9676 & 0.0129 & 0.0145 & 0.097 & 0.5 \tabularnewline
47 & 266 & 170.3 & 84.0195 & 256.5805 & 0.0149 & 0.0143 & 0.0822 & 0.5 \tabularnewline
48 & 267.4 & 170.3 & 82.4362 & 258.1638 & 0.0152 & 0.0164 & 0.0926 & 0.5 \tabularnewline
49 & 289.8 & 170.3 & 80.881 & 259.719 & 0.0044 & 0.0167 & 0.0278 & 0.5 \tabularnewline
50 & 294 & 170.3 & 79.3524 & 261.2476 & 0.0038 & 0.005 & 0.0266 & 0.5 \tabularnewline
51 & 310.3 & 170.3 & 77.849 & 262.751 & 0.0015 & 0.0044 & 0.023 & 0.5 \tabularnewline
52 & 311.7 & 170.3 & 76.3697 & 264.2303 & 0.0016 & 0.0017 & 0.0199 & 0.5 \tabularnewline
53 & 302.1 & 170.3 & 74.9133 & 265.6867 & 0.0034 & 0.0018 & 0.0189 & 0.5 \tabularnewline
54 & 298.2 & 170.3 & 73.4789 & 267.1211 & 0.0048 & 0.0038 & 0.0181 & 0.5 \tabularnewline
55 & 299.2 & 170.3 & 72.0653 & 268.5347 & 0.0051 & 0.0054 & 0.0163 & 0.5 \tabularnewline
56 & 296.2 & 170.3 & 70.6719 & 269.9281 & 0.0066 & 0.0056 & 0.0271 & 0.5 \tabularnewline
57 & 299 & 170.3 & 69.2976 & 271.3024 & 0.0063 & 0.0073 & 0.0336 & 0.5 \tabularnewline
58 & 300 & 170.3 & 67.9418 & 272.6582 & 0.0065 & 0.0069 & 0.0326 & 0.5 \tabularnewline
59 & 299.4 & 170.3 & 66.6038 & 273.9962 & 0.0073 & 0.0071 & 0.0352 & 0.5 \tabularnewline
60 & 300.2 & 170.3 & 65.2827 & 275.3173 & 0.0077 & 0.008 & 0.035 & 0.5 \tabularnewline
61 & 470.2 & 170.3 & 63.9781 & 276.6219 & 0 & 0.0083 & 0.0138 & 0.5 \tabularnewline
62 & 472.1 & 170.3 & 62.6893 & 277.9107 & 0 & 0 & 0.0121 & 0.5 \tabularnewline
63 & 484.8 & 170.3 & 61.4158 & 279.1842 & 0 & 0 & 0.0059 & 0.5 \tabularnewline
64 & 513.4 & 170.3 & 60.157 & 280.443 & 0 & 0 & 0.0059 & 0.5 \tabularnewline
65 & 547.2 & 170.3 & 58.9124 & 281.6876 & 0 & 0 & 0.0102 & 0.5 \tabularnewline
66 & 548.1 & 170.3 & 57.6815 & 282.9185 & 0 & 0 & 0.013 & 0.5 \tabularnewline
67 & 544.7 & 170.3 & 56.464 & 284.136 & 0 & 0 & 0.0132 & 0.5 \tabularnewline
68 & 521.1 & 170.3 & 55.2593 & 285.3407 & 0 & 0 & 0.016 & 0.5 \tabularnewline
69 & 459 & 170.3 & 54.0672 & 286.5328 & 0 & 0 & 0.015 & 0.5 \tabularnewline
70 & 413.2 & 170.3 & 52.8871 & 287.7129 & 0 & 0 & 0.0152 & 0.5 \tabularnewline
\hline
\end{tabular}
%Source: https://freestatistics.org/blog/index.php?pk=33334&T=1

[TABLE]
[ROW][C]Univariate ARIMA Extrapolation Forecast[/C][/ROW]
[ROW][C]time[/C][C]Y[t][/C][C]F[t][/C][C]95% LB[/C][C]95% UB[/C][C]p-value(H0: Y[t] = F[t])[/C][C]P(F[t]>Y[t-1])[/C][C]P(F[t]>Y[t-s])[/C][C]P(F[t]>Y[20])[/C][/ROW]
[ROW][C]8[/C][C]117.5[/C][C]-[/C][C]-[/C][C]-[/C][C]-[/C][C]-[/C][C]-[/C][C]-[/C][/ROW]
[ROW][C]9[/C][C]120.9[/C][C]-[/C][C]-[/C][C]-[/C][C]-[/C][C]-[/C][C]-[/C][C]-[/C][/ROW]
[ROW][C]10[/C][C]125.1[/C][C]-[/C][C]-[/C][C]-[/C][C]-[/C][C]-[/C][C]-[/C][C]-[/C][/ROW]
[ROW][C]11[/C][C]124.7[/C][C]-[/C][C]-[/C][C]-[/C][C]-[/C][C]-[/C][C]-[/C][C]-[/C][/ROW]
[ROW][C]12[/C][C]128.2[/C][C]-[/C][C]-[/C][C]-[/C][C]-[/C][C]-[/C][C]-[/C][C]-[/C][/ROW]
[ROW][C]13[/C][C]149.7[/C][C]-[/C][C]-[/C][C]-[/C][C]-[/C][C]-[/C][C]-[/C][C]-[/C][/ROW]
[ROW][C]14[/C][C]163.6[/C][C]-[/C][C]-[/C][C]-[/C][C]-[/C][C]-[/C][C]-[/C][C]-[/C][/ROW]
[ROW][C]15[/C][C]173.9[/C][C]-[/C][C]-[/C][C]-[/C][C]-[/C][C]-[/C][C]-[/C][C]-[/C][/ROW]
[ROW][C]16[/C][C]164.5[/C][C]-[/C][C]-[/C][C]-[/C][C]-[/C][C]-[/C][C]-[/C][C]-[/C][/ROW]
[ROW][C]17[/C][C]154.2[/C][C]-[/C][C]-[/C][C]-[/C][C]-[/C][C]-[/C][C]-[/C][C]-[/C][/ROW]
[ROW][C]18[/C][C]147.9[/C][C]-[/C][C]-[/C][C]-[/C][C]-[/C][C]-[/C][C]-[/C][C]-[/C][/ROW]
[ROW][C]19[/C][C]159.3[/C][C]-[/C][C]-[/C][C]-[/C][C]-[/C][C]-[/C][C]-[/C][C]-[/C][/ROW]
[ROW][C]20[/C][C]170.3[/C][C]-[/C][C]-[/C][C]-[/C][C]-[/C][C]-[/C][C]-[/C][C]-[/C][/ROW]
[ROW][C]21[/C][C]170[/C][C]170.3[/C][C]153.6953[/C][C]186.9047[/C][C]0.4859[/C][C]0.5[/C][C]1[/C][C]0.5[/C][/ROW]
[ROW][C]22[/C][C]174.2[/C][C]170.3[/C][C]146.8174[/C][C]193.7826[/C][C]0.3724[/C][C]0.51[/C][C]0.9999[/C][C]0.5[/C][/ROW]
[ROW][C]23[/C][C]190.8[/C][C]170.3[/C][C]141.5398[/C][C]199.0602[/C][C]0.0812[/C][C]0.3952[/C][C]0.9991[/C][C]0.5[/C][/ROW]
[ROW][C]24[/C][C]179.9[/C][C]170.3[/C][C]137.0906[/C][C]203.5094[/C][C]0.2855[/C][C]0.1132[/C][C]0.9935[/C][C]0.5[/C][/ROW]
[ROW][C]25[/C][C]240.8[/C][C]170.3[/C][C]133.1708[/C][C]207.4292[/C][C]1e-04[/C][C]0.3062[/C][C]0.8616[/C][C]0.5[/C][/ROW]
[ROW][C]26[/C][C]241.9[/C][C]170.3[/C][C]129.627[/C][C]210.973[/C][C]3e-04[/C][C]3e-04[/C][C]0.6266[/C][C]0.5[/C][/ROW]
[ROW][C]27[/C][C]241.1[/C][C]170.3[/C][C]126.3681[/C][C]214.2319[/C][C]8e-04[/C][C]7e-04[/C][C]0.4362[/C][C]0.5[/C][/ROW]
[ROW][C]28[/C][C]239.6[/C][C]170.3[/C][C]123.3348[/C][C]217.2652[/C][C]0.0019[/C][C]0.0016[/C][C]0.5956[/C][C]0.5[/C][/ROW]
[ROW][C]29[/C][C]220.8[/C][C]170.3[/C][C]120.4859[/C][C]220.1141[/C][C]0.0235[/C][C]0.0032[/C][C]0.7368[/C][C]0.5[/C][/ROW]
[ROW][C]30[/C][C]209.3[/C][C]170.3[/C][C]117.7914[/C][C]222.8086[/C][C]0.0727[/C][C]0.0297[/C][C]0.7985[/C][C]0.5[/C][/ROW]
[ROW][C]31[/C][C]209.9[/C][C]170.3[/C][C]115.2285[/C][C]225.3715[/C][C]0.0794[/C][C]0.0826[/C][C]0.6523[/C][C]0.5[/C][/ROW]
[ROW][C]32[/C][C]228.3[/C][C]170.3[/C][C]112.7797[/C][C]227.8203[/C][C]0.0241[/C][C]0.0886[/C][C]0.5[/C][C]0.5[/C][/ROW]
[ROW][C]33[/C][C]242.1[/C][C]170.3[/C][C]110.4309[/C][C]230.1691[/C][C]0.0094[/C][C]0.0288[/C][C]0.5039[/C][C]0.5[/C][/ROW]
[ROW][C]34[/C][C]226.4[/C][C]170.3[/C][C]108.1709[/C][C]232.4291[/C][C]0.0384[/C][C]0.0118[/C][C]0.451[/C][C]0.5[/C][/ROW]
[ROW][C]35[/C][C]231.5[/C][C]170.3[/C][C]105.9903[/C][C]234.6097[/C][C]0.0311[/C][C]0.0437[/C][C]0.2661[/C][C]0.5[/C][/ROW]
[ROW][C]36[/C][C]229.7[/C][C]170.3[/C][C]103.8812[/C][C]236.7188[/C][C]0.0398[/C][C]0.0355[/C][C]0.3885[/C][C]0.5[/C][/ROW]
[ROW][C]37[/C][C]257.6[/C][C]170.3[/C][C]101.8371[/C][C]238.7629[/C][C]0.0062[/C][C]0.0445[/C][C]0.0218[/C][C]0.5[/C][/ROW]
[ROW][C]38[/C][C]260[/C][C]170.3[/C][C]99.8523[/C][C]240.7477[/C][C]0.0063[/C][C]0.0076[/C][C]0.0232[/C][C]0.5[/C][/ROW]
[ROW][C]39[/C][C]264.4[/C][C]170.3[/C][C]97.9218[/C][C]242.6782[/C][C]0.0054[/C][C]0.0076[/C][C]0.0276[/C][C]0.5[/C][/ROW]
[ROW][C]40[/C][C]268.8[/C][C]170.3[/C][C]96.0416[/C][C]244.5584[/C][C]0.0047[/C][C]0.0065[/C][C]0.0337[/C][C]0.5[/C][/ROW]
[ROW][C]41[/C][C]271.4[/C][C]170.3[/C][C]94.2078[/C][C]246.3922[/C][C]0.0046[/C][C]0.0056[/C][C]0.0967[/C][C]0.5[/C][/ROW]
[ROW][C]42[/C][C]273.8[/C][C]170.3[/C][C]92.4171[/C][C]248.1829[/C][C]0.0046[/C][C]0.0055[/C][C]0.1632[/C][C]0.5[/C][/ROW]
[ROW][C]43[/C][C]277.4[/C][C]170.3[/C][C]90.6667[/C][C]249.9333[/C][C]0.0042[/C][C]0.0054[/C][C]0.1649[/C][C]0.5[/C][/ROW]
[ROW][C]44[/C][C]268.2[/C][C]170.3[/C][C]88.954[/C][C]251.646[/C][C]0.0092[/C][C]0.0049[/C][C]0.0811[/C][C]0.5[/C][/ROW]
[ROW][C]45[/C][C]264.6[/C][C]170.3[/C][C]87.2766[/C][C]253.3234[/C][C]0.013[/C][C]0.0104[/C][C]0.045[/C][C]0.5[/C][/ROW]
[ROW][C]46[/C][C]266.6[/C][C]170.3[/C][C]85.6324[/C][C]254.9676[/C][C]0.0129[/C][C]0.0145[/C][C]0.097[/C][C]0.5[/C][/ROW]
[ROW][C]47[/C][C]266[/C][C]170.3[/C][C]84.0195[/C][C]256.5805[/C][C]0.0149[/C][C]0.0143[/C][C]0.0822[/C][C]0.5[/C][/ROW]
[ROW][C]48[/C][C]267.4[/C][C]170.3[/C][C]82.4362[/C][C]258.1638[/C][C]0.0152[/C][C]0.0164[/C][C]0.0926[/C][C]0.5[/C][/ROW]
[ROW][C]49[/C][C]289.8[/C][C]170.3[/C][C]80.881[/C][C]259.719[/C][C]0.0044[/C][C]0.0167[/C][C]0.0278[/C][C]0.5[/C][/ROW]
[ROW][C]50[/C][C]294[/C][C]170.3[/C][C]79.3524[/C][C]261.2476[/C][C]0.0038[/C][C]0.005[/C][C]0.0266[/C][C]0.5[/C][/ROW]
[ROW][C]51[/C][C]310.3[/C][C]170.3[/C][C]77.849[/C][C]262.751[/C][C]0.0015[/C][C]0.0044[/C][C]0.023[/C][C]0.5[/C][/ROW]
[ROW][C]52[/C][C]311.7[/C][C]170.3[/C][C]76.3697[/C][C]264.2303[/C][C]0.0016[/C][C]0.0017[/C][C]0.0199[/C][C]0.5[/C][/ROW]
[ROW][C]53[/C][C]302.1[/C][C]170.3[/C][C]74.9133[/C][C]265.6867[/C][C]0.0034[/C][C]0.0018[/C][C]0.0189[/C][C]0.5[/C][/ROW]
[ROW][C]54[/C][C]298.2[/C][C]170.3[/C][C]73.4789[/C][C]267.1211[/C][C]0.0048[/C][C]0.0038[/C][C]0.0181[/C][C]0.5[/C][/ROW]
[ROW][C]55[/C][C]299.2[/C][C]170.3[/C][C]72.0653[/C][C]268.5347[/C][C]0.0051[/C][C]0.0054[/C][C]0.0163[/C][C]0.5[/C][/ROW]
[ROW][C]56[/C][C]296.2[/C][C]170.3[/C][C]70.6719[/C][C]269.9281[/C][C]0.0066[/C][C]0.0056[/C][C]0.0271[/C][C]0.5[/C][/ROW]
[ROW][C]57[/C][C]299[/C][C]170.3[/C][C]69.2976[/C][C]271.3024[/C][C]0.0063[/C][C]0.0073[/C][C]0.0336[/C][C]0.5[/C][/ROW]
[ROW][C]58[/C][C]300[/C][C]170.3[/C][C]67.9418[/C][C]272.6582[/C][C]0.0065[/C][C]0.0069[/C][C]0.0326[/C][C]0.5[/C][/ROW]
[ROW][C]59[/C][C]299.4[/C][C]170.3[/C][C]66.6038[/C][C]273.9962[/C][C]0.0073[/C][C]0.0071[/C][C]0.0352[/C][C]0.5[/C][/ROW]
[ROW][C]60[/C][C]300.2[/C][C]170.3[/C][C]65.2827[/C][C]275.3173[/C][C]0.0077[/C][C]0.008[/C][C]0.035[/C][C]0.5[/C][/ROW]
[ROW][C]61[/C][C]470.2[/C][C]170.3[/C][C]63.9781[/C][C]276.6219[/C][C]0[/C][C]0.0083[/C][C]0.0138[/C][C]0.5[/C][/ROW]
[ROW][C]62[/C][C]472.1[/C][C]170.3[/C][C]62.6893[/C][C]277.9107[/C][C]0[/C][C]0[/C][C]0.0121[/C][C]0.5[/C][/ROW]
[ROW][C]63[/C][C]484.8[/C][C]170.3[/C][C]61.4158[/C][C]279.1842[/C][C]0[/C][C]0[/C][C]0.0059[/C][C]0.5[/C][/ROW]
[ROW][C]64[/C][C]513.4[/C][C]170.3[/C][C]60.157[/C][C]280.443[/C][C]0[/C][C]0[/C][C]0.0059[/C][C]0.5[/C][/ROW]
[ROW][C]65[/C][C]547.2[/C][C]170.3[/C][C]58.9124[/C][C]281.6876[/C][C]0[/C][C]0[/C][C]0.0102[/C][C]0.5[/C][/ROW]
[ROW][C]66[/C][C]548.1[/C][C]170.3[/C][C]57.6815[/C][C]282.9185[/C][C]0[/C][C]0[/C][C]0.013[/C][C]0.5[/C][/ROW]
[ROW][C]67[/C][C]544.7[/C][C]170.3[/C][C]56.464[/C][C]284.136[/C][C]0[/C][C]0[/C][C]0.0132[/C][C]0.5[/C][/ROW]
[ROW][C]68[/C][C]521.1[/C][C]170.3[/C][C]55.2593[/C][C]285.3407[/C][C]0[/C][C]0[/C][C]0.016[/C][C]0.5[/C][/ROW]
[ROW][C]69[/C][C]459[/C][C]170.3[/C][C]54.0672[/C][C]286.5328[/C][C]0[/C][C]0[/C][C]0.015[/C][C]0.5[/C][/ROW]
[ROW][C]70[/C][C]413.2[/C][C]170.3[/C][C]52.8871[/C][C]287.7129[/C][C]0[/C][C]0[/C][C]0.0152[/C][C]0.5[/C][/ROW]
[/TABLE]
Source: https://freestatistics.org/blog/index.php?pk=33334&T=1

Globally Unique Identifier (entire table): ba.freestatistics.org/blog/index.php?pk=33334&T=1

As an alternative you can also use a QR Code:  

The GUIDs for individual cells are displayed in the table below:

Univariate ARIMA Extrapolation Forecast
timeY[t]F[t]95% LB95% UBp-value(H0: Y[t] = F[t])P(F[t]>Y[t-1])P(F[t]>Y[t-s])P(F[t]>Y[20])
8117.5-------
9120.9-------
10125.1-------
11124.7-------
12128.2-------
13149.7-------
14163.6-------
15173.9-------
16164.5-------
17154.2-------
18147.9-------
19159.3-------
20170.3-------
21170170.3153.6953186.90470.48590.510.5
22174.2170.3146.8174193.78260.37240.510.99990.5
23190.8170.3141.5398199.06020.08120.39520.99910.5
24179.9170.3137.0906203.50940.28550.11320.99350.5
25240.8170.3133.1708207.42921e-040.30620.86160.5
26241.9170.3129.627210.9733e-043e-040.62660.5
27241.1170.3126.3681214.23198e-047e-040.43620.5
28239.6170.3123.3348217.26520.00190.00160.59560.5
29220.8170.3120.4859220.11410.02350.00320.73680.5
30209.3170.3117.7914222.80860.07270.02970.79850.5
31209.9170.3115.2285225.37150.07940.08260.65230.5
32228.3170.3112.7797227.82030.02410.08860.50.5
33242.1170.3110.4309230.16910.00940.02880.50390.5
34226.4170.3108.1709232.42910.03840.01180.4510.5
35231.5170.3105.9903234.60970.03110.04370.26610.5
36229.7170.3103.8812236.71880.03980.03550.38850.5
37257.6170.3101.8371238.76290.00620.04450.02180.5
38260170.399.8523240.74770.00630.00760.02320.5
39264.4170.397.9218242.67820.00540.00760.02760.5
40268.8170.396.0416244.55840.00470.00650.03370.5
41271.4170.394.2078246.39220.00460.00560.09670.5
42273.8170.392.4171248.18290.00460.00550.16320.5
43277.4170.390.6667249.93330.00420.00540.16490.5
44268.2170.388.954251.6460.00920.00490.08110.5
45264.6170.387.2766253.32340.0130.01040.0450.5
46266.6170.385.6324254.96760.01290.01450.0970.5
47266170.384.0195256.58050.01490.01430.08220.5
48267.4170.382.4362258.16380.01520.01640.09260.5
49289.8170.380.881259.7190.00440.01670.02780.5
50294170.379.3524261.24760.00380.0050.02660.5
51310.3170.377.849262.7510.00150.00440.0230.5
52311.7170.376.3697264.23030.00160.00170.01990.5
53302.1170.374.9133265.68670.00340.00180.01890.5
54298.2170.373.4789267.12110.00480.00380.01810.5
55299.2170.372.0653268.53470.00510.00540.01630.5
56296.2170.370.6719269.92810.00660.00560.02710.5
57299170.369.2976271.30240.00630.00730.03360.5
58300170.367.9418272.65820.00650.00690.03260.5
59299.4170.366.6038273.99620.00730.00710.03520.5
60300.2170.365.2827275.31730.00770.0080.0350.5
61470.2170.363.9781276.621900.00830.01380.5
62472.1170.362.6893277.9107000.01210.5
63484.8170.361.4158279.1842000.00590.5
64513.4170.360.157280.443000.00590.5
65547.2170.358.9124281.6876000.01020.5
66548.1170.357.6815282.9185000.0130.5
67544.7170.356.464284.136000.01320.5
68521.1170.355.2593285.3407000.0160.5
69459170.354.0672286.5328000.0150.5
70413.2170.352.8871287.7129000.01520.5


Univariate ARIMA Extrapolation Forecast Performance
time% S.E.PEMAPESq.EMSERMSE
210.0497-0.001800.090.00180.0424
220.07040.02295e-0415.210.30420.5515
230.08620.12040.0024420.258.4052.8991
240.09950.05640.001192.161.84321.3576
250.11120.4140.00834970.2599.4059.9702
260.12190.42040.00845126.56102.531210.1258
270.13160.41570.00835012.64100.252810.0126
280.14070.40690.00814802.4996.04989.8005
290.14920.29650.00592550.2551.0057.1418
300.15730.2290.0046152130.425.5154
310.1650.23250.00471568.1631.36325.6003
320.17230.34060.0068336467.288.2024
330.17940.42160.00845155.24103.104810.1541
340.18610.32940.00663147.2162.94427.9337
350.19270.35940.00723745.4474.90888.655
360.1990.34880.0073528.3670.56728.4004
370.20510.51260.01037621.29152.425812.3461
380.21110.52670.01058046.09160.921812.6855
390.21680.55260.01118854.81177.096213.3077
400.22250.57840.01169702.25194.04513.93
410.2280.59370.011910221.21204.424214.2977
420.23330.60780.012210712.25214.24514.6371
430.23860.62890.012611470.41229.408215.1462
440.24370.57490.01159584.41191.688213.8452
450.24870.55370.01118892.49177.849813.336
460.25370.56550.01139273.69185.473813.6189
470.25850.56190.01129158.49183.169813.534
480.26320.57020.01149428.41188.568213.732
490.26790.70170.01414280.25285.60516.8999
500.27250.72640.014515301.69306.033817.4938
510.2770.82210.01641960039219.799
520.28140.83030.016619993.96399.879219.997
530.28580.77390.015517371.24347.424818.6393
540.29010.7510.01516358.41327.168218.0878
550.29430.75690.015116615.21332.304218.2292
560.29850.73930.014815850.81317.016217.8049
570.30260.75570.015116563.69331.273818.2009
580.30670.76160.015216822.09336.441818.3423
590.31070.75810.015216666.81333.336218.2575
600.31460.76280.015316874.01337.480218.3706
610.31851.7610.035289940.011798.800242.4123
620.32241.77220.035491083.241821.664842.681
630.32621.84670.036998910.251978.20544.477
640.332.01470.0403117717.612354.352248.5217
650.33372.21320.0443142053.612841.072253.3017
660.33742.21840.0444142732.842854.656853.429
670.3412.19850.044140175.362803.507252.9482
680.34472.05990.0412123060.642461.212849.6106
690.34821.69520.033983347.691666.953840.8283
700.35181.42630.028559000.411180.008234.3512

\begin{tabular}{lllllllll}
\hline
Univariate ARIMA Extrapolation Forecast Performance \tabularnewline
time & % S.E. & PE & MAPE & Sq.E & MSE & RMSE \tabularnewline
21 & 0.0497 & -0.0018 & 0 & 0.09 & 0.0018 & 0.0424 \tabularnewline
22 & 0.0704 & 0.0229 & 5e-04 & 15.21 & 0.3042 & 0.5515 \tabularnewline
23 & 0.0862 & 0.1204 & 0.0024 & 420.25 & 8.405 & 2.8991 \tabularnewline
24 & 0.0995 & 0.0564 & 0.0011 & 92.16 & 1.8432 & 1.3576 \tabularnewline
25 & 0.1112 & 0.414 & 0.0083 & 4970.25 & 99.405 & 9.9702 \tabularnewline
26 & 0.1219 & 0.4204 & 0.0084 & 5126.56 & 102.5312 & 10.1258 \tabularnewline
27 & 0.1316 & 0.4157 & 0.0083 & 5012.64 & 100.2528 & 10.0126 \tabularnewline
28 & 0.1407 & 0.4069 & 0.0081 & 4802.49 & 96.0498 & 9.8005 \tabularnewline
29 & 0.1492 & 0.2965 & 0.0059 & 2550.25 & 51.005 & 7.1418 \tabularnewline
30 & 0.1573 & 0.229 & 0.0046 & 1521 & 30.42 & 5.5154 \tabularnewline
31 & 0.165 & 0.2325 & 0.0047 & 1568.16 & 31.3632 & 5.6003 \tabularnewline
32 & 0.1723 & 0.3406 & 0.0068 & 3364 & 67.28 & 8.2024 \tabularnewline
33 & 0.1794 & 0.4216 & 0.0084 & 5155.24 & 103.1048 & 10.1541 \tabularnewline
34 & 0.1861 & 0.3294 & 0.0066 & 3147.21 & 62.9442 & 7.9337 \tabularnewline
35 & 0.1927 & 0.3594 & 0.0072 & 3745.44 & 74.9088 & 8.655 \tabularnewline
36 & 0.199 & 0.3488 & 0.007 & 3528.36 & 70.5672 & 8.4004 \tabularnewline
37 & 0.2051 & 0.5126 & 0.0103 & 7621.29 & 152.4258 & 12.3461 \tabularnewline
38 & 0.2111 & 0.5267 & 0.0105 & 8046.09 & 160.9218 & 12.6855 \tabularnewline
39 & 0.2168 & 0.5526 & 0.0111 & 8854.81 & 177.0962 & 13.3077 \tabularnewline
40 & 0.2225 & 0.5784 & 0.0116 & 9702.25 & 194.045 & 13.93 \tabularnewline
41 & 0.228 & 0.5937 & 0.0119 & 10221.21 & 204.4242 & 14.2977 \tabularnewline
42 & 0.2333 & 0.6078 & 0.0122 & 10712.25 & 214.245 & 14.6371 \tabularnewline
43 & 0.2386 & 0.6289 & 0.0126 & 11470.41 & 229.4082 & 15.1462 \tabularnewline
44 & 0.2437 & 0.5749 & 0.0115 & 9584.41 & 191.6882 & 13.8452 \tabularnewline
45 & 0.2487 & 0.5537 & 0.0111 & 8892.49 & 177.8498 & 13.336 \tabularnewline
46 & 0.2537 & 0.5655 & 0.0113 & 9273.69 & 185.4738 & 13.6189 \tabularnewline
47 & 0.2585 & 0.5619 & 0.0112 & 9158.49 & 183.1698 & 13.534 \tabularnewline
48 & 0.2632 & 0.5702 & 0.0114 & 9428.41 & 188.5682 & 13.732 \tabularnewline
49 & 0.2679 & 0.7017 & 0.014 & 14280.25 & 285.605 & 16.8999 \tabularnewline
50 & 0.2725 & 0.7264 & 0.0145 & 15301.69 & 306.0338 & 17.4938 \tabularnewline
51 & 0.277 & 0.8221 & 0.0164 & 19600 & 392 & 19.799 \tabularnewline
52 & 0.2814 & 0.8303 & 0.0166 & 19993.96 & 399.8792 & 19.997 \tabularnewline
53 & 0.2858 & 0.7739 & 0.0155 & 17371.24 & 347.4248 & 18.6393 \tabularnewline
54 & 0.2901 & 0.751 & 0.015 & 16358.41 & 327.1682 & 18.0878 \tabularnewline
55 & 0.2943 & 0.7569 & 0.0151 & 16615.21 & 332.3042 & 18.2292 \tabularnewline
56 & 0.2985 & 0.7393 & 0.0148 & 15850.81 & 317.0162 & 17.8049 \tabularnewline
57 & 0.3026 & 0.7557 & 0.0151 & 16563.69 & 331.2738 & 18.2009 \tabularnewline
58 & 0.3067 & 0.7616 & 0.0152 & 16822.09 & 336.4418 & 18.3423 \tabularnewline
59 & 0.3107 & 0.7581 & 0.0152 & 16666.81 & 333.3362 & 18.2575 \tabularnewline
60 & 0.3146 & 0.7628 & 0.0153 & 16874.01 & 337.4802 & 18.3706 \tabularnewline
61 & 0.3185 & 1.761 & 0.0352 & 89940.01 & 1798.8002 & 42.4123 \tabularnewline
62 & 0.3224 & 1.7722 & 0.0354 & 91083.24 & 1821.6648 & 42.681 \tabularnewline
63 & 0.3262 & 1.8467 & 0.0369 & 98910.25 & 1978.205 & 44.477 \tabularnewline
64 & 0.33 & 2.0147 & 0.0403 & 117717.61 & 2354.3522 & 48.5217 \tabularnewline
65 & 0.3337 & 2.2132 & 0.0443 & 142053.61 & 2841.0722 & 53.3017 \tabularnewline
66 & 0.3374 & 2.2184 & 0.0444 & 142732.84 & 2854.6568 & 53.429 \tabularnewline
67 & 0.341 & 2.1985 & 0.044 & 140175.36 & 2803.5072 & 52.9482 \tabularnewline
68 & 0.3447 & 2.0599 & 0.0412 & 123060.64 & 2461.2128 & 49.6106 \tabularnewline
69 & 0.3482 & 1.6952 & 0.0339 & 83347.69 & 1666.9538 & 40.8283 \tabularnewline
70 & 0.3518 & 1.4263 & 0.0285 & 59000.41 & 1180.0082 & 34.3512 \tabularnewline
\hline
\end{tabular}
%Source: https://freestatistics.org/blog/index.php?pk=33334&T=2

[TABLE]
[ROW][C]Univariate ARIMA Extrapolation Forecast Performance[/C][/ROW]
[ROW][C]time[/C][C]% S.E.[/C][C]PE[/C][C]MAPE[/C][C]Sq.E[/C][C]MSE[/C][C]RMSE[/C][/ROW]
[ROW][C]21[/C][C]0.0497[/C][C]-0.0018[/C][C]0[/C][C]0.09[/C][C]0.0018[/C][C]0.0424[/C][/ROW]
[ROW][C]22[/C][C]0.0704[/C][C]0.0229[/C][C]5e-04[/C][C]15.21[/C][C]0.3042[/C][C]0.5515[/C][/ROW]
[ROW][C]23[/C][C]0.0862[/C][C]0.1204[/C][C]0.0024[/C][C]420.25[/C][C]8.405[/C][C]2.8991[/C][/ROW]
[ROW][C]24[/C][C]0.0995[/C][C]0.0564[/C][C]0.0011[/C][C]92.16[/C][C]1.8432[/C][C]1.3576[/C][/ROW]
[ROW][C]25[/C][C]0.1112[/C][C]0.414[/C][C]0.0083[/C][C]4970.25[/C][C]99.405[/C][C]9.9702[/C][/ROW]
[ROW][C]26[/C][C]0.1219[/C][C]0.4204[/C][C]0.0084[/C][C]5126.56[/C][C]102.5312[/C][C]10.1258[/C][/ROW]
[ROW][C]27[/C][C]0.1316[/C][C]0.4157[/C][C]0.0083[/C][C]5012.64[/C][C]100.2528[/C][C]10.0126[/C][/ROW]
[ROW][C]28[/C][C]0.1407[/C][C]0.4069[/C][C]0.0081[/C][C]4802.49[/C][C]96.0498[/C][C]9.8005[/C][/ROW]
[ROW][C]29[/C][C]0.1492[/C][C]0.2965[/C][C]0.0059[/C][C]2550.25[/C][C]51.005[/C][C]7.1418[/C][/ROW]
[ROW][C]30[/C][C]0.1573[/C][C]0.229[/C][C]0.0046[/C][C]1521[/C][C]30.42[/C][C]5.5154[/C][/ROW]
[ROW][C]31[/C][C]0.165[/C][C]0.2325[/C][C]0.0047[/C][C]1568.16[/C][C]31.3632[/C][C]5.6003[/C][/ROW]
[ROW][C]32[/C][C]0.1723[/C][C]0.3406[/C][C]0.0068[/C][C]3364[/C][C]67.28[/C][C]8.2024[/C][/ROW]
[ROW][C]33[/C][C]0.1794[/C][C]0.4216[/C][C]0.0084[/C][C]5155.24[/C][C]103.1048[/C][C]10.1541[/C][/ROW]
[ROW][C]34[/C][C]0.1861[/C][C]0.3294[/C][C]0.0066[/C][C]3147.21[/C][C]62.9442[/C][C]7.9337[/C][/ROW]
[ROW][C]35[/C][C]0.1927[/C][C]0.3594[/C][C]0.0072[/C][C]3745.44[/C][C]74.9088[/C][C]8.655[/C][/ROW]
[ROW][C]36[/C][C]0.199[/C][C]0.3488[/C][C]0.007[/C][C]3528.36[/C][C]70.5672[/C][C]8.4004[/C][/ROW]
[ROW][C]37[/C][C]0.2051[/C][C]0.5126[/C][C]0.0103[/C][C]7621.29[/C][C]152.4258[/C][C]12.3461[/C][/ROW]
[ROW][C]38[/C][C]0.2111[/C][C]0.5267[/C][C]0.0105[/C][C]8046.09[/C][C]160.9218[/C][C]12.6855[/C][/ROW]
[ROW][C]39[/C][C]0.2168[/C][C]0.5526[/C][C]0.0111[/C][C]8854.81[/C][C]177.0962[/C][C]13.3077[/C][/ROW]
[ROW][C]40[/C][C]0.2225[/C][C]0.5784[/C][C]0.0116[/C][C]9702.25[/C][C]194.045[/C][C]13.93[/C][/ROW]
[ROW][C]41[/C][C]0.228[/C][C]0.5937[/C][C]0.0119[/C][C]10221.21[/C][C]204.4242[/C][C]14.2977[/C][/ROW]
[ROW][C]42[/C][C]0.2333[/C][C]0.6078[/C][C]0.0122[/C][C]10712.25[/C][C]214.245[/C][C]14.6371[/C][/ROW]
[ROW][C]43[/C][C]0.2386[/C][C]0.6289[/C][C]0.0126[/C][C]11470.41[/C][C]229.4082[/C][C]15.1462[/C][/ROW]
[ROW][C]44[/C][C]0.2437[/C][C]0.5749[/C][C]0.0115[/C][C]9584.41[/C][C]191.6882[/C][C]13.8452[/C][/ROW]
[ROW][C]45[/C][C]0.2487[/C][C]0.5537[/C][C]0.0111[/C][C]8892.49[/C][C]177.8498[/C][C]13.336[/C][/ROW]
[ROW][C]46[/C][C]0.2537[/C][C]0.5655[/C][C]0.0113[/C][C]9273.69[/C][C]185.4738[/C][C]13.6189[/C][/ROW]
[ROW][C]47[/C][C]0.2585[/C][C]0.5619[/C][C]0.0112[/C][C]9158.49[/C][C]183.1698[/C][C]13.534[/C][/ROW]
[ROW][C]48[/C][C]0.2632[/C][C]0.5702[/C][C]0.0114[/C][C]9428.41[/C][C]188.5682[/C][C]13.732[/C][/ROW]
[ROW][C]49[/C][C]0.2679[/C][C]0.7017[/C][C]0.014[/C][C]14280.25[/C][C]285.605[/C][C]16.8999[/C][/ROW]
[ROW][C]50[/C][C]0.2725[/C][C]0.7264[/C][C]0.0145[/C][C]15301.69[/C][C]306.0338[/C][C]17.4938[/C][/ROW]
[ROW][C]51[/C][C]0.277[/C][C]0.8221[/C][C]0.0164[/C][C]19600[/C][C]392[/C][C]19.799[/C][/ROW]
[ROW][C]52[/C][C]0.2814[/C][C]0.8303[/C][C]0.0166[/C][C]19993.96[/C][C]399.8792[/C][C]19.997[/C][/ROW]
[ROW][C]53[/C][C]0.2858[/C][C]0.7739[/C][C]0.0155[/C][C]17371.24[/C][C]347.4248[/C][C]18.6393[/C][/ROW]
[ROW][C]54[/C][C]0.2901[/C][C]0.751[/C][C]0.015[/C][C]16358.41[/C][C]327.1682[/C][C]18.0878[/C][/ROW]
[ROW][C]55[/C][C]0.2943[/C][C]0.7569[/C][C]0.0151[/C][C]16615.21[/C][C]332.3042[/C][C]18.2292[/C][/ROW]
[ROW][C]56[/C][C]0.2985[/C][C]0.7393[/C][C]0.0148[/C][C]15850.81[/C][C]317.0162[/C][C]17.8049[/C][/ROW]
[ROW][C]57[/C][C]0.3026[/C][C]0.7557[/C][C]0.0151[/C][C]16563.69[/C][C]331.2738[/C][C]18.2009[/C][/ROW]
[ROW][C]58[/C][C]0.3067[/C][C]0.7616[/C][C]0.0152[/C][C]16822.09[/C][C]336.4418[/C][C]18.3423[/C][/ROW]
[ROW][C]59[/C][C]0.3107[/C][C]0.7581[/C][C]0.0152[/C][C]16666.81[/C][C]333.3362[/C][C]18.2575[/C][/ROW]
[ROW][C]60[/C][C]0.3146[/C][C]0.7628[/C][C]0.0153[/C][C]16874.01[/C][C]337.4802[/C][C]18.3706[/C][/ROW]
[ROW][C]61[/C][C]0.3185[/C][C]1.761[/C][C]0.0352[/C][C]89940.01[/C][C]1798.8002[/C][C]42.4123[/C][/ROW]
[ROW][C]62[/C][C]0.3224[/C][C]1.7722[/C][C]0.0354[/C][C]91083.24[/C][C]1821.6648[/C][C]42.681[/C][/ROW]
[ROW][C]63[/C][C]0.3262[/C][C]1.8467[/C][C]0.0369[/C][C]98910.25[/C][C]1978.205[/C][C]44.477[/C][/ROW]
[ROW][C]64[/C][C]0.33[/C][C]2.0147[/C][C]0.0403[/C][C]117717.61[/C][C]2354.3522[/C][C]48.5217[/C][/ROW]
[ROW][C]65[/C][C]0.3337[/C][C]2.2132[/C][C]0.0443[/C][C]142053.61[/C][C]2841.0722[/C][C]53.3017[/C][/ROW]
[ROW][C]66[/C][C]0.3374[/C][C]2.2184[/C][C]0.0444[/C][C]142732.84[/C][C]2854.6568[/C][C]53.429[/C][/ROW]
[ROW][C]67[/C][C]0.341[/C][C]2.1985[/C][C]0.044[/C][C]140175.36[/C][C]2803.5072[/C][C]52.9482[/C][/ROW]
[ROW][C]68[/C][C]0.3447[/C][C]2.0599[/C][C]0.0412[/C][C]123060.64[/C][C]2461.2128[/C][C]49.6106[/C][/ROW]
[ROW][C]69[/C][C]0.3482[/C][C]1.6952[/C][C]0.0339[/C][C]83347.69[/C][C]1666.9538[/C][C]40.8283[/C][/ROW]
[ROW][C]70[/C][C]0.3518[/C][C]1.4263[/C][C]0.0285[/C][C]59000.41[/C][C]1180.0082[/C][C]34.3512[/C][/ROW]
[/TABLE]
Source: https://freestatistics.org/blog/index.php?pk=33334&T=2

Globally Unique Identifier (entire table): ba.freestatistics.org/blog/index.php?pk=33334&T=2

As an alternative you can also use a QR Code:  

The GUIDs for individual cells are displayed in the table below:

Univariate ARIMA Extrapolation Forecast Performance
time% S.E.PEMAPESq.EMSERMSE
210.0497-0.001800.090.00180.0424
220.07040.02295e-0415.210.30420.5515
230.08620.12040.0024420.258.4052.8991
240.09950.05640.001192.161.84321.3576
250.11120.4140.00834970.2599.4059.9702
260.12190.42040.00845126.56102.531210.1258
270.13160.41570.00835012.64100.252810.0126
280.14070.40690.00814802.4996.04989.8005
290.14920.29650.00592550.2551.0057.1418
300.15730.2290.0046152130.425.5154
310.1650.23250.00471568.1631.36325.6003
320.17230.34060.0068336467.288.2024
330.17940.42160.00845155.24103.104810.1541
340.18610.32940.00663147.2162.94427.9337
350.19270.35940.00723745.4474.90888.655
360.1990.34880.0073528.3670.56728.4004
370.20510.51260.01037621.29152.425812.3461
380.21110.52670.01058046.09160.921812.6855
390.21680.55260.01118854.81177.096213.3077
400.22250.57840.01169702.25194.04513.93
410.2280.59370.011910221.21204.424214.2977
420.23330.60780.012210712.25214.24514.6371
430.23860.62890.012611470.41229.408215.1462
440.24370.57490.01159584.41191.688213.8452
450.24870.55370.01118892.49177.849813.336
460.25370.56550.01139273.69185.473813.6189
470.25850.56190.01129158.49183.169813.534
480.26320.57020.01149428.41188.568213.732
490.26790.70170.01414280.25285.60516.8999
500.27250.72640.014515301.69306.033817.4938
510.2770.82210.01641960039219.799
520.28140.83030.016619993.96399.879219.997
530.28580.77390.015517371.24347.424818.6393
540.29010.7510.01516358.41327.168218.0878
550.29430.75690.015116615.21332.304218.2292
560.29850.73930.014815850.81317.016217.8049
570.30260.75570.015116563.69331.273818.2009
580.30670.76160.015216822.09336.441818.3423
590.31070.75810.015216666.81333.336218.2575
600.31460.76280.015316874.01337.480218.3706
610.31851.7610.035289940.011798.800242.4123
620.32241.77220.035491083.241821.664842.681
630.32621.84670.036998910.251978.20544.477
640.332.01470.0403117717.612354.352248.5217
650.33372.21320.0443142053.612841.072253.3017
660.33742.21840.0444142732.842854.656853.429
670.3412.19850.044140175.362803.507252.9482
680.34472.05990.0412123060.642461.212849.6106
690.34821.69520.033983347.691666.953840.8283
700.35181.42630.028559000.411180.008234.3512


Parameters (Session):
par1 = 50 ; par2 = 1 ; par3 = 1 ; par4 = 0 ; par5 = 12 ; par6 = 0 ; par7 = 0 ; par8 = 0 ; par9 = 0 ; par10 = FALSE ;
Parameters (R input):
par1 = 50 ; par2 = 1 ; par3 = 1 ; par4 = 0 ; par5 = 12 ; par6 = 0 ; par7 = 0 ; par8 = 0 ; par9 = 0 ; par10 = FALSE ;
R code (references can be found in the software module):
par1 <- as.numeric(par1) #cut off periods
par2 <- as.numeric(par2) #lambda
par3 <- as.numeric(par3) #degree of non-seasonal differencing
par4 <- as.numeric(par4) #degree of seasonal differencing
par5 <- as.numeric(par5) #seasonal period
par6 <- as.numeric(par6) #p
par7 <- as.numeric(par7) #q
par8 <- as.numeric(par8) #P
par9 <- as.numeric(par9) #Q
if (par10 == 'TRUE') par10 <- TRUE
if (par10 == 'FALSE') par10 <- FALSE
if (par2 == 0) x <- log(x)
if (par2 != 0) x <- x^par2
lx <- length(x)
first <- lx - 2*par1
nx <- lx - par1
nx1 <- nx + 1
fx <- lx - nx
if (fx < 1) {
fx <- par5
nx1 <- lx + fx - 1
first <- lx - 2*fx
}
first <- 1
if (fx < 3) fx <- round(lx/10,0)
(arima.out <- arima(x[1:nx], order=c(par6,par3,par7), seasonal=list(order=c(par8,par4,par9), period=par5), include.mean=par10, method='ML'))
(forecast <- predict(arima.out,fx))
(lb <- forecast$pred - 1.96 * forecast$se)
(ub <- forecast$pred + 1.96 * forecast$se)
if (par2 == 0) {
x <- exp(x)
forecast$pred <- exp(forecast$pred)
lb <- exp(lb)
ub <- exp(ub)
}
if (par2 != 0) {
x <- x^(1/par2)
forecast$pred <- forecast$pred^(1/par2)
lb <- lb^(1/par2)
ub <- ub^(1/par2)
}
if (par2 < 0) {
olb <- lb
lb <- ub
ub <- olb
}
(actandfor <- c(x[1:nx], forecast$pred))
(perc.se <- (ub-forecast$pred)/1.96/forecast$pred)
bitmap(file='test1.png')
opar <- par(mar=c(4,4,2,2),las=1)
ylim <- c( min(x[first:nx],lb), max(x[first:nx],ub))
plot(x,ylim=ylim,type='n',xlim=c(first,lx))
usr <- par('usr')
rect(usr[1],usr[3],nx+1,usr[4],border=NA,col='lemonchiffon')
rect(nx1,usr[3],usr[2],usr[4],border=NA,col='lavender')
abline(h= (-3:3)*2 , col ='gray', lty =3)
polygon( c(nx1:lx,lx:nx1), c(lb,rev(ub)), col = 'orange', lty=2,border=NA)
lines(nx1:lx, lb , lty=2)
lines(nx1:lx, ub , lty=2)
lines(x, lwd=2)
lines(nx1:lx, forecast$pred , lwd=2 , col ='white')
box()
par(opar)
dev.off()
prob.dec <- array(NA, dim=fx)
prob.sdec <- array(NA, dim=fx)
prob.ldec <- array(NA, dim=fx)
prob.pval <- array(NA, dim=fx)
perf.pe <- array(0, dim=fx)
perf.mape <- array(0, dim=fx)
perf.se <- array(0, dim=fx)
perf.mse <- array(0, dim=fx)
perf.rmse <- array(0, dim=fx)
for (i in 1:fx) {
locSD <- (ub[i] - forecast$pred[i]) / 1.96
perf.pe[i] = (x[nx+i] - forecast$pred[i]) / forecast$pred[i]
perf.mape[i] = perf.mape[i] + abs(perf.pe[i])
perf.se[i] = (x[nx+i] - forecast$pred[i])^2
perf.mse[i] = perf.mse[i] + perf.se[i]
prob.dec[i] = pnorm((x[nx+i-1] - forecast$pred[i]) / locSD)
prob.sdec[i] = pnorm((x[nx+i-par5] - forecast$pred[i]) / locSD)
prob.ldec[i] = pnorm((x[nx] - forecast$pred[i]) / locSD)
prob.pval[i] = pnorm(abs(x[nx+i] - forecast$pred[i]) / locSD)
}
perf.mape = perf.mape / fx
perf.mse = perf.mse / fx
perf.rmse = sqrt(perf.mse)
bitmap(file='test2.png')
plot(forecast$pred, pch=19, type='b',main='ARIMA Extrapolation Forecast', ylab='Forecast and 95% CI', xlab='time',ylim=c(min(lb),max(ub)))
dum <- forecast$pred
dum[1:12] <- x[(nx+1):lx]
lines(dum, lty=1)
lines(ub,lty=3)
lines(lb,lty=3)
dev.off()
load(file='createtable')
a<-table.start()
a<-table.row.start(a)
a<-table.element(a,'Univariate ARIMA Extrapolation Forecast',9,TRUE)
a<-table.row.end(a)
a<-table.row.start(a)
a<-table.element(a,'time',1,header=TRUE)
a<-table.element(a,'Y[t]',1,header=TRUE)
a<-table.element(a,'F[t]',1,header=TRUE)
a<-table.element(a,'95% LB',1,header=TRUE)
a<-table.element(a,'95% UB',1,header=TRUE)
a<-table.element(a,'p-value
(H0: Y[t] = F[t])',1,header=TRUE)
a<-table.element(a,'P(F[t]>Y[t-1])',1,header=TRUE)
a<-table.element(a,'P(F[t]>Y[t-s])',1,header=TRUE)
mylab <- paste('P(F[t]>Y[',nx,sep='')
mylab <- paste(mylab,'])',sep='')
a<-table.element(a,mylab,1,header=TRUE)
a<-table.row.end(a)
for (i in (nx-par5):nx) {
a<-table.row.start(a)
a<-table.element(a,i,header=TRUE)
a<-table.element(a,x[i])
a<-table.element(a,'-')
a<-table.row.end(a)
}
for (i in 1:fx) {
a<-table.row.start(a)
a<-table.element(a,nx+i,header=TRUE)
a<-table.element(a,round(x[nx+i],4))
a<-table.element(a,round(forecast$pred[i],4))
a<-table.element(a,round(lb[i],4))
a<-table.element(a,round(ub[i],4))
a<-table.element(a,round((1-prob.pval[i]),4))
a<-table.element(a,round((1-prob.dec[i]),4))
a<-table.element(a,round((1-prob.sdec[i]),4))
a<-table.element(a,round((1-prob.ldec[i]),4))
a<-table.row.end(a)
}
a<-table.end(a)
table.save(a,file='mytable.tab')
a<-table.start()
a<-table.row.start(a)
a<-table.element(a,'Univariate ARIMA Extrapolation Forecast Performance',7,TRUE)
a<-table.row.end(a)
a<-table.row.start(a)
a<-table.element(a,'time',1,header=TRUE)
a<-table.element(a,'% S.E.',1,header=TRUE)
a<-table.element(a,'PE',1,header=TRUE)
a<-table.element(a,'MAPE',1,header=TRUE)
a<-table.element(a,'Sq.E',1,header=TRUE)
a<-table.element(a,'MSE',1,header=TRUE)
a<-table.element(a,'RMSE',1,header=TRUE)
a<-table.row.end(a)
for (i in 1:fx) {
a<-table.row.start(a)
a<-table.element(a,nx+i,header=TRUE)
a<-table.element(a,round(perc.se[i],4))
a<-table.element(a,round(perf.pe[i],4))
a<-table.element(a,round(perf.mape[i],4))
a<-table.element(a,round(perf.se[i],4))
a<-table.element(a,round(perf.mse[i],4))
a<-table.element(a,round(perf.rmse[i],4))
a<-table.row.end(a)
}
a<-table.end(a)
table.save(a,file='mytable1.tab')