Free Statistics

of Irreproducible Research!

Author's title

Author*Unverified author*
R Software Modulerwasp_autocorrelation.wasp
Title produced by software(Partial) Autocorrelation Function
Date of computationSun, 14 Dec 2008 05:28:09 -0700
Cite this page as followsStatistical Computations at FreeStatistics.org, Office for Research Development and Education, URL https://freestatistics.org/blog/index.php?v=date/2008/Dec/14/t1229257764ke0j9xx3knuiivr.htm/, Retrieved Wed, 15 May 2024 13:46:22 +0000
Statistical Computations at FreeStatistics.org, Office for Research Development and Education, URL https://freestatistics.org/blog/index.php?pk=33322, Retrieved Wed, 15 May 2024 13:46:22 +0000
QR Codes:

Original text written by user:
IsPrivate?No (this computation is public)
User-defined keywords
Estimated Impact229
Family? (F = Feedback message, R = changed R code, M = changed R Module, P = changed Parameters, D = changed Data)
-     [Univariate Data Series] [data set] [2008-12-01 19:54:57] [b98453cac15ba1066b407e146608df68]
- RMPD  [Spectral Analysis] [Spectral Analysis] [2008-12-13 10:27:34] [74be16979710d4c4e7c6647856088456]
- RMP       [(Partial) Autocorrelation Function] [Duurzame consumpt...] [2008-12-14 12:28:09] [d41d8cd98f00b204e9800998ecf8427e] [Current]
Feedback Forum

Post a new message
Dataseries X:
98.1
101.1
111.1
93.3
100
108
70.4
75.4
105.5
112.3
102.5
93.5
86.7
95.2
103.8
97
95.5
101
67.5
64
106.7
100.6
101.2
93.1
84.2
85.8
91.8
92.4
80.3
79.7
62.5
57.1
100.8
100.7
86.2
83.2
71.7
77.5
89.8
80.3
78.7
93.8
57.6
60.6
91
85.3
77.4
77.3
68.3
69.9
81.7
75.1
69.9
84
54.3
60
89.9
77
85.3
77.6
69.2
75.5
85.7
72.2
79.9
85.3
52.2
61.2
82.4
85.4
78.2
70.2
70.2
69.3
77.5
66.1
69
79.2
56.2
63.3
77.8
92
78.1
65.1
71.1
70.9
72
81.9
70.6
72.5
65.1
54.9
80


Summary of computational transaction
Raw Inputview raw input (R code)
Raw Outputview raw output of R engine
Computing time1 seconds
R Server'George Udny Yule' @ 72.249.76.132

\begin{tabular}{lllllllll}
\hline
Summary of computational transaction \tabularnewline
Raw Input & view raw input (R code)  \tabularnewline
Raw Output & view raw output of R engine  \tabularnewline
Computing time & 1 seconds \tabularnewline
R Server & 'George Udny Yule' @ 72.249.76.132 \tabularnewline
\hline
\end{tabular}
%Source: https://freestatistics.org/blog/index.php?pk=33322&T=0

[TABLE]
[ROW][C]Summary of computational transaction[/C][/ROW]
[ROW][C]Raw Input[/C][C]view raw input (R code) [/C][/ROW]
[ROW][C]Raw Output[/C][C]view raw output of R engine [/C][/ROW]
[ROW][C]Computing time[/C][C]1 seconds[/C][/ROW]
[ROW][C]R Server[/C][C]'George Udny Yule' @ 72.249.76.132[/C][/ROW]
[/TABLE]
Source: https://freestatistics.org/blog/index.php?pk=33322&T=0

Globally Unique Identifier (entire table): ba.freestatistics.org/blog/index.php?pk=33322&T=0

As an alternative you can also use a QR Code:  

The GUIDs for individual cells are displayed in the table below:

Summary of computational transaction
Raw Inputview raw input (R code)
Raw Outputview raw output of R engine
Computing time1 seconds
R Server'George Udny Yule' @ 72.249.76.132


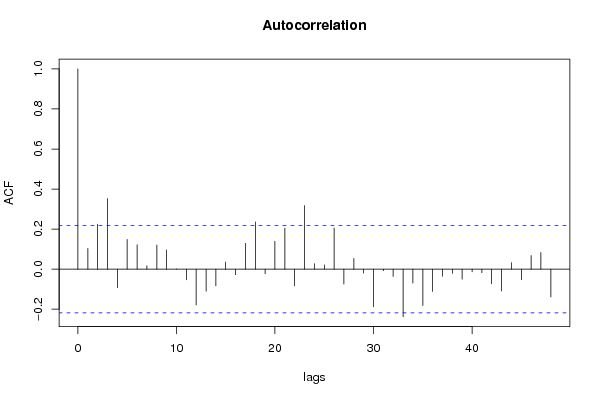
Autocorrelation Function
Time lag kACF(k)T-STATP-value
10.1035670.93210.177026
20.2248212.02340.023165
30.3525673.17310.001066
4-0.092364-0.83130.20413
50.1486251.33760.092382
60.1218581.09670.138007
70.0170020.1530.439384
80.1205241.08470.140632
90.0962110.86590.194551
100.0010190.00920.496352
11-0.053095-0.47790.317021
12-0.178984-1.61090.055551
13-0.110233-0.99210.162052
14-0.082951-0.74660.228745
150.0354330.31890.375314
16-0.027285-0.24560.403321
170.1291681.16250.124221
180.2361272.12510.018311
19-0.022459-0.20210.420159
200.1388321.24950.107543
210.2050311.84530.034326
22-0.083231-0.74910.227989
230.3176672.8590.002701
240.0272130.24490.403568
250.02140.19260.423876
260.2061211.85510.033611
27-0.074477-0.67030.252289
280.053370.48030.316143
29-0.01944-0.1750.430774
30-0.187877-1.69090.047351
31-0.007303-0.06570.473878
32-0.036177-0.32560.372787
33-0.237183-2.13470.017906
34-0.069607-0.62650.266385
35-0.181588-1.63430.053039
36-0.111365-1.00230.159594
37-0.034967-0.31470.376898
38-0.020582-0.18520.426753
39-0.049779-0.4480.327672
40-0.013044-0.11740.45342
41-0.017622-0.15860.43719
42-0.072897-0.65610.256819
43-0.108578-0.97720.16569
440.0322730.29050.386105
45-0.052366-0.47130.319349
460.0681390.61320.270715
470.0827560.74480.229273
48-0.13867-1.2480.107808

\begin{tabular}{lllllllll}
\hline
Autocorrelation Function \tabularnewline
Time lag k & ACF(k) & T-STAT & P-value \tabularnewline
1 & 0.103567 & 0.9321 & 0.177026 \tabularnewline
2 & 0.224821 & 2.0234 & 0.023165 \tabularnewline
3 & 0.352567 & 3.1731 & 0.001066 \tabularnewline
4 & -0.092364 & -0.8313 & 0.20413 \tabularnewline
5 & 0.148625 & 1.3376 & 0.092382 \tabularnewline
6 & 0.121858 & 1.0967 & 0.138007 \tabularnewline
7 & 0.017002 & 0.153 & 0.439384 \tabularnewline
8 & 0.120524 & 1.0847 & 0.140632 \tabularnewline
9 & 0.096211 & 0.8659 & 0.194551 \tabularnewline
10 & 0.001019 & 0.0092 & 0.496352 \tabularnewline
11 & -0.053095 & -0.4779 & 0.317021 \tabularnewline
12 & -0.178984 & -1.6109 & 0.055551 \tabularnewline
13 & -0.110233 & -0.9921 & 0.162052 \tabularnewline
14 & -0.082951 & -0.7466 & 0.228745 \tabularnewline
15 & 0.035433 & 0.3189 & 0.375314 \tabularnewline
16 & -0.027285 & -0.2456 & 0.403321 \tabularnewline
17 & 0.129168 & 1.1625 & 0.124221 \tabularnewline
18 & 0.236127 & 2.1251 & 0.018311 \tabularnewline
19 & -0.022459 & -0.2021 & 0.420159 \tabularnewline
20 & 0.138832 & 1.2495 & 0.107543 \tabularnewline
21 & 0.205031 & 1.8453 & 0.034326 \tabularnewline
22 & -0.083231 & -0.7491 & 0.227989 \tabularnewline
23 & 0.317667 & 2.859 & 0.002701 \tabularnewline
24 & 0.027213 & 0.2449 & 0.403568 \tabularnewline
25 & 0.0214 & 0.1926 & 0.423876 \tabularnewline
26 & 0.206121 & 1.8551 & 0.033611 \tabularnewline
27 & -0.074477 & -0.6703 & 0.252289 \tabularnewline
28 & 0.05337 & 0.4803 & 0.316143 \tabularnewline
29 & -0.01944 & -0.175 & 0.430774 \tabularnewline
30 & -0.187877 & -1.6909 & 0.047351 \tabularnewline
31 & -0.007303 & -0.0657 & 0.473878 \tabularnewline
32 & -0.036177 & -0.3256 & 0.372787 \tabularnewline
33 & -0.237183 & -2.1347 & 0.017906 \tabularnewline
34 & -0.069607 & -0.6265 & 0.266385 \tabularnewline
35 & -0.181588 & -1.6343 & 0.053039 \tabularnewline
36 & -0.111365 & -1.0023 & 0.159594 \tabularnewline
37 & -0.034967 & -0.3147 & 0.376898 \tabularnewline
38 & -0.020582 & -0.1852 & 0.426753 \tabularnewline
39 & -0.049779 & -0.448 & 0.327672 \tabularnewline
40 & -0.013044 & -0.1174 & 0.45342 \tabularnewline
41 & -0.017622 & -0.1586 & 0.43719 \tabularnewline
42 & -0.072897 & -0.6561 & 0.256819 \tabularnewline
43 & -0.108578 & -0.9772 & 0.16569 \tabularnewline
44 & 0.032273 & 0.2905 & 0.386105 \tabularnewline
45 & -0.052366 & -0.4713 & 0.319349 \tabularnewline
46 & 0.068139 & 0.6132 & 0.270715 \tabularnewline
47 & 0.082756 & 0.7448 & 0.229273 \tabularnewline
48 & -0.13867 & -1.248 & 0.107808 \tabularnewline
\hline
\end{tabular}
%Source: https://freestatistics.org/blog/index.php?pk=33322&T=1

[TABLE]
[ROW][C]Autocorrelation Function[/C][/ROW]
[ROW][C]Time lag k[/C][C]ACF(k)[/C][C]T-STAT[/C][C]P-value[/C][/ROW]
[ROW][C]1[/C][C]0.103567[/C][C]0.9321[/C][C]0.177026[/C][/ROW]
[ROW][C]2[/C][C]0.224821[/C][C]2.0234[/C][C]0.023165[/C][/ROW]
[ROW][C]3[/C][C]0.352567[/C][C]3.1731[/C][C]0.001066[/C][/ROW]
[ROW][C]4[/C][C]-0.092364[/C][C]-0.8313[/C][C]0.20413[/C][/ROW]
[ROW][C]5[/C][C]0.148625[/C][C]1.3376[/C][C]0.092382[/C][/ROW]
[ROW][C]6[/C][C]0.121858[/C][C]1.0967[/C][C]0.138007[/C][/ROW]
[ROW][C]7[/C][C]0.017002[/C][C]0.153[/C][C]0.439384[/C][/ROW]
[ROW][C]8[/C][C]0.120524[/C][C]1.0847[/C][C]0.140632[/C][/ROW]
[ROW][C]9[/C][C]0.096211[/C][C]0.8659[/C][C]0.194551[/C][/ROW]
[ROW][C]10[/C][C]0.001019[/C][C]0.0092[/C][C]0.496352[/C][/ROW]
[ROW][C]11[/C][C]-0.053095[/C][C]-0.4779[/C][C]0.317021[/C][/ROW]
[ROW][C]12[/C][C]-0.178984[/C][C]-1.6109[/C][C]0.055551[/C][/ROW]
[ROW][C]13[/C][C]-0.110233[/C][C]-0.9921[/C][C]0.162052[/C][/ROW]
[ROW][C]14[/C][C]-0.082951[/C][C]-0.7466[/C][C]0.228745[/C][/ROW]
[ROW][C]15[/C][C]0.035433[/C][C]0.3189[/C][C]0.375314[/C][/ROW]
[ROW][C]16[/C][C]-0.027285[/C][C]-0.2456[/C][C]0.403321[/C][/ROW]
[ROW][C]17[/C][C]0.129168[/C][C]1.1625[/C][C]0.124221[/C][/ROW]
[ROW][C]18[/C][C]0.236127[/C][C]2.1251[/C][C]0.018311[/C][/ROW]
[ROW][C]19[/C][C]-0.022459[/C][C]-0.2021[/C][C]0.420159[/C][/ROW]
[ROW][C]20[/C][C]0.138832[/C][C]1.2495[/C][C]0.107543[/C][/ROW]
[ROW][C]21[/C][C]0.205031[/C][C]1.8453[/C][C]0.034326[/C][/ROW]
[ROW][C]22[/C][C]-0.083231[/C][C]-0.7491[/C][C]0.227989[/C][/ROW]
[ROW][C]23[/C][C]0.317667[/C][C]2.859[/C][C]0.002701[/C][/ROW]
[ROW][C]24[/C][C]0.027213[/C][C]0.2449[/C][C]0.403568[/C][/ROW]
[ROW][C]25[/C][C]0.0214[/C][C]0.1926[/C][C]0.423876[/C][/ROW]
[ROW][C]26[/C][C]0.206121[/C][C]1.8551[/C][C]0.033611[/C][/ROW]
[ROW][C]27[/C][C]-0.074477[/C][C]-0.6703[/C][C]0.252289[/C][/ROW]
[ROW][C]28[/C][C]0.05337[/C][C]0.4803[/C][C]0.316143[/C][/ROW]
[ROW][C]29[/C][C]-0.01944[/C][C]-0.175[/C][C]0.430774[/C][/ROW]
[ROW][C]30[/C][C]-0.187877[/C][C]-1.6909[/C][C]0.047351[/C][/ROW]
[ROW][C]31[/C][C]-0.007303[/C][C]-0.0657[/C][C]0.473878[/C][/ROW]
[ROW][C]32[/C][C]-0.036177[/C][C]-0.3256[/C][C]0.372787[/C][/ROW]
[ROW][C]33[/C][C]-0.237183[/C][C]-2.1347[/C][C]0.017906[/C][/ROW]
[ROW][C]34[/C][C]-0.069607[/C][C]-0.6265[/C][C]0.266385[/C][/ROW]
[ROW][C]35[/C][C]-0.181588[/C][C]-1.6343[/C][C]0.053039[/C][/ROW]
[ROW][C]36[/C][C]-0.111365[/C][C]-1.0023[/C][C]0.159594[/C][/ROW]
[ROW][C]37[/C][C]-0.034967[/C][C]-0.3147[/C][C]0.376898[/C][/ROW]
[ROW][C]38[/C][C]-0.020582[/C][C]-0.1852[/C][C]0.426753[/C][/ROW]
[ROW][C]39[/C][C]-0.049779[/C][C]-0.448[/C][C]0.327672[/C][/ROW]
[ROW][C]40[/C][C]-0.013044[/C][C]-0.1174[/C][C]0.45342[/C][/ROW]
[ROW][C]41[/C][C]-0.017622[/C][C]-0.1586[/C][C]0.43719[/C][/ROW]
[ROW][C]42[/C][C]-0.072897[/C][C]-0.6561[/C][C]0.256819[/C][/ROW]
[ROW][C]43[/C][C]-0.108578[/C][C]-0.9772[/C][C]0.16569[/C][/ROW]
[ROW][C]44[/C][C]0.032273[/C][C]0.2905[/C][C]0.386105[/C][/ROW]
[ROW][C]45[/C][C]-0.052366[/C][C]-0.4713[/C][C]0.319349[/C][/ROW]
[ROW][C]46[/C][C]0.068139[/C][C]0.6132[/C][C]0.270715[/C][/ROW]
[ROW][C]47[/C][C]0.082756[/C][C]0.7448[/C][C]0.229273[/C][/ROW]
[ROW][C]48[/C][C]-0.13867[/C][C]-1.248[/C][C]0.107808[/C][/ROW]
[/TABLE]
Source: https://freestatistics.org/blog/index.php?pk=33322&T=1

Globally Unique Identifier (entire table): ba.freestatistics.org/blog/index.php?pk=33322&T=1

As an alternative you can also use a QR Code:  

The GUIDs for individual cells are displayed in the table below:

Autocorrelation Function
Time lag kACF(k)T-STATP-value
10.1035670.93210.177026
20.2248212.02340.023165
30.3525673.17310.001066
4-0.092364-0.83130.20413
50.1486251.33760.092382
60.1218581.09670.138007
70.0170020.1530.439384
80.1205241.08470.140632
90.0962110.86590.194551
100.0010190.00920.496352
11-0.053095-0.47790.317021
12-0.178984-1.61090.055551
13-0.110233-0.99210.162052
14-0.082951-0.74660.228745
150.0354330.31890.375314
16-0.027285-0.24560.403321
170.1291681.16250.124221
180.2361272.12510.018311
19-0.022459-0.20210.420159
200.1388321.24950.107543
210.2050311.84530.034326
22-0.083231-0.74910.227989
230.3176672.8590.002701
240.0272130.24490.403568
250.02140.19260.423876
260.2061211.85510.033611
27-0.074477-0.67030.252289
280.053370.48030.316143
29-0.01944-0.1750.430774
30-0.187877-1.69090.047351
31-0.007303-0.06570.473878
32-0.036177-0.32560.372787
33-0.237183-2.13470.017906
34-0.069607-0.62650.266385
35-0.181588-1.63430.053039
36-0.111365-1.00230.159594
37-0.034967-0.31470.376898
38-0.020582-0.18520.426753
39-0.049779-0.4480.327672
40-0.013044-0.11740.45342
41-0.017622-0.15860.43719
42-0.072897-0.65610.256819
43-0.108578-0.97720.16569
440.0322730.29050.386105
45-0.052366-0.47130.319349
460.0681390.61320.270715
470.0827560.74480.229273
48-0.13867-1.2480.107808


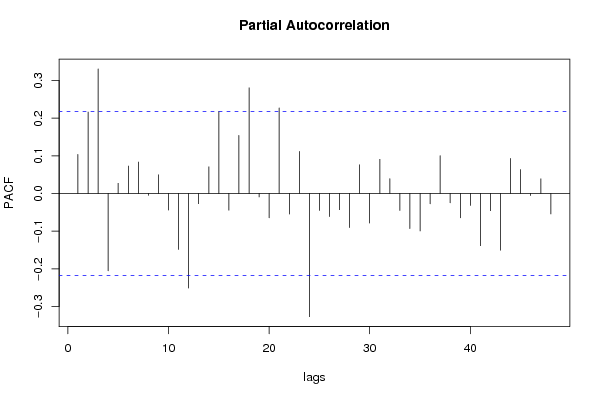
Partial Autocorrelation Function
Time lag kPACF(k)T-STATP-value
10.1035670.93210.177026
20.2164161.94770.027455
30.3307832.9770.001919
4-0.205552-1.850.033983
50.0269710.24270.40441
60.0728290.65550.257015
70.0835620.75210.227099
8-0.004882-0.04390.482532
90.0495920.44630.328276
10-0.04424-0.39820.34578
11-0.148645-1.33780.092352
12-0.251426-2.26280.013162
13-0.027316-0.24580.403212
140.0709810.63880.262368
150.2179661.96170.026617
16-0.044367-0.39930.345361
170.154281.38850.084392
180.2806412.52580.006747
19-0.009053-0.08150.467632
20-0.064554-0.5810.281431
210.2272972.04570.022017
22-0.054744-0.49270.311779
230.1117971.00620.158663
24-0.327221-2.9450.002107
25-0.045043-0.40540.343131
26-0.061346-0.55210.291195
27-0.043111-0.3880.349519
28-0.09061-0.81550.208591
290.0762770.68650.247183
30-0.078557-0.7070.240794
310.0909070.81820.207833
320.0392090.35290.362548
33-0.044972-0.40480.343363
34-0.093307-0.83980.201756
35-0.099662-0.8970.186199
36-0.02746-0.24710.402711
370.1003590.90320.184541
38-0.024974-0.22480.411363
39-0.064786-0.58310.280732
40-0.031677-0.28510.38815
41-0.138715-1.24840.107734
42-0.045872-0.41290.340404
43-0.150556-1.3550.089591
440.0931550.83840.202139
450.0635780.57220.284384
46-0.00548-0.04930.480393
470.0388590.34970.363723
48-0.054342-0.48910.313056

\begin{tabular}{lllllllll}
\hline
Partial Autocorrelation Function \tabularnewline
Time lag k & PACF(k) & T-STAT & P-value \tabularnewline
1 & 0.103567 & 0.9321 & 0.177026 \tabularnewline
2 & 0.216416 & 1.9477 & 0.027455 \tabularnewline
3 & 0.330783 & 2.977 & 0.001919 \tabularnewline
4 & -0.205552 & -1.85 & 0.033983 \tabularnewline
5 & 0.026971 & 0.2427 & 0.40441 \tabularnewline
6 & 0.072829 & 0.6555 & 0.257015 \tabularnewline
7 & 0.083562 & 0.7521 & 0.227099 \tabularnewline
8 & -0.004882 & -0.0439 & 0.482532 \tabularnewline
9 & 0.049592 & 0.4463 & 0.328276 \tabularnewline
10 & -0.04424 & -0.3982 & 0.34578 \tabularnewline
11 & -0.148645 & -1.3378 & 0.092352 \tabularnewline
12 & -0.251426 & -2.2628 & 0.013162 \tabularnewline
13 & -0.027316 & -0.2458 & 0.403212 \tabularnewline
14 & 0.070981 & 0.6388 & 0.262368 \tabularnewline
15 & 0.217966 & 1.9617 & 0.026617 \tabularnewline
16 & -0.044367 & -0.3993 & 0.345361 \tabularnewline
17 & 0.15428 & 1.3885 & 0.084392 \tabularnewline
18 & 0.280641 & 2.5258 & 0.006747 \tabularnewline
19 & -0.009053 & -0.0815 & 0.467632 \tabularnewline
20 & -0.064554 & -0.581 & 0.281431 \tabularnewline
21 & 0.227297 & 2.0457 & 0.022017 \tabularnewline
22 & -0.054744 & -0.4927 & 0.311779 \tabularnewline
23 & 0.111797 & 1.0062 & 0.158663 \tabularnewline
24 & -0.327221 & -2.945 & 0.002107 \tabularnewline
25 & -0.045043 & -0.4054 & 0.343131 \tabularnewline
26 & -0.061346 & -0.5521 & 0.291195 \tabularnewline
27 & -0.043111 & -0.388 & 0.349519 \tabularnewline
28 & -0.09061 & -0.8155 & 0.208591 \tabularnewline
29 & 0.076277 & 0.6865 & 0.247183 \tabularnewline
30 & -0.078557 & -0.707 & 0.240794 \tabularnewline
31 & 0.090907 & 0.8182 & 0.207833 \tabularnewline
32 & 0.039209 & 0.3529 & 0.362548 \tabularnewline
33 & -0.044972 & -0.4048 & 0.343363 \tabularnewline
34 & -0.093307 & -0.8398 & 0.201756 \tabularnewline
35 & -0.099662 & -0.897 & 0.186199 \tabularnewline
36 & -0.02746 & -0.2471 & 0.402711 \tabularnewline
37 & 0.100359 & 0.9032 & 0.184541 \tabularnewline
38 & -0.024974 & -0.2248 & 0.411363 \tabularnewline
39 & -0.064786 & -0.5831 & 0.280732 \tabularnewline
40 & -0.031677 & -0.2851 & 0.38815 \tabularnewline
41 & -0.138715 & -1.2484 & 0.107734 \tabularnewline
42 & -0.045872 & -0.4129 & 0.340404 \tabularnewline
43 & -0.150556 & -1.355 & 0.089591 \tabularnewline
44 & 0.093155 & 0.8384 & 0.202139 \tabularnewline
45 & 0.063578 & 0.5722 & 0.284384 \tabularnewline
46 & -0.00548 & -0.0493 & 0.480393 \tabularnewline
47 & 0.038859 & 0.3497 & 0.363723 \tabularnewline
48 & -0.054342 & -0.4891 & 0.313056 \tabularnewline
\hline
\end{tabular}
%Source: https://freestatistics.org/blog/index.php?pk=33322&T=2

[TABLE]
[ROW][C]Partial Autocorrelation Function[/C][/ROW]
[ROW][C]Time lag k[/C][C]PACF(k)[/C][C]T-STAT[/C][C]P-value[/C][/ROW]
[ROW][C]1[/C][C]0.103567[/C][C]0.9321[/C][C]0.177026[/C][/ROW]
[ROW][C]2[/C][C]0.216416[/C][C]1.9477[/C][C]0.027455[/C][/ROW]
[ROW][C]3[/C][C]0.330783[/C][C]2.977[/C][C]0.001919[/C][/ROW]
[ROW][C]4[/C][C]-0.205552[/C][C]-1.85[/C][C]0.033983[/C][/ROW]
[ROW][C]5[/C][C]0.026971[/C][C]0.2427[/C][C]0.40441[/C][/ROW]
[ROW][C]6[/C][C]0.072829[/C][C]0.6555[/C][C]0.257015[/C][/ROW]
[ROW][C]7[/C][C]0.083562[/C][C]0.7521[/C][C]0.227099[/C][/ROW]
[ROW][C]8[/C][C]-0.004882[/C][C]-0.0439[/C][C]0.482532[/C][/ROW]
[ROW][C]9[/C][C]0.049592[/C][C]0.4463[/C][C]0.328276[/C][/ROW]
[ROW][C]10[/C][C]-0.04424[/C][C]-0.3982[/C][C]0.34578[/C][/ROW]
[ROW][C]11[/C][C]-0.148645[/C][C]-1.3378[/C][C]0.092352[/C][/ROW]
[ROW][C]12[/C][C]-0.251426[/C][C]-2.2628[/C][C]0.013162[/C][/ROW]
[ROW][C]13[/C][C]-0.027316[/C][C]-0.2458[/C][C]0.403212[/C][/ROW]
[ROW][C]14[/C][C]0.070981[/C][C]0.6388[/C][C]0.262368[/C][/ROW]
[ROW][C]15[/C][C]0.217966[/C][C]1.9617[/C][C]0.026617[/C][/ROW]
[ROW][C]16[/C][C]-0.044367[/C][C]-0.3993[/C][C]0.345361[/C][/ROW]
[ROW][C]17[/C][C]0.15428[/C][C]1.3885[/C][C]0.084392[/C][/ROW]
[ROW][C]18[/C][C]0.280641[/C][C]2.5258[/C][C]0.006747[/C][/ROW]
[ROW][C]19[/C][C]-0.009053[/C][C]-0.0815[/C][C]0.467632[/C][/ROW]
[ROW][C]20[/C][C]-0.064554[/C][C]-0.581[/C][C]0.281431[/C][/ROW]
[ROW][C]21[/C][C]0.227297[/C][C]2.0457[/C][C]0.022017[/C][/ROW]
[ROW][C]22[/C][C]-0.054744[/C][C]-0.4927[/C][C]0.311779[/C][/ROW]
[ROW][C]23[/C][C]0.111797[/C][C]1.0062[/C][C]0.158663[/C][/ROW]
[ROW][C]24[/C][C]-0.327221[/C][C]-2.945[/C][C]0.002107[/C][/ROW]
[ROW][C]25[/C][C]-0.045043[/C][C]-0.4054[/C][C]0.343131[/C][/ROW]
[ROW][C]26[/C][C]-0.061346[/C][C]-0.5521[/C][C]0.291195[/C][/ROW]
[ROW][C]27[/C][C]-0.043111[/C][C]-0.388[/C][C]0.349519[/C][/ROW]
[ROW][C]28[/C][C]-0.09061[/C][C]-0.8155[/C][C]0.208591[/C][/ROW]
[ROW][C]29[/C][C]0.076277[/C][C]0.6865[/C][C]0.247183[/C][/ROW]
[ROW][C]30[/C][C]-0.078557[/C][C]-0.707[/C][C]0.240794[/C][/ROW]
[ROW][C]31[/C][C]0.090907[/C][C]0.8182[/C][C]0.207833[/C][/ROW]
[ROW][C]32[/C][C]0.039209[/C][C]0.3529[/C][C]0.362548[/C][/ROW]
[ROW][C]33[/C][C]-0.044972[/C][C]-0.4048[/C][C]0.343363[/C][/ROW]
[ROW][C]34[/C][C]-0.093307[/C][C]-0.8398[/C][C]0.201756[/C][/ROW]
[ROW][C]35[/C][C]-0.099662[/C][C]-0.897[/C][C]0.186199[/C][/ROW]
[ROW][C]36[/C][C]-0.02746[/C][C]-0.2471[/C][C]0.402711[/C][/ROW]
[ROW][C]37[/C][C]0.100359[/C][C]0.9032[/C][C]0.184541[/C][/ROW]
[ROW][C]38[/C][C]-0.024974[/C][C]-0.2248[/C][C]0.411363[/C][/ROW]
[ROW][C]39[/C][C]-0.064786[/C][C]-0.5831[/C][C]0.280732[/C][/ROW]
[ROW][C]40[/C][C]-0.031677[/C][C]-0.2851[/C][C]0.38815[/C][/ROW]
[ROW][C]41[/C][C]-0.138715[/C][C]-1.2484[/C][C]0.107734[/C][/ROW]
[ROW][C]42[/C][C]-0.045872[/C][C]-0.4129[/C][C]0.340404[/C][/ROW]
[ROW][C]43[/C][C]-0.150556[/C][C]-1.355[/C][C]0.089591[/C][/ROW]
[ROW][C]44[/C][C]0.093155[/C][C]0.8384[/C][C]0.202139[/C][/ROW]
[ROW][C]45[/C][C]0.063578[/C][C]0.5722[/C][C]0.284384[/C][/ROW]
[ROW][C]46[/C][C]-0.00548[/C][C]-0.0493[/C][C]0.480393[/C][/ROW]
[ROW][C]47[/C][C]0.038859[/C][C]0.3497[/C][C]0.363723[/C][/ROW]
[ROW][C]48[/C][C]-0.054342[/C][C]-0.4891[/C][C]0.313056[/C][/ROW]
[/TABLE]
Source: https://freestatistics.org/blog/index.php?pk=33322&T=2

Globally Unique Identifier (entire table): ba.freestatistics.org/blog/index.php?pk=33322&T=2

As an alternative you can also use a QR Code:  

The GUIDs for individual cells are displayed in the table below:

Partial Autocorrelation Function
Time lag kPACF(k)T-STATP-value
10.1035670.93210.177026
20.2164161.94770.027455
30.3307832.9770.001919
4-0.205552-1.850.033983
50.0269710.24270.40441
60.0728290.65550.257015
70.0835620.75210.227099
8-0.004882-0.04390.482532
90.0495920.44630.328276
10-0.04424-0.39820.34578
11-0.148645-1.33780.092352
12-0.251426-2.26280.013162
13-0.027316-0.24580.403212
140.0709810.63880.262368
150.2179661.96170.026617
16-0.044367-0.39930.345361
170.154281.38850.084392
180.2806412.52580.006747
19-0.009053-0.08150.467632
20-0.064554-0.5810.281431
210.2272972.04570.022017
22-0.054744-0.49270.311779
230.1117971.00620.158663
24-0.327221-2.9450.002107
25-0.045043-0.40540.343131
26-0.061346-0.55210.291195
27-0.043111-0.3880.349519
28-0.09061-0.81550.208591
290.0762770.68650.247183
30-0.078557-0.7070.240794
310.0909070.81820.207833
320.0392090.35290.362548
33-0.044972-0.40480.343363
34-0.093307-0.83980.201756
35-0.099662-0.8970.186199
36-0.02746-0.24710.402711
370.1003590.90320.184541
38-0.024974-0.22480.411363
39-0.064786-0.58310.280732
40-0.031677-0.28510.38815
41-0.138715-1.24840.107734
42-0.045872-0.41290.340404
43-0.150556-1.3550.089591
440.0931550.83840.202139
450.0635780.57220.284384
46-0.00548-0.04930.480393
470.0388590.34970.363723
48-0.054342-0.48910.313056


Parameters (Session):
par1 = 48 ; par2 = 0.0 ; par3 = 0 ; par4 = 1 ; par5 = 12 ;
Parameters (R input):
par1 = 48 ; par2 = 0.0 ; par3 = 0 ; par4 = 1 ; par5 = 12 ;
R code (references can be found in the software module):
if (par1 == 'Default') {
par1 = 10*log10(length(x))
} else {
par1 <- as.numeric(par1)
}
par2 <- as.numeric(par2)
par3 <- as.numeric(par3)
par4 <- as.numeric(par4)
par5 <- as.numeric(par5)
if (par2 == 0) {
x <- log(x)
} else {
x <- (x ^ par2 - 1) / par2
}
if (par3 > 0) x <- diff(x,lag=1,difference=par3)
if (par4 > 0) x <- diff(x,lag=par5,difference=par4)
bitmap(file='pic1.png')
racf <- acf(x,par1,main='Autocorrelation',xlab='lags',ylab='ACF')
dev.off()
bitmap(file='pic2.png')
rpacf <- pacf(x,par1,main='Partial Autocorrelation',xlab='lags',ylab='PACF')
dev.off()
(myacf <- c(racf$acf))
(mypacf <- c(rpacf$acf))
lengthx <- length(x)
sqrtn <- sqrt(lengthx)
load(file='createtable')
a<-table.start()
a<-table.row.start(a)
a<-table.element(a,'Autocorrelation Function',4,TRUE)
a<-table.row.end(a)
a<-table.row.start(a)
a<-table.element(a,'Time lag k',header=TRUE)
a<-table.element(a,hyperlink('basics.htm','ACF(k)','click here for more information about the Autocorrelation Function'),header=TRUE)
a<-table.element(a,'T-STAT',header=TRUE)
a<-table.element(a,'P-value',header=TRUE)
a<-table.row.end(a)
for (i in 2:(par1+1)) {
a<-table.row.start(a)
a<-table.element(a,i-1,header=TRUE)
a<-table.element(a,round(myacf[i],6))
mytstat <- myacf[i]*sqrtn
a<-table.element(a,round(mytstat,4))
a<-table.element(a,round(1-pt(abs(mytstat),lengthx),6))
a<-table.row.end(a)
}
a<-table.end(a)
table.save(a,file='mytable.tab')
a<-table.start()
a<-table.row.start(a)
a<-table.element(a,'Partial Autocorrelation Function',4,TRUE)
a<-table.row.end(a)
a<-table.row.start(a)
a<-table.element(a,'Time lag k',header=TRUE)
a<-table.element(a,hyperlink('basics.htm','PACF(k)','click here for more information about the Partial Autocorrelation Function'),header=TRUE)
a<-table.element(a,'T-STAT',header=TRUE)
a<-table.element(a,'P-value',header=TRUE)
a<-table.row.end(a)
for (i in 1:par1) {
a<-table.row.start(a)
a<-table.element(a,i,header=TRUE)
a<-table.element(a,round(mypacf[i],6))
mytstat <- mypacf[i]*sqrtn
a<-table.element(a,round(mytstat,4))
a<-table.element(a,round(1-pt(abs(mytstat),lengthx),6))
a<-table.row.end(a)
}
a<-table.end(a)
table.save(a,file='mytable1.tab')