Free Statistics

of Irreproducible Research!

Author's title

Author*Unverified author*
R Software Modulerwasp_arimaforecasting.wasp
Title produced by softwareARIMA Forecasting
Date of computationSun, 14 Dec 2008 04:12:20 -0700
Cite this page as followsStatistical Computations at FreeStatistics.org, Office for Research Development and Education, URL https://freestatistics.org/blog/index.php?v=date/2008/Dec/14/t1229254287gojlvmev9nlykj3.htm/, Retrieved Wed, 15 May 2024 03:40:23 +0000
Statistical Computations at FreeStatistics.org, Office for Research Development and Education, URL https://freestatistics.org/blog/index.php?pk=33301, Retrieved Wed, 15 May 2024 03:40:23 +0000
QR Codes:

Original text written by user:
IsPrivate?No (this computation is public)
User-defined keywords
Estimated Impact157
Family? (F = Feedback message, R = changed R code, M = changed R Module, P = changed Parameters, D = changed Data)
F       [ARIMA Forecasting] [ARIMA Forecasting] [2008-12-14 11:12:20] [44fbdf1868a3b8f737edae4578b93508] [Current]
F   PD    [ARIMA Forecasting] [Step 1] [2008-12-16 22:06:35] [bd6e9fd01b4fddda83ee6fb85abada8c]
Feedback Forum
2008-12-18 11:54:57 [Loïque Verhasselt] [reply
Step1: We vinden de nodige output met een juiste interpretatie van de gegevens in de tabellen. Aanvulling:P(F[t]>Y[48]) = de kans dat de voorspelde waarde groter is dan de laatst gekende werkelijke waarde. We zien duidelijk geen explosiviteit in de voorspelde reeks, zoals de student ook concludeert.
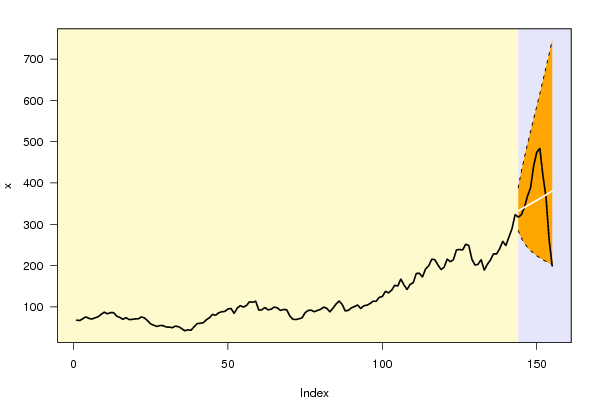
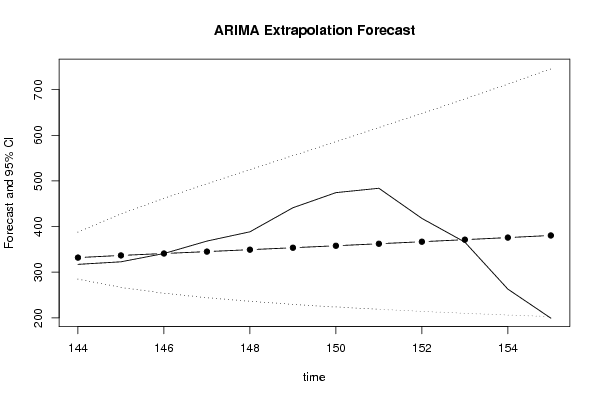
Step 2: De eerste grafiek geeft een voorstelling van de werkelijke waarde waar de laatste 12 maanden worden afgeknipt van de tijdreeks en voor deze maanden een voorspelling wordt gegeven. Het is dus geen voorspelling naar de toekomst toe. We zien duidelijk en zoals de student zegt dat er geen seizoenseffecten te zien zijn maar er is wel 1 maal niet seizoenaal gedifferentieerd. Er was dus een trend te vinden in de oorspronkelijke tijdreeks die zich nu ook voordoet in de voorspelde waarden. We zien een langzaam stijgende trend in de voorspelde waarden maar niet extreem.
Step 3: Deze tabel bevat de procentuele standaardfout (%S.E.)berekent op basis van het model. Dit is de theoretische schatting van de gemaakte fout. Ook zien we de werkelijke fout door de voorspelde en de werkelijke waarde met elkaar te vergelijken.(=PE) De rest van de kolommen is niet belangrijk voor dit onderdeel. We kunnen besluiten dat de voorspelde fout (SE) steeds groter moet zijn dan de werkelijke fout(PE) in absolute waarde. Dit is ook te zien in de tabel van de student wat dus een goede voorspelling geeft! We zien ook zoals de student zegt een zeer grote afwijking in % van de voorsplede waarde. Dit heeft duidelijk te maken met de markt van het product, zeer goede conclusie van de student!
Step 4: Het was hier de bedoeling om de gevonden waarden van de waarschijnlijkheden uit tabel weer te geven in tekstvorm.We zien duidelijk dat alle p-waarden van de nulhypothese groter zijn dan 0,05, wat wil zeggen dat er geen significant verschil is in de voorspelde en werkelijke waarde. We zien dat de kans dat de voorspelde waarde groter is dan de werkelijke waarde 1 maand geleden zeer groot is, dus een kans op stijging. Hetzelfde voor de stijging tegenover de maand vorig jaar en tegenover de laatste gekende werkelijke waarde.
Step 5: De student geeft een goede interpretatie van de economische waarde van de goederen die worden besproken in de tijdreeks, we hebben hier duidelijk te maken met fast moving consumer goods die duidelijk mee evolueren met de economische activiteit. We zien echter dat de voorspelde waarden een licht stijgend trend hebben en dat de werkelijke waarden eerste stijgen en dan fel dalen. Deze trend is helemaal niet op te merken uit de voorspelde waarden. We zien dus een grote afwijking zelfs tot 49%. Maar dit is normaal in deze sector.

Post a new message
Dataseries X:
67.8
66.9
71.5
75.9
71.9
70.7
73.5
76.1
82.5
87.1
83.2
86.1
85.9
77.4
74.4
69.9
73.8
69.2
69.7
71
71.2
75.8
73
66.4
58.6
55.5
52.6
54.9
54.6
51.2
50.9
49.6
53.4
52
47.5
42.1
44.5
43.2
51.4
59.4
60.3
61.4
68.8
73.6
81.8
79.6
85.8
88.1
89.1
95
96.2
84.2
96.9
103.1
99.3
103.5
112.4
111.1
113.7
92
93
98.4
92.6
94.6
99.5
97.6
91.3
93.6
93.1
78.4
70.2
69.3
71.1
73.5
85.9
91.5
91.8
88.3
91.3
94
99.3
96.7
88
96.7
106.8
114.3
105.7
90.1
91.6
97.7
100.8
104.6
95.9
102.7
104
107.9
113.8
113.8
123.1
125.1
137.6
134
140.3
152.1
150.6
167.3
153.2
142
154.4
158.5
180.9
181.3
172.4
192
199.3
215.4
214.3
201.5
190.5
196
215.7
209.4
214.1
237.8
239
237.8
251.5
248.8
215.4
201.2
203.1
214.2
188.9
203
213.3
228.5
228.2
240.9
258.8
248.5
269.2
289.6
323.4
317.2
322.8
340.9
368.2
388.5
441.2
474.3
483.9
417.9
365.9
263
199.4


Summary of computational transaction
Raw Inputview raw input (R code)
Raw Outputview raw output of R engine
Computing time2 seconds
R Server'Sir Ronald Aylmer Fisher' @ 193.190.124.24

\begin{tabular}{lllllllll}
\hline
Summary of computational transaction \tabularnewline
Raw Input & view raw input (R code)  \tabularnewline
Raw Output & view raw output of R engine  \tabularnewline
Computing time & 2 seconds \tabularnewline
R Server & 'Sir Ronald Aylmer Fisher' @ 193.190.124.24 \tabularnewline
\hline
\end{tabular}
%Source: https://freestatistics.org/blog/index.php?pk=33301&T=0

[TABLE]
[ROW][C]Summary of computational transaction[/C][/ROW]
[ROW][C]Raw Input[/C][C]view raw input (R code) [/C][/ROW]
[ROW][C]Raw Output[/C][C]view raw output of R engine [/C][/ROW]
[ROW][C]Computing time[/C][C]2 seconds[/C][/ROW]
[ROW][C]R Server[/C][C]'Sir Ronald Aylmer Fisher' @ 193.190.124.24[/C][/ROW]
[/TABLE]
Source: https://freestatistics.org/blog/index.php?pk=33301&T=0

Globally Unique Identifier (entire table): ba.freestatistics.org/blog/index.php?pk=33301&T=0

As an alternative you can also use a QR Code:  

The GUIDs for individual cells are displayed in the table below:

Summary of computational transaction
Raw Inputview raw input (R code)
Raw Outputview raw output of R engine
Computing time2 seconds
R Server'Sir Ronald Aylmer Fisher' @ 193.190.124.24


Univariate ARIMA Extrapolation Forecast
timeY[t]F[t]95% LB95% UBp-value(H0: Y[t] = F[t])P(F[t]>Y[t-1])P(F[t]>Y[t-s])P(F[t]>Y[143])
131203.1-------
132214.200000000000-------
133188.9-------
134203-------
135213.3-------
136228.5-------
137228.2-------
138240.9-------
139258.8-------
140248.5-------
141269.2-------
142289.6-------
143323.4-------
144317.2332.0367284.7941388.04320.30180.618810.6188
145322.8336.7699266.656427.69930.38170.66340.99930.6134
146340.9340.973253.9572461.91740.49950.61580.98730.6121
147368.2345.1455244.2295493.84180.38060.52230.95890.6128
148388.5349.3614236.3222524.75040.33090.41660.91160.6141
149441.2353.6321229.6419555.28260.19730.36730.88860.6156
150474.3357.96223.8484585.8140.15850.2370.8430.6169
151483.9362.3463218.7286616.59270.17440.19410.78760.618
152417.9366.7917214.1395647.79770.36070.2070.79530.6189
153365.9371.2972209.9799679.56760.48630.38350.74190.6196
154263375.8636206.1758712.01580.25520.52320.69250.6202
155199.4380.4919202.6707745.23920.16520.73610.62050.6205

\begin{tabular}{lllllllll}
\hline
Univariate ARIMA Extrapolation Forecast \tabularnewline
time & Y[t] & F[t] & 95% LB & 95% UB & p-value(H0: Y[t] = F[t]) & P(F[t]>Y[t-1]) & P(F[t]>Y[t-s]) & P(F[t]>Y[143]) \tabularnewline
131 & 203.1 & - & - & - & - & - & - & - \tabularnewline
132 & 214.200000000000 & - & - & - & - & - & - & - \tabularnewline
133 & 188.9 & - & - & - & - & - & - & - \tabularnewline
134 & 203 & - & - & - & - & - & - & - \tabularnewline
135 & 213.3 & - & - & - & - & - & - & - \tabularnewline
136 & 228.5 & - & - & - & - & - & - & - \tabularnewline
137 & 228.2 & - & - & - & - & - & - & - \tabularnewline
138 & 240.9 & - & - & - & - & - & - & - \tabularnewline
139 & 258.8 & - & - & - & - & - & - & - \tabularnewline
140 & 248.5 & - & - & - & - & - & - & - \tabularnewline
141 & 269.2 & - & - & - & - & - & - & - \tabularnewline
142 & 289.6 & - & - & - & - & - & - & - \tabularnewline
143 & 323.4 & - & - & - & - & - & - & - \tabularnewline
144 & 317.2 & 332.0367 & 284.7941 & 388.0432 & 0.3018 & 0.6188 & 1 & 0.6188 \tabularnewline
145 & 322.8 & 336.7699 & 266.656 & 427.6993 & 0.3817 & 0.6634 & 0.9993 & 0.6134 \tabularnewline
146 & 340.9 & 340.973 & 253.9572 & 461.9174 & 0.4995 & 0.6158 & 0.9873 & 0.6121 \tabularnewline
147 & 368.2 & 345.1455 & 244.2295 & 493.8418 & 0.3806 & 0.5223 & 0.9589 & 0.6128 \tabularnewline
148 & 388.5 & 349.3614 & 236.3222 & 524.7504 & 0.3309 & 0.4166 & 0.9116 & 0.6141 \tabularnewline
149 & 441.2 & 353.6321 & 229.6419 & 555.2826 & 0.1973 & 0.3673 & 0.8886 & 0.6156 \tabularnewline
150 & 474.3 & 357.96 & 223.8484 & 585.814 & 0.1585 & 0.237 & 0.843 & 0.6169 \tabularnewline
151 & 483.9 & 362.3463 & 218.7286 & 616.5927 & 0.1744 & 0.1941 & 0.7876 & 0.618 \tabularnewline
152 & 417.9 & 366.7917 & 214.1395 & 647.7977 & 0.3607 & 0.207 & 0.7953 & 0.6189 \tabularnewline
153 & 365.9 & 371.2972 & 209.9799 & 679.5676 & 0.4863 & 0.3835 & 0.7419 & 0.6196 \tabularnewline
154 & 263 & 375.8636 & 206.1758 & 712.0158 & 0.2552 & 0.5232 & 0.6925 & 0.6202 \tabularnewline
155 & 199.4 & 380.4919 & 202.6707 & 745.2392 & 0.1652 & 0.7361 & 0.6205 & 0.6205 \tabularnewline
\hline
\end{tabular}
%Source: https://freestatistics.org/blog/index.php?pk=33301&T=1

[TABLE]
[ROW][C]Univariate ARIMA Extrapolation Forecast[/C][/ROW]
[ROW][C]time[/C][C]Y[t][/C][C]F[t][/C][C]95% LB[/C][C]95% UB[/C][C]p-value(H0: Y[t] = F[t])[/C][C]P(F[t]>Y[t-1])[/C][C]P(F[t]>Y[t-s])[/C][C]P(F[t]>Y[143])[/C][/ROW]
[ROW][C]131[/C][C]203.1[/C][C]-[/C][C]-[/C][C]-[/C][C]-[/C][C]-[/C][C]-[/C][C]-[/C][/ROW]
[ROW][C]132[/C][C]214.200000000000[/C][C]-[/C][C]-[/C][C]-[/C][C]-[/C][C]-[/C][C]-[/C][C]-[/C][/ROW]
[ROW][C]133[/C][C]188.9[/C][C]-[/C][C]-[/C][C]-[/C][C]-[/C][C]-[/C][C]-[/C][C]-[/C][/ROW]
[ROW][C]134[/C][C]203[/C][C]-[/C][C]-[/C][C]-[/C][C]-[/C][C]-[/C][C]-[/C][C]-[/C][/ROW]
[ROW][C]135[/C][C]213.3[/C][C]-[/C][C]-[/C][C]-[/C][C]-[/C][C]-[/C][C]-[/C][C]-[/C][/ROW]
[ROW][C]136[/C][C]228.5[/C][C]-[/C][C]-[/C][C]-[/C][C]-[/C][C]-[/C][C]-[/C][C]-[/C][/ROW]
[ROW][C]137[/C][C]228.2[/C][C]-[/C][C]-[/C][C]-[/C][C]-[/C][C]-[/C][C]-[/C][C]-[/C][/ROW]
[ROW][C]138[/C][C]240.9[/C][C]-[/C][C]-[/C][C]-[/C][C]-[/C][C]-[/C][C]-[/C][C]-[/C][/ROW]
[ROW][C]139[/C][C]258.8[/C][C]-[/C][C]-[/C][C]-[/C][C]-[/C][C]-[/C][C]-[/C][C]-[/C][/ROW]
[ROW][C]140[/C][C]248.5[/C][C]-[/C][C]-[/C][C]-[/C][C]-[/C][C]-[/C][C]-[/C][C]-[/C][/ROW]
[ROW][C]141[/C][C]269.2[/C][C]-[/C][C]-[/C][C]-[/C][C]-[/C][C]-[/C][C]-[/C][C]-[/C][/ROW]
[ROW][C]142[/C][C]289.6[/C][C]-[/C][C]-[/C][C]-[/C][C]-[/C][C]-[/C][C]-[/C][C]-[/C][/ROW]
[ROW][C]143[/C][C]323.4[/C][C]-[/C][C]-[/C][C]-[/C][C]-[/C][C]-[/C][C]-[/C][C]-[/C][/ROW]
[ROW][C]144[/C][C]317.2[/C][C]332.0367[/C][C]284.7941[/C][C]388.0432[/C][C]0.3018[/C][C]0.6188[/C][C]1[/C][C]0.6188[/C][/ROW]
[ROW][C]145[/C][C]322.8[/C][C]336.7699[/C][C]266.656[/C][C]427.6993[/C][C]0.3817[/C][C]0.6634[/C][C]0.9993[/C][C]0.6134[/C][/ROW]
[ROW][C]146[/C][C]340.9[/C][C]340.973[/C][C]253.9572[/C][C]461.9174[/C][C]0.4995[/C][C]0.6158[/C][C]0.9873[/C][C]0.6121[/C][/ROW]
[ROW][C]147[/C][C]368.2[/C][C]345.1455[/C][C]244.2295[/C][C]493.8418[/C][C]0.3806[/C][C]0.5223[/C][C]0.9589[/C][C]0.6128[/C][/ROW]
[ROW][C]148[/C][C]388.5[/C][C]349.3614[/C][C]236.3222[/C][C]524.7504[/C][C]0.3309[/C][C]0.4166[/C][C]0.9116[/C][C]0.6141[/C][/ROW]
[ROW][C]149[/C][C]441.2[/C][C]353.6321[/C][C]229.6419[/C][C]555.2826[/C][C]0.1973[/C][C]0.3673[/C][C]0.8886[/C][C]0.6156[/C][/ROW]
[ROW][C]150[/C][C]474.3[/C][C]357.96[/C][C]223.8484[/C][C]585.814[/C][C]0.1585[/C][C]0.237[/C][C]0.843[/C][C]0.6169[/C][/ROW]
[ROW][C]151[/C][C]483.9[/C][C]362.3463[/C][C]218.7286[/C][C]616.5927[/C][C]0.1744[/C][C]0.1941[/C][C]0.7876[/C][C]0.618[/C][/ROW]
[ROW][C]152[/C][C]417.9[/C][C]366.7917[/C][C]214.1395[/C][C]647.7977[/C][C]0.3607[/C][C]0.207[/C][C]0.7953[/C][C]0.6189[/C][/ROW]
[ROW][C]153[/C][C]365.9[/C][C]371.2972[/C][C]209.9799[/C][C]679.5676[/C][C]0.4863[/C][C]0.3835[/C][C]0.7419[/C][C]0.6196[/C][/ROW]
[ROW][C]154[/C][C]263[/C][C]375.8636[/C][C]206.1758[/C][C]712.0158[/C][C]0.2552[/C][C]0.5232[/C][C]0.6925[/C][C]0.6202[/C][/ROW]
[ROW][C]155[/C][C]199.4[/C][C]380.4919[/C][C]202.6707[/C][C]745.2392[/C][C]0.1652[/C][C]0.7361[/C][C]0.6205[/C][C]0.6205[/C][/ROW]
[/TABLE]
Source: https://freestatistics.org/blog/index.php?pk=33301&T=1

Globally Unique Identifier (entire table): ba.freestatistics.org/blog/index.php?pk=33301&T=1

As an alternative you can also use a QR Code:  

The GUIDs for individual cells are displayed in the table below:

Univariate ARIMA Extrapolation Forecast
timeY[t]F[t]95% LB95% UBp-value(H0: Y[t] = F[t])P(F[t]>Y[t-1])P(F[t]>Y[t-s])P(F[t]>Y[143])
131203.1-------
132214.200000000000-------
133188.9-------
134203-------
135213.3-------
136228.5-------
137228.2-------
138240.9-------
139258.8-------
140248.5-------
141269.2-------
142289.6-------
143323.4-------
144317.2332.0367284.7941388.04320.30180.618810.6188
145322.8336.7699266.656427.69930.38170.66340.99930.6134
146340.9340.973253.9572461.91740.49950.61580.98730.6121
147368.2345.1455244.2295493.84180.38060.52230.95890.6128
148388.5349.3614236.3222524.75040.33090.41660.91160.6141
149441.2353.6321229.6419555.28260.19730.36730.88860.6156
150474.3357.96223.8484585.8140.15850.2370.8430.6169
151483.9362.3463218.7286616.59270.17440.19410.78760.618
152417.9366.7917214.1395647.79770.36070.2070.79530.6189
153365.9371.2972209.9799679.56760.48630.38350.74190.6196
154263375.8636206.1758712.01580.25520.52320.69250.6202
155199.4380.4919202.6707745.23920.16520.73610.62050.6205


Univariate ARIMA Extrapolation Forecast Performance
time% S.E.PEMAPESq.EMSERMSE
1440.0861-0.04470.0037220.127818.3444.283
1450.1378-0.04150.0035195.157816.26324.0328
1460.181-2e-0400.00534e-040.0211
1470.21980.06680.0056531.509844.29256.6553
1480.25610.1120.00931531.831127.652611.2983
1490.29090.24760.02067668.137639.011425.2787
1500.32480.3250.027113534.98741127.915633.5845
1510.3580.33550.02814775.31041231.275935.0895
1520.39090.13930.01162612.0601217.671714.7537
1530.4236-0.01450.001229.12942.42741.558
1540.4563-0.30030.02512738.19221061.51632.5809
1550.4891-0.47590.039732794.27162732.85652.2767

\begin{tabular}{lllllllll}
\hline
Univariate ARIMA Extrapolation Forecast Performance \tabularnewline
time & % S.E. & PE & MAPE & Sq.E & MSE & RMSE \tabularnewline
144 & 0.0861 & -0.0447 & 0.0037 & 220.1278 & 18.344 & 4.283 \tabularnewline
145 & 0.1378 & -0.0415 & 0.0035 & 195.1578 & 16.2632 & 4.0328 \tabularnewline
146 & 0.181 & -2e-04 & 0 & 0.0053 & 4e-04 & 0.0211 \tabularnewline
147 & 0.2198 & 0.0668 & 0.0056 & 531.5098 & 44.2925 & 6.6553 \tabularnewline
148 & 0.2561 & 0.112 & 0.0093 & 1531.831 & 127.6526 & 11.2983 \tabularnewline
149 & 0.2909 & 0.2476 & 0.0206 & 7668.137 & 639.0114 & 25.2787 \tabularnewline
150 & 0.3248 & 0.325 & 0.0271 & 13534.9874 & 1127.9156 & 33.5845 \tabularnewline
151 & 0.358 & 0.3355 & 0.028 & 14775.3104 & 1231.2759 & 35.0895 \tabularnewline
152 & 0.3909 & 0.1393 & 0.0116 & 2612.0601 & 217.6717 & 14.7537 \tabularnewline
153 & 0.4236 & -0.0145 & 0.0012 & 29.1294 & 2.4274 & 1.558 \tabularnewline
154 & 0.4563 & -0.3003 & 0.025 & 12738.1922 & 1061.516 & 32.5809 \tabularnewline
155 & 0.4891 & -0.4759 & 0.0397 & 32794.2716 & 2732.856 & 52.2767 \tabularnewline
\hline
\end{tabular}
%Source: https://freestatistics.org/blog/index.php?pk=33301&T=2

[TABLE]
[ROW][C]Univariate ARIMA Extrapolation Forecast Performance[/C][/ROW]
[ROW][C]time[/C][C]% S.E.[/C][C]PE[/C][C]MAPE[/C][C]Sq.E[/C][C]MSE[/C][C]RMSE[/C][/ROW]
[ROW][C]144[/C][C]0.0861[/C][C]-0.0447[/C][C]0.0037[/C][C]220.1278[/C][C]18.344[/C][C]4.283[/C][/ROW]
[ROW][C]145[/C][C]0.1378[/C][C]-0.0415[/C][C]0.0035[/C][C]195.1578[/C][C]16.2632[/C][C]4.0328[/C][/ROW]
[ROW][C]146[/C][C]0.181[/C][C]-2e-04[/C][C]0[/C][C]0.0053[/C][C]4e-04[/C][C]0.0211[/C][/ROW]
[ROW][C]147[/C][C]0.2198[/C][C]0.0668[/C][C]0.0056[/C][C]531.5098[/C][C]44.2925[/C][C]6.6553[/C][/ROW]
[ROW][C]148[/C][C]0.2561[/C][C]0.112[/C][C]0.0093[/C][C]1531.831[/C][C]127.6526[/C][C]11.2983[/C][/ROW]
[ROW][C]149[/C][C]0.2909[/C][C]0.2476[/C][C]0.0206[/C][C]7668.137[/C][C]639.0114[/C][C]25.2787[/C][/ROW]
[ROW][C]150[/C][C]0.3248[/C][C]0.325[/C][C]0.0271[/C][C]13534.9874[/C][C]1127.9156[/C][C]33.5845[/C][/ROW]
[ROW][C]151[/C][C]0.358[/C][C]0.3355[/C][C]0.028[/C][C]14775.3104[/C][C]1231.2759[/C][C]35.0895[/C][/ROW]
[ROW][C]152[/C][C]0.3909[/C][C]0.1393[/C][C]0.0116[/C][C]2612.0601[/C][C]217.6717[/C][C]14.7537[/C][/ROW]
[ROW][C]153[/C][C]0.4236[/C][C]-0.0145[/C][C]0.0012[/C][C]29.1294[/C][C]2.4274[/C][C]1.558[/C][/ROW]
[ROW][C]154[/C][C]0.4563[/C][C]-0.3003[/C][C]0.025[/C][C]12738.1922[/C][C]1061.516[/C][C]32.5809[/C][/ROW]
[ROW][C]155[/C][C]0.4891[/C][C]-0.4759[/C][C]0.0397[/C][C]32794.2716[/C][C]2732.856[/C][C]52.2767[/C][/ROW]
[/TABLE]
Source: https://freestatistics.org/blog/index.php?pk=33301&T=2

Globally Unique Identifier (entire table): ba.freestatistics.org/blog/index.php?pk=33301&T=2

As an alternative you can also use a QR Code:  

The GUIDs for individual cells are displayed in the table below:

Univariate ARIMA Extrapolation Forecast Performance
time% S.E.PEMAPESq.EMSERMSE
1440.0861-0.04470.0037220.127818.3444.283
1450.1378-0.04150.0035195.157816.26324.0328
1460.181-2e-0400.00534e-040.0211
1470.21980.06680.0056531.509844.29256.6553
1480.25610.1120.00931531.831127.652611.2983
1490.29090.24760.02067668.137639.011425.2787
1500.32480.3250.027113534.98741127.915633.5845
1510.3580.33550.02814775.31041231.275935.0895
1520.39090.13930.01162612.0601217.671714.7537
1530.4236-0.01450.001229.12942.42741.558
1540.4563-0.30030.02512738.19221061.51632.5809
1550.4891-0.47590.039732794.27162732.85652.2767


Parameters (Session):
par1 = 12 ; par2 = -0.1 ; par3 = 2 ; par4 = 0 ; par5 = 12 ; par6 = 1 ; par7 = 1 ; par8 = 0 ; par9 = 0 ; par10 = FALSE ;
Parameters (R input):
par1 = 12 ; par2 = -0.1 ; par3 = 2 ; par4 = 0 ; par5 = 12 ; par6 = 1 ; par7 = 1 ; par8 = 0 ; par9 = 0 ; par10 = FALSE ;
R code (references can be found in the software module):
par1 <- as.numeric(par1) #cut off periods
par2 <- as.numeric(par2) #lambda
par3 <- as.numeric(par3) #degree of non-seasonal differencing
par4 <- as.numeric(par4) #degree of seasonal differencing
par5 <- as.numeric(par5) #seasonal period
par6 <- as.numeric(par6) #p
par7 <- as.numeric(par7) #q
par8 <- as.numeric(par8) #P
par9 <- as.numeric(par9) #Q
if (par10 == 'TRUE') par10 <- TRUE
if (par10 == 'FALSE') par10 <- FALSE
if (par2 == 0) x <- log(x)
if (par2 != 0) x <- x^par2
lx <- length(x)
first <- lx - 2*par1
nx <- lx - par1
nx1 <- nx + 1
fx <- lx - nx
if (fx < 1) {
fx <- par5
nx1 <- lx + fx - 1
first <- lx - 2*fx
}
first <- 1
if (fx < 3) fx <- round(lx/10,0)
(arima.out <- arima(x[1:nx], order=c(par6,par3,par7), seasonal=list(order=c(par8,par4,par9), period=par5), include.mean=par10, method='ML'))
(forecast <- predict(arima.out,fx))
(lb <- forecast$pred - 1.96 * forecast$se)
(ub <- forecast$pred + 1.96 * forecast$se)
if (par2 == 0) {
x <- exp(x)
forecast$pred <- exp(forecast$pred)
lb <- exp(lb)
ub <- exp(ub)
}
if (par2 != 0) {
x <- x^(1/par2)
forecast$pred <- forecast$pred^(1/par2)
lb <- lb^(1/par2)
ub <- ub^(1/par2)
}
if (par2 < 0) {
olb <- lb
lb <- ub
ub <- olb
}
(actandfor <- c(x[1:nx], forecast$pred))
(perc.se <- (ub-forecast$pred)/1.96/forecast$pred)
bitmap(file='test1.png')
opar <- par(mar=c(4,4,2,2),las=1)
ylim <- c( min(x[first:nx],lb), max(x[first:nx],ub))
plot(x,ylim=ylim,type='n',xlim=c(first,lx))
usr <- par('usr')
rect(usr[1],usr[3],nx+1,usr[4],border=NA,col='lemonchiffon')
rect(nx1,usr[3],usr[2],usr[4],border=NA,col='lavender')
abline(h= (-3:3)*2 , col ='gray', lty =3)
polygon( c(nx1:lx,lx:nx1), c(lb,rev(ub)), col = 'orange', lty=2,border=NA)
lines(nx1:lx, lb , lty=2)
lines(nx1:lx, ub , lty=2)
lines(x, lwd=2)
lines(nx1:lx, forecast$pred , lwd=2 , col ='white')
box()
par(opar)
dev.off()
prob.dec <- array(NA, dim=fx)
prob.sdec <- array(NA, dim=fx)
prob.ldec <- array(NA, dim=fx)
prob.pval <- array(NA, dim=fx)
perf.pe <- array(0, dim=fx)
perf.mape <- array(0, dim=fx)
perf.se <- array(0, dim=fx)
perf.mse <- array(0, dim=fx)
perf.rmse <- array(0, dim=fx)
for (i in 1:fx) {
locSD <- (ub[i] - forecast$pred[i]) / 1.96
perf.pe[i] = (x[nx+i] - forecast$pred[i]) / forecast$pred[i]
perf.mape[i] = perf.mape[i] + abs(perf.pe[i])
perf.se[i] = (x[nx+i] - forecast$pred[i])^2
perf.mse[i] = perf.mse[i] + perf.se[i]
prob.dec[i] = pnorm((x[nx+i-1] - forecast$pred[i]) / locSD)
prob.sdec[i] = pnorm((x[nx+i-par5] - forecast$pred[i]) / locSD)
prob.ldec[i] = pnorm((x[nx] - forecast$pred[i]) / locSD)
prob.pval[i] = pnorm(abs(x[nx+i] - forecast$pred[i]) / locSD)
}
perf.mape = perf.mape / fx
perf.mse = perf.mse / fx
perf.rmse = sqrt(perf.mse)
bitmap(file='test2.png')
plot(forecast$pred, pch=19, type='b',main='ARIMA Extrapolation Forecast', ylab='Forecast and 95% CI', xlab='time',ylim=c(min(lb),max(ub)))
dum <- forecast$pred
dum[1:12] <- x[(nx+1):lx]
lines(dum, lty=1)
lines(ub,lty=3)
lines(lb,lty=3)
dev.off()
load(file='createtable')
a<-table.start()
a<-table.row.start(a)
a<-table.element(a,'Univariate ARIMA Extrapolation Forecast',9,TRUE)
a<-table.row.end(a)
a<-table.row.start(a)
a<-table.element(a,'time',1,header=TRUE)
a<-table.element(a,'Y[t]',1,header=TRUE)
a<-table.element(a,'F[t]',1,header=TRUE)
a<-table.element(a,'95% LB',1,header=TRUE)
a<-table.element(a,'95% UB',1,header=TRUE)
a<-table.element(a,'p-value
(H0: Y[t] = F[t])',1,header=TRUE)
a<-table.element(a,'P(F[t]>Y[t-1])',1,header=TRUE)
a<-table.element(a,'P(F[t]>Y[t-s])',1,header=TRUE)
mylab <- paste('P(F[t]>Y[',nx,sep='')
mylab <- paste(mylab,'])',sep='')
a<-table.element(a,mylab,1,header=TRUE)
a<-table.row.end(a)
for (i in (nx-par5):nx) {
a<-table.row.start(a)
a<-table.element(a,i,header=TRUE)
a<-table.element(a,x[i])
a<-table.element(a,'-')
a<-table.row.end(a)
}
for (i in 1:fx) {
a<-table.row.start(a)
a<-table.element(a,nx+i,header=TRUE)
a<-table.element(a,round(x[nx+i],4))
a<-table.element(a,round(forecast$pred[i],4))
a<-table.element(a,round(lb[i],4))
a<-table.element(a,round(ub[i],4))
a<-table.element(a,round((1-prob.pval[i]),4))
a<-table.element(a,round((1-prob.dec[i]),4))
a<-table.element(a,round((1-prob.sdec[i]),4))
a<-table.element(a,round((1-prob.ldec[i]),4))
a<-table.row.end(a)
}
a<-table.end(a)
table.save(a,file='mytable.tab')
a<-table.start()
a<-table.row.start(a)
a<-table.element(a,'Univariate ARIMA Extrapolation Forecast Performance',7,TRUE)
a<-table.row.end(a)
a<-table.row.start(a)
a<-table.element(a,'time',1,header=TRUE)
a<-table.element(a,'% S.E.',1,header=TRUE)
a<-table.element(a,'PE',1,header=TRUE)
a<-table.element(a,'MAPE',1,header=TRUE)
a<-table.element(a,'Sq.E',1,header=TRUE)
a<-table.element(a,'MSE',1,header=TRUE)
a<-table.element(a,'RMSE',1,header=TRUE)
a<-table.row.end(a)
for (i in 1:fx) {
a<-table.row.start(a)
a<-table.element(a,nx+i,header=TRUE)
a<-table.element(a,round(perc.se[i],4))
a<-table.element(a,round(perf.pe[i],4))
a<-table.element(a,round(perf.mape[i],4))
a<-table.element(a,round(perf.se[i],4))
a<-table.element(a,round(perf.mse[i],4))
a<-table.element(a,round(perf.rmse[i],4))
a<-table.row.end(a)
}
a<-table.end(a)
table.save(a,file='mytable1.tab')