Free Statistics
of Irreproducible Research!
Description of Statistical Computation | |||||||||||||||||||||
|---|---|---|---|---|---|---|---|---|---|---|---|---|---|---|---|---|---|---|---|---|---|
| Author's title | |||||||||||||||||||||
| Author | *The author of this computation has been verified* | ||||||||||||||||||||
| R Software Module | rwasp_backtobackhist.wasp | ||||||||||||||||||||
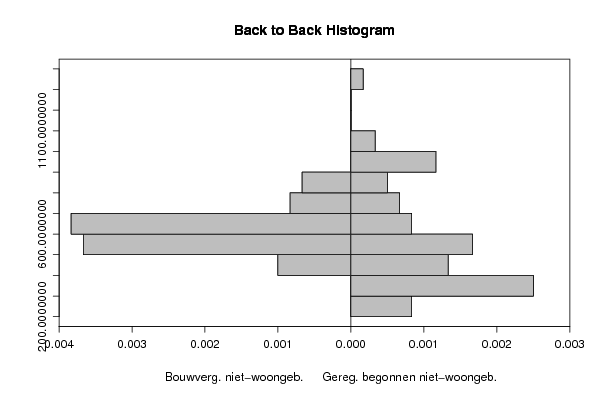
| Title produced by software | Back to Back Histogram | ||||||||||||||||||||
| Date of computation | Sun, 14 Dec 2008 04:20:11 -0700 | ||||||||||||||||||||
| Cite this page as follows | Statistical Computations at FreeStatistics.org, Office for Research Development and Education, URL https://freestatistics.org/blog/index.php?v=date/2008/Dec/14/t1229253689a04613xzz5tqr58.htm/, Retrieved Thu, 16 May 2024 00:54:37 +0000 | ||||||||||||||||||||
| Statistical Computations at FreeStatistics.org, Office for Research Development and Education, URL https://freestatistics.org/blog/index.php?pk=33293, Retrieved Thu, 16 May 2024 00:54:37 +0000 | |||||||||||||||||||||
| QR Codes: | |||||||||||||||||||||
|
| |||||||||||||||||||||
| Original text written by user: | |||||||||||||||||||||
| IsPrivate? | No (this computation is public) | ||||||||||||||||||||
| User-defined keywords | |||||||||||||||||||||
| Estimated Impact | 175 | ||||||||||||||||||||
Tree of Dependent Computations | |||||||||||||||||||||
| Family? (F = Feedback message, R = changed R code, M = changed R Module, P = changed Parameters, D = changed Data) | |||||||||||||||||||||
| - [Back to Back Histogram] [B-t-B-histogram p...] [2007-11-09 11:02:25] [d255a97fd5d03c71781b63d0b6fcea5d] - R PD [Back to Back Histogram] [Paper - back to b...] [2008-12-14 11:20:11] [73ec5abea95a9c3c8c3a1ac44cab1f72] [Current] | |||||||||||||||||||||
| Feedback Forum | |||||||||||||||||||||
Post a new message | |||||||||||||||||||||
Dataset | |||||||||||||||||||||
| Dataseries X: | |||||||||||||||||||||
535 681 830 720 582 806 728 803 830 699 622 655 571 512 674 522 627 769 633 715 702 678 531 562 504 552 511 695 559 677 636 694 694 624 524 557 490 475 492 491 489 606 618 607 637 597 539 600 448 520 607 566 595 625 667 587 629 562 511 664 | |||||||||||||||||||||
| Dataseries Y: | |||||||||||||||||||||
458 582 597 729 812 697 545 677 598 701 956 971 967 683 611 955 782 877 399 615 906 1324 952 710 288 312 313 387 540 465 282 389 488 803 1050 1027 332 466 353 345 341 354 287 379 533 534 578 991 366 254 449 349 532 590 469 362 424 372 253 462 | |||||||||||||||||||||
Tables (Output of Computation) | |||||||||||||||||||||
| |||||||||||||||||||||
Figures (Output of Computation) | |||||||||||||||||||||
Input Parameters & R Code | |||||||||||||||||||||
| Parameters (Session): | |||||||||||||||||||||
| par1 = grey ; par2 = grey ; par3 = TRUE ; par4 = Bouwverg. niet-woongeb. ; par5 = Gereg. begonnen niet-woongeb. ; | |||||||||||||||||||||
| Parameters (R input): | |||||||||||||||||||||
| par1 = grey ; par2 = grey ; par3 = TRUE ; par4 = Bouwverg. niet-woongeb. ; par5 = Gereg. begonnen niet-woongeb. ; | |||||||||||||||||||||
| R code (references can be found in the software module): | |||||||||||||||||||||
if (par3 == 'TRUE') par3 <- TRUE | |||||||||||||||||||||