Free Statistics

of Irreproducible Research!

Author's title

Author*Unverified author*
R Software Modulerwasp_autocorrelation.wasp
Title produced by software(Partial) Autocorrelation Function
Date of computationSun, 14 Dec 2008 04:16:34 -0700
Cite this page as followsStatistical Computations at FreeStatistics.org, Office for Research Development and Education, URL https://freestatistics.org/blog/index.php?v=date/2008/Dec/14/t1229253507midh37ondq9ijz9.htm/, Retrieved Wed, 15 May 2024 23:36:28 +0000
Statistical Computations at FreeStatistics.org, Office for Research Development and Education, URL https://freestatistics.org/blog/index.php?pk=33292, Retrieved Wed, 15 May 2024 23:36:28 +0000
QR Codes:

Original text written by user:
IsPrivate?No (this computation is public)
User-defined keywords
Estimated Impact210
Family? (F = Feedback message, R = changed R code, M = changed R Module, P = changed Parameters, D = changed Data)
-       [(Partial) Autocorrelation Function] [paper autocorrela...] [2008-12-14 11:16:34] [d41d8cd98f00b204e9800998ecf8427e] [Current]
Feedback Forum

Post a new message
Dataseries X:
6340.5
7901.5
8191.1
7181.7
7594.4
7384.7
7876.7
8463.4
8317.2
7778.7
8532.8
7272.2
6680.1
8427.6
8752.8
7952.7
8694.3
7787
8474.2
9154.7
8557.2
7951.1
9156.7
7865.7
7337.4
9131.7
8814.6
8598.8
8439.6
7451.8
8016.2
9544.1
8270.7
8102.2
9369
7657.7
7816.6
9391.3
9445.4
9533.1
10068.7
8955.5
10423.9
11617.2
9391.1
10872
10230.4
9221
9428.6
10934.5
10986
11724.6
11180.9
11163.2
11240.9
12107.1
10762.3
11340.4
11266.8
9542.7
9227.7
10571.9
10774.4
10392.8
9920.2
9884.9
10174.5
11395.4
10760.2
10570.1
10536
9902.6
8889
10837.3
11624.1
10509
10984.9
10649.1
10855.7
11677.4
10760.2
10046.2
10772.8
9987.7
8638.7
11063.7
11855.7
10684.5
11337.4
10478
11123.9
12909.3
11339.9
10462.2
12733.5
10519.2
10414.9
12476.8
12384.6
12266.7
12919.9
11497.3
12142
13919.4
12656.8
12034.1
13199.7
10881.3
11301.2
13643.9
12517
13981.1
14275.7
13435
13565.7
16216.3
12970
14079.9
14235
12213.4
12581


Summary of computational transaction
Raw Inputview raw input (R code)
Raw Outputview raw output of R engine
Computing time1 seconds
R Server'George Udny Yule' @ 72.249.76.132

\begin{tabular}{lllllllll}
\hline
Summary of computational transaction \tabularnewline
Raw Input & view raw input (R code)  \tabularnewline
Raw Output & view raw output of R engine  \tabularnewline
Computing time & 1 seconds \tabularnewline
R Server & 'George Udny Yule' @ 72.249.76.132 \tabularnewline
\hline
\end{tabular}
%Source: https://freestatistics.org/blog/index.php?pk=33292&T=0

[TABLE]
[ROW][C]Summary of computational transaction[/C][/ROW]
[ROW][C]Raw Input[/C][C]view raw input (R code) [/C][/ROW]
[ROW][C]Raw Output[/C][C]view raw output of R engine [/C][/ROW]
[ROW][C]Computing time[/C][C]1 seconds[/C][/ROW]
[ROW][C]R Server[/C][C]'George Udny Yule' @ 72.249.76.132[/C][/ROW]
[/TABLE]
Source: https://freestatistics.org/blog/index.php?pk=33292&T=0

Globally Unique Identifier (entire table): ba.freestatistics.org/blog/index.php?pk=33292&T=0

As an alternative you can also use a QR Code:  

The GUIDs for individual cells are displayed in the table below:

Summary of computational transaction
Raw Inputview raw input (R code)
Raw Outputview raw output of R engine
Computing time1 seconds
R Server'George Udny Yule' @ 72.249.76.132


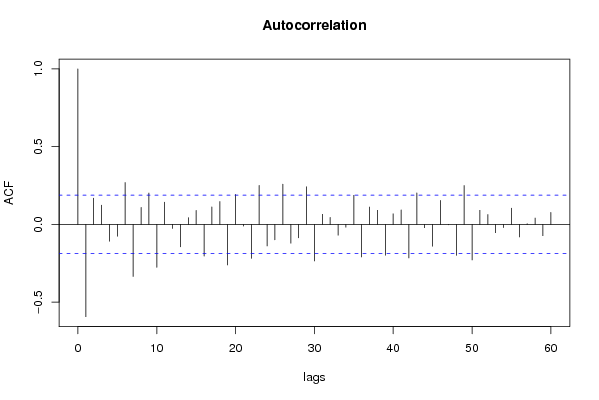
Autocorrelation Function
Time lag kACF(k)T-STATP-value
1-0.593563-6.16850
20.1683271.74930.04154
30.1238021.28660.100494
4-0.108332-1.12580.131369
5-0.075855-0.78830.216122
60.2691712.79730.003051
7-0.335192-3.48340.000358
80.1090931.13370.129709
90.2016962.09610.019205
10-0.276121-2.86950.002473
110.1427551.48360.070419
12-0.026105-0.27130.393342
13-0.14418-1.49840.068478
140.0427530.44430.328856
150.0899370.93470.176025
16-0.203999-2.120.018147
170.1123811.16790.122709
180.1466971.52450.065151
19-0.260818-2.71050.003908
200.192592.00150.023926
21-0.011155-0.11590.453964
22-0.218468-2.27040.012584
230.2505392.60370.00526
24-0.138893-1.44340.075898
25-0.099269-1.03160.152274
260.2583582.68490.004199
27-0.120758-1.2550.106103
28-0.086728-0.90130.184716
290.2419712.51460.006695
30-0.23476-2.43970.008164
310.0651820.67740.249802
320.0446140.46360.321918
33-0.069362-0.72080.236284
34-0.018181-0.18890.425244
350.1869871.94320.027296
36-0.209619-2.17840.015774
370.1116881.16070.124163
380.0904410.93990.174685
39-0.19783-2.05590.021102
400.0683730.71060.239445
410.0930140.96660.167944
42-0.216174-2.24650.013352
430.2026952.10650.01874
44-0.021108-0.21940.413391
45-0.140641-1.46160.073379
460.1542691.60320.055904
47-0.002871-0.02980.488128
48-0.198751-2.06550.020636
490.2495822.59370.005405
50-0.228797-2.37770.009589
510.0908390.9440.173631
520.0628850.65350.257404
53-0.053296-0.55390.290406
54-0.020217-0.21010.416992
550.104261.08350.140498
56-0.080676-0.83840.201826
570.0045810.04760.481058
580.0409670.42570.335572
59-0.072825-0.75680.225403
600.0769440.79960.212843

\begin{tabular}{lllllllll}
\hline
Autocorrelation Function \tabularnewline
Time lag k & ACF(k) & T-STAT & P-value \tabularnewline
1 & -0.593563 & -6.1685 & 0 \tabularnewline
2 & 0.168327 & 1.7493 & 0.04154 \tabularnewline
3 & 0.123802 & 1.2866 & 0.100494 \tabularnewline
4 & -0.108332 & -1.1258 & 0.131369 \tabularnewline
5 & -0.075855 & -0.7883 & 0.216122 \tabularnewline
6 & 0.269171 & 2.7973 & 0.003051 \tabularnewline
7 & -0.335192 & -3.4834 & 0.000358 \tabularnewline
8 & 0.109093 & 1.1337 & 0.129709 \tabularnewline
9 & 0.201696 & 2.0961 & 0.019205 \tabularnewline
10 & -0.276121 & -2.8695 & 0.002473 \tabularnewline
11 & 0.142755 & 1.4836 & 0.070419 \tabularnewline
12 & -0.026105 & -0.2713 & 0.393342 \tabularnewline
13 & -0.14418 & -1.4984 & 0.068478 \tabularnewline
14 & 0.042753 & 0.4443 & 0.328856 \tabularnewline
15 & 0.089937 & 0.9347 & 0.176025 \tabularnewline
16 & -0.203999 & -2.12 & 0.018147 \tabularnewline
17 & 0.112381 & 1.1679 & 0.122709 \tabularnewline
18 & 0.146697 & 1.5245 & 0.065151 \tabularnewline
19 & -0.260818 & -2.7105 & 0.003908 \tabularnewline
20 & 0.19259 & 2.0015 & 0.023926 \tabularnewline
21 & -0.011155 & -0.1159 & 0.453964 \tabularnewline
22 & -0.218468 & -2.2704 & 0.012584 \tabularnewline
23 & 0.250539 & 2.6037 & 0.00526 \tabularnewline
24 & -0.138893 & -1.4434 & 0.075898 \tabularnewline
25 & -0.099269 & -1.0316 & 0.152274 \tabularnewline
26 & 0.258358 & 2.6849 & 0.004199 \tabularnewline
27 & -0.120758 & -1.255 & 0.106103 \tabularnewline
28 & -0.086728 & -0.9013 & 0.184716 \tabularnewline
29 & 0.241971 & 2.5146 & 0.006695 \tabularnewline
30 & -0.23476 & -2.4397 & 0.008164 \tabularnewline
31 & 0.065182 & 0.6774 & 0.249802 \tabularnewline
32 & 0.044614 & 0.4636 & 0.321918 \tabularnewline
33 & -0.069362 & -0.7208 & 0.236284 \tabularnewline
34 & -0.018181 & -0.1889 & 0.425244 \tabularnewline
35 & 0.186987 & 1.9432 & 0.027296 \tabularnewline
36 & -0.209619 & -2.1784 & 0.015774 \tabularnewline
37 & 0.111688 & 1.1607 & 0.124163 \tabularnewline
38 & 0.090441 & 0.9399 & 0.174685 \tabularnewline
39 & -0.19783 & -2.0559 & 0.021102 \tabularnewline
40 & 0.068373 & 0.7106 & 0.239445 \tabularnewline
41 & 0.093014 & 0.9666 & 0.167944 \tabularnewline
42 & -0.216174 & -2.2465 & 0.013352 \tabularnewline
43 & 0.202695 & 2.1065 & 0.01874 \tabularnewline
44 & -0.021108 & -0.2194 & 0.413391 \tabularnewline
45 & -0.140641 & -1.4616 & 0.073379 \tabularnewline
46 & 0.154269 & 1.6032 & 0.055904 \tabularnewline
47 & -0.002871 & -0.0298 & 0.488128 \tabularnewline
48 & -0.198751 & -2.0655 & 0.020636 \tabularnewline
49 & 0.249582 & 2.5937 & 0.005405 \tabularnewline
50 & -0.228797 & -2.3777 & 0.009589 \tabularnewline
51 & 0.090839 & 0.944 & 0.173631 \tabularnewline
52 & 0.062885 & 0.6535 & 0.257404 \tabularnewline
53 & -0.053296 & -0.5539 & 0.290406 \tabularnewline
54 & -0.020217 & -0.2101 & 0.416992 \tabularnewline
55 & 0.10426 & 1.0835 & 0.140498 \tabularnewline
56 & -0.080676 & -0.8384 & 0.201826 \tabularnewline
57 & 0.004581 & 0.0476 & 0.481058 \tabularnewline
58 & 0.040967 & 0.4257 & 0.335572 \tabularnewline
59 & -0.072825 & -0.7568 & 0.225403 \tabularnewline
60 & 0.076944 & 0.7996 & 0.212843 \tabularnewline
\hline
\end{tabular}
%Source: https://freestatistics.org/blog/index.php?pk=33292&T=1

[TABLE]
[ROW][C]Autocorrelation Function[/C][/ROW]
[ROW][C]Time lag k[/C][C]ACF(k)[/C][C]T-STAT[/C][C]P-value[/C][/ROW]
[ROW][C]1[/C][C]-0.593563[/C][C]-6.1685[/C][C]0[/C][/ROW]
[ROW][C]2[/C][C]0.168327[/C][C]1.7493[/C][C]0.04154[/C][/ROW]
[ROW][C]3[/C][C]0.123802[/C][C]1.2866[/C][C]0.100494[/C][/ROW]
[ROW][C]4[/C][C]-0.108332[/C][C]-1.1258[/C][C]0.131369[/C][/ROW]
[ROW][C]5[/C][C]-0.075855[/C][C]-0.7883[/C][C]0.216122[/C][/ROW]
[ROW][C]6[/C][C]0.269171[/C][C]2.7973[/C][C]0.003051[/C][/ROW]
[ROW][C]7[/C][C]-0.335192[/C][C]-3.4834[/C][C]0.000358[/C][/ROW]
[ROW][C]8[/C][C]0.109093[/C][C]1.1337[/C][C]0.129709[/C][/ROW]
[ROW][C]9[/C][C]0.201696[/C][C]2.0961[/C][C]0.019205[/C][/ROW]
[ROW][C]10[/C][C]-0.276121[/C][C]-2.8695[/C][C]0.002473[/C][/ROW]
[ROW][C]11[/C][C]0.142755[/C][C]1.4836[/C][C]0.070419[/C][/ROW]
[ROW][C]12[/C][C]-0.026105[/C][C]-0.2713[/C][C]0.393342[/C][/ROW]
[ROW][C]13[/C][C]-0.14418[/C][C]-1.4984[/C][C]0.068478[/C][/ROW]
[ROW][C]14[/C][C]0.042753[/C][C]0.4443[/C][C]0.328856[/C][/ROW]
[ROW][C]15[/C][C]0.089937[/C][C]0.9347[/C][C]0.176025[/C][/ROW]
[ROW][C]16[/C][C]-0.203999[/C][C]-2.12[/C][C]0.018147[/C][/ROW]
[ROW][C]17[/C][C]0.112381[/C][C]1.1679[/C][C]0.122709[/C][/ROW]
[ROW][C]18[/C][C]0.146697[/C][C]1.5245[/C][C]0.065151[/C][/ROW]
[ROW][C]19[/C][C]-0.260818[/C][C]-2.7105[/C][C]0.003908[/C][/ROW]
[ROW][C]20[/C][C]0.19259[/C][C]2.0015[/C][C]0.023926[/C][/ROW]
[ROW][C]21[/C][C]-0.011155[/C][C]-0.1159[/C][C]0.453964[/C][/ROW]
[ROW][C]22[/C][C]-0.218468[/C][C]-2.2704[/C][C]0.012584[/C][/ROW]
[ROW][C]23[/C][C]0.250539[/C][C]2.6037[/C][C]0.00526[/C][/ROW]
[ROW][C]24[/C][C]-0.138893[/C][C]-1.4434[/C][C]0.075898[/C][/ROW]
[ROW][C]25[/C][C]-0.099269[/C][C]-1.0316[/C][C]0.152274[/C][/ROW]
[ROW][C]26[/C][C]0.258358[/C][C]2.6849[/C][C]0.004199[/C][/ROW]
[ROW][C]27[/C][C]-0.120758[/C][C]-1.255[/C][C]0.106103[/C][/ROW]
[ROW][C]28[/C][C]-0.086728[/C][C]-0.9013[/C][C]0.184716[/C][/ROW]
[ROW][C]29[/C][C]0.241971[/C][C]2.5146[/C][C]0.006695[/C][/ROW]
[ROW][C]30[/C][C]-0.23476[/C][C]-2.4397[/C][C]0.008164[/C][/ROW]
[ROW][C]31[/C][C]0.065182[/C][C]0.6774[/C][C]0.249802[/C][/ROW]
[ROW][C]32[/C][C]0.044614[/C][C]0.4636[/C][C]0.321918[/C][/ROW]
[ROW][C]33[/C][C]-0.069362[/C][C]-0.7208[/C][C]0.236284[/C][/ROW]
[ROW][C]34[/C][C]-0.018181[/C][C]-0.1889[/C][C]0.425244[/C][/ROW]
[ROW][C]35[/C][C]0.186987[/C][C]1.9432[/C][C]0.027296[/C][/ROW]
[ROW][C]36[/C][C]-0.209619[/C][C]-2.1784[/C][C]0.015774[/C][/ROW]
[ROW][C]37[/C][C]0.111688[/C][C]1.1607[/C][C]0.124163[/C][/ROW]
[ROW][C]38[/C][C]0.090441[/C][C]0.9399[/C][C]0.174685[/C][/ROW]
[ROW][C]39[/C][C]-0.19783[/C][C]-2.0559[/C][C]0.021102[/C][/ROW]
[ROW][C]40[/C][C]0.068373[/C][C]0.7106[/C][C]0.239445[/C][/ROW]
[ROW][C]41[/C][C]0.093014[/C][C]0.9666[/C][C]0.167944[/C][/ROW]
[ROW][C]42[/C][C]-0.216174[/C][C]-2.2465[/C][C]0.013352[/C][/ROW]
[ROW][C]43[/C][C]0.202695[/C][C]2.1065[/C][C]0.01874[/C][/ROW]
[ROW][C]44[/C][C]-0.021108[/C][C]-0.2194[/C][C]0.413391[/C][/ROW]
[ROW][C]45[/C][C]-0.140641[/C][C]-1.4616[/C][C]0.073379[/C][/ROW]
[ROW][C]46[/C][C]0.154269[/C][C]1.6032[/C][C]0.055904[/C][/ROW]
[ROW][C]47[/C][C]-0.002871[/C][C]-0.0298[/C][C]0.488128[/C][/ROW]
[ROW][C]48[/C][C]-0.198751[/C][C]-2.0655[/C][C]0.020636[/C][/ROW]
[ROW][C]49[/C][C]0.249582[/C][C]2.5937[/C][C]0.005405[/C][/ROW]
[ROW][C]50[/C][C]-0.228797[/C][C]-2.3777[/C][C]0.009589[/C][/ROW]
[ROW][C]51[/C][C]0.090839[/C][C]0.944[/C][C]0.173631[/C][/ROW]
[ROW][C]52[/C][C]0.062885[/C][C]0.6535[/C][C]0.257404[/C][/ROW]
[ROW][C]53[/C][C]-0.053296[/C][C]-0.5539[/C][C]0.290406[/C][/ROW]
[ROW][C]54[/C][C]-0.020217[/C][C]-0.2101[/C][C]0.416992[/C][/ROW]
[ROW][C]55[/C][C]0.10426[/C][C]1.0835[/C][C]0.140498[/C][/ROW]
[ROW][C]56[/C][C]-0.080676[/C][C]-0.8384[/C][C]0.201826[/C][/ROW]
[ROW][C]57[/C][C]0.004581[/C][C]0.0476[/C][C]0.481058[/C][/ROW]
[ROW][C]58[/C][C]0.040967[/C][C]0.4257[/C][C]0.335572[/C][/ROW]
[ROW][C]59[/C][C]-0.072825[/C][C]-0.7568[/C][C]0.225403[/C][/ROW]
[ROW][C]60[/C][C]0.076944[/C][C]0.7996[/C][C]0.212843[/C][/ROW]
[/TABLE]
Source: https://freestatistics.org/blog/index.php?pk=33292&T=1

Globally Unique Identifier (entire table): ba.freestatistics.org/blog/index.php?pk=33292&T=1

As an alternative you can also use a QR Code:  

The GUIDs for individual cells are displayed in the table below:

Autocorrelation Function
Time lag kACF(k)T-STATP-value
1-0.593563-6.16850
20.1683271.74930.04154
30.1238021.28660.100494
4-0.108332-1.12580.131369
5-0.075855-0.78830.216122
60.2691712.79730.003051
7-0.335192-3.48340.000358
80.1090931.13370.129709
90.2016962.09610.019205
10-0.276121-2.86950.002473
110.1427551.48360.070419
12-0.026105-0.27130.393342
13-0.14418-1.49840.068478
140.0427530.44430.328856
150.0899370.93470.176025
16-0.203999-2.120.018147
170.1123811.16790.122709
180.1466971.52450.065151
19-0.260818-2.71050.003908
200.192592.00150.023926
21-0.011155-0.11590.453964
22-0.218468-2.27040.012584
230.2505392.60370.00526
24-0.138893-1.44340.075898
25-0.099269-1.03160.152274
260.2583582.68490.004199
27-0.120758-1.2550.106103
28-0.086728-0.90130.184716
290.2419712.51460.006695
30-0.23476-2.43970.008164
310.0651820.67740.249802
320.0446140.46360.321918
33-0.069362-0.72080.236284
34-0.018181-0.18890.425244
350.1869871.94320.027296
36-0.209619-2.17840.015774
370.1116881.16070.124163
380.0904410.93990.174685
39-0.19783-2.05590.021102
400.0683730.71060.239445
410.0930140.96660.167944
42-0.216174-2.24650.013352
430.2026952.10650.01874
44-0.021108-0.21940.413391
45-0.140641-1.46160.073379
460.1542691.60320.055904
47-0.002871-0.02980.488128
48-0.198751-2.06550.020636
490.2495822.59370.005405
50-0.228797-2.37770.009589
510.0908390.9440.173631
520.0628850.65350.257404
53-0.053296-0.55390.290406
54-0.020217-0.21010.416992
550.104261.08350.140498
56-0.080676-0.83840.201826
570.0045810.04760.481058
580.0409670.42570.335572
59-0.072825-0.75680.225403
600.0769440.79960.212843


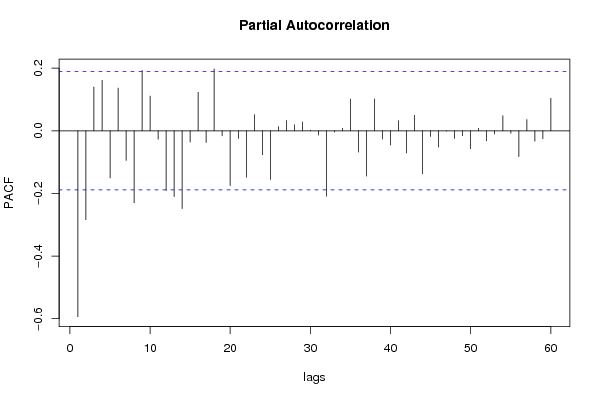
Partial Autocorrelation Function
Time lag kPACF(k)T-STATP-value
1-0.593563-6.16850
2-0.284074-2.95220.001936
30.1402071.45710.073999
40.1612911.67620.048297
5-0.150623-1.56530.060216
60.136631.41990.079259
7-0.094891-0.98610.163136
8-0.229427-2.38430.009429
90.1927462.00310.023837
100.1109191.15270.125788
11-0.026738-0.27790.390822
12-0.190899-1.98390.024903
13-0.210145-2.18390.015567
14-0.248267-2.58010.00561
15-0.036194-0.37610.353776
160.1230051.27830.101941
17-0.037353-0.38820.34932
180.1974852.05230.021278
19-0.016195-0.16830.433331
20-0.175076-1.81940.035807
21-0.024359-0.25310.400317
22-0.148-1.53810.06348
230.0514250.53440.297072
24-0.076763-0.79770.213386
25-0.155175-1.61260.054872
260.0133170.13840.445094
270.0325570.33830.367882
280.0189630.19710.422073
290.0282760.29380.384719
300.0017990.01870.49256
31-0.013486-0.14010.444403
32-0.208783-2.16970.016109
33-0.003535-0.03670.48538
340.0079410.08250.467189
350.1011251.05090.14782
36-0.067798-0.70460.241295
37-0.144583-1.50250.067937
380.1015611.05550.146786
39-0.026178-0.2720.393052
40-0.045768-0.47560.317646
410.0321090.33370.369631
42-0.070755-0.73530.231873
430.0494170.51360.304307
44-0.137419-1.42810.078074
45-0.018545-0.19270.423766
46-0.052161-0.54210.294444
47-0.000562-0.00580.497677
48-0.024555-0.25520.399532
49-0.015535-0.16140.436023
50-0.057006-0.59240.277402
510.0080050.08320.466928
52-0.03216-0.33420.36943
53-0.009981-0.10370.458791
540.0481860.50080.308778
55-0.008154-0.08470.466314
56-0.082212-0.85440.197396
570.0357750.37180.355389
58-0.03338-0.34690.364673
59-0.025726-0.26740.394853
600.1042731.08360.14047

\begin{tabular}{lllllllll}
\hline
Partial Autocorrelation Function \tabularnewline
Time lag k & PACF(k) & T-STAT & P-value \tabularnewline
1 & -0.593563 & -6.1685 & 0 \tabularnewline
2 & -0.284074 & -2.9522 & 0.001936 \tabularnewline
3 & 0.140207 & 1.4571 & 0.073999 \tabularnewline
4 & 0.161291 & 1.6762 & 0.048297 \tabularnewline
5 & -0.150623 & -1.5653 & 0.060216 \tabularnewline
6 & 0.13663 & 1.4199 & 0.079259 \tabularnewline
7 & -0.094891 & -0.9861 & 0.163136 \tabularnewline
8 & -0.229427 & -2.3843 & 0.009429 \tabularnewline
9 & 0.192746 & 2.0031 & 0.023837 \tabularnewline
10 & 0.110919 & 1.1527 & 0.125788 \tabularnewline
11 & -0.026738 & -0.2779 & 0.390822 \tabularnewline
12 & -0.190899 & -1.9839 & 0.024903 \tabularnewline
13 & -0.210145 & -2.1839 & 0.015567 \tabularnewline
14 & -0.248267 & -2.5801 & 0.00561 \tabularnewline
15 & -0.036194 & -0.3761 & 0.353776 \tabularnewline
16 & 0.123005 & 1.2783 & 0.101941 \tabularnewline
17 & -0.037353 & -0.3882 & 0.34932 \tabularnewline
18 & 0.197485 & 2.0523 & 0.021278 \tabularnewline
19 & -0.016195 & -0.1683 & 0.433331 \tabularnewline
20 & -0.175076 & -1.8194 & 0.035807 \tabularnewline
21 & -0.024359 & -0.2531 & 0.400317 \tabularnewline
22 & -0.148 & -1.5381 & 0.06348 \tabularnewline
23 & 0.051425 & 0.5344 & 0.297072 \tabularnewline
24 & -0.076763 & -0.7977 & 0.213386 \tabularnewline
25 & -0.155175 & -1.6126 & 0.054872 \tabularnewline
26 & 0.013317 & 0.1384 & 0.445094 \tabularnewline
27 & 0.032557 & 0.3383 & 0.367882 \tabularnewline
28 & 0.018963 & 0.1971 & 0.422073 \tabularnewline
29 & 0.028276 & 0.2938 & 0.384719 \tabularnewline
30 & 0.001799 & 0.0187 & 0.49256 \tabularnewline
31 & -0.013486 & -0.1401 & 0.444403 \tabularnewline
32 & -0.208783 & -2.1697 & 0.016109 \tabularnewline
33 & -0.003535 & -0.0367 & 0.48538 \tabularnewline
34 & 0.007941 & 0.0825 & 0.467189 \tabularnewline
35 & 0.101125 & 1.0509 & 0.14782 \tabularnewline
36 & -0.067798 & -0.7046 & 0.241295 \tabularnewline
37 & -0.144583 & -1.5025 & 0.067937 \tabularnewline
38 & 0.101561 & 1.0555 & 0.146786 \tabularnewline
39 & -0.026178 & -0.272 & 0.393052 \tabularnewline
40 & -0.045768 & -0.4756 & 0.317646 \tabularnewline
41 & 0.032109 & 0.3337 & 0.369631 \tabularnewline
42 & -0.070755 & -0.7353 & 0.231873 \tabularnewline
43 & 0.049417 & 0.5136 & 0.304307 \tabularnewline
44 & -0.137419 & -1.4281 & 0.078074 \tabularnewline
45 & -0.018545 & -0.1927 & 0.423766 \tabularnewline
46 & -0.052161 & -0.5421 & 0.294444 \tabularnewline
47 & -0.000562 & -0.0058 & 0.497677 \tabularnewline
48 & -0.024555 & -0.2552 & 0.399532 \tabularnewline
49 & -0.015535 & -0.1614 & 0.436023 \tabularnewline
50 & -0.057006 & -0.5924 & 0.277402 \tabularnewline
51 & 0.008005 & 0.0832 & 0.466928 \tabularnewline
52 & -0.03216 & -0.3342 & 0.36943 \tabularnewline
53 & -0.009981 & -0.1037 & 0.458791 \tabularnewline
54 & 0.048186 & 0.5008 & 0.308778 \tabularnewline
55 & -0.008154 & -0.0847 & 0.466314 \tabularnewline
56 & -0.082212 & -0.8544 & 0.197396 \tabularnewline
57 & 0.035775 & 0.3718 & 0.355389 \tabularnewline
58 & -0.03338 & -0.3469 & 0.364673 \tabularnewline
59 & -0.025726 & -0.2674 & 0.394853 \tabularnewline
60 & 0.104273 & 1.0836 & 0.14047 \tabularnewline
\hline
\end{tabular}
%Source: https://freestatistics.org/blog/index.php?pk=33292&T=2

[TABLE]
[ROW][C]Partial Autocorrelation Function[/C][/ROW]
[ROW][C]Time lag k[/C][C]PACF(k)[/C][C]T-STAT[/C][C]P-value[/C][/ROW]
[ROW][C]1[/C][C]-0.593563[/C][C]-6.1685[/C][C]0[/C][/ROW]
[ROW][C]2[/C][C]-0.284074[/C][C]-2.9522[/C][C]0.001936[/C][/ROW]
[ROW][C]3[/C][C]0.140207[/C][C]1.4571[/C][C]0.073999[/C][/ROW]
[ROW][C]4[/C][C]0.161291[/C][C]1.6762[/C][C]0.048297[/C][/ROW]
[ROW][C]5[/C][C]-0.150623[/C][C]-1.5653[/C][C]0.060216[/C][/ROW]
[ROW][C]6[/C][C]0.13663[/C][C]1.4199[/C][C]0.079259[/C][/ROW]
[ROW][C]7[/C][C]-0.094891[/C][C]-0.9861[/C][C]0.163136[/C][/ROW]
[ROW][C]8[/C][C]-0.229427[/C][C]-2.3843[/C][C]0.009429[/C][/ROW]
[ROW][C]9[/C][C]0.192746[/C][C]2.0031[/C][C]0.023837[/C][/ROW]
[ROW][C]10[/C][C]0.110919[/C][C]1.1527[/C][C]0.125788[/C][/ROW]
[ROW][C]11[/C][C]-0.026738[/C][C]-0.2779[/C][C]0.390822[/C][/ROW]
[ROW][C]12[/C][C]-0.190899[/C][C]-1.9839[/C][C]0.024903[/C][/ROW]
[ROW][C]13[/C][C]-0.210145[/C][C]-2.1839[/C][C]0.015567[/C][/ROW]
[ROW][C]14[/C][C]-0.248267[/C][C]-2.5801[/C][C]0.00561[/C][/ROW]
[ROW][C]15[/C][C]-0.036194[/C][C]-0.3761[/C][C]0.353776[/C][/ROW]
[ROW][C]16[/C][C]0.123005[/C][C]1.2783[/C][C]0.101941[/C][/ROW]
[ROW][C]17[/C][C]-0.037353[/C][C]-0.3882[/C][C]0.34932[/C][/ROW]
[ROW][C]18[/C][C]0.197485[/C][C]2.0523[/C][C]0.021278[/C][/ROW]
[ROW][C]19[/C][C]-0.016195[/C][C]-0.1683[/C][C]0.433331[/C][/ROW]
[ROW][C]20[/C][C]-0.175076[/C][C]-1.8194[/C][C]0.035807[/C][/ROW]
[ROW][C]21[/C][C]-0.024359[/C][C]-0.2531[/C][C]0.400317[/C][/ROW]
[ROW][C]22[/C][C]-0.148[/C][C]-1.5381[/C][C]0.06348[/C][/ROW]
[ROW][C]23[/C][C]0.051425[/C][C]0.5344[/C][C]0.297072[/C][/ROW]
[ROW][C]24[/C][C]-0.076763[/C][C]-0.7977[/C][C]0.213386[/C][/ROW]
[ROW][C]25[/C][C]-0.155175[/C][C]-1.6126[/C][C]0.054872[/C][/ROW]
[ROW][C]26[/C][C]0.013317[/C][C]0.1384[/C][C]0.445094[/C][/ROW]
[ROW][C]27[/C][C]0.032557[/C][C]0.3383[/C][C]0.367882[/C][/ROW]
[ROW][C]28[/C][C]0.018963[/C][C]0.1971[/C][C]0.422073[/C][/ROW]
[ROW][C]29[/C][C]0.028276[/C][C]0.2938[/C][C]0.384719[/C][/ROW]
[ROW][C]30[/C][C]0.001799[/C][C]0.0187[/C][C]0.49256[/C][/ROW]
[ROW][C]31[/C][C]-0.013486[/C][C]-0.1401[/C][C]0.444403[/C][/ROW]
[ROW][C]32[/C][C]-0.208783[/C][C]-2.1697[/C][C]0.016109[/C][/ROW]
[ROW][C]33[/C][C]-0.003535[/C][C]-0.0367[/C][C]0.48538[/C][/ROW]
[ROW][C]34[/C][C]0.007941[/C][C]0.0825[/C][C]0.467189[/C][/ROW]
[ROW][C]35[/C][C]0.101125[/C][C]1.0509[/C][C]0.14782[/C][/ROW]
[ROW][C]36[/C][C]-0.067798[/C][C]-0.7046[/C][C]0.241295[/C][/ROW]
[ROW][C]37[/C][C]-0.144583[/C][C]-1.5025[/C][C]0.067937[/C][/ROW]
[ROW][C]38[/C][C]0.101561[/C][C]1.0555[/C][C]0.146786[/C][/ROW]
[ROW][C]39[/C][C]-0.026178[/C][C]-0.272[/C][C]0.393052[/C][/ROW]
[ROW][C]40[/C][C]-0.045768[/C][C]-0.4756[/C][C]0.317646[/C][/ROW]
[ROW][C]41[/C][C]0.032109[/C][C]0.3337[/C][C]0.369631[/C][/ROW]
[ROW][C]42[/C][C]-0.070755[/C][C]-0.7353[/C][C]0.231873[/C][/ROW]
[ROW][C]43[/C][C]0.049417[/C][C]0.5136[/C][C]0.304307[/C][/ROW]
[ROW][C]44[/C][C]-0.137419[/C][C]-1.4281[/C][C]0.078074[/C][/ROW]
[ROW][C]45[/C][C]-0.018545[/C][C]-0.1927[/C][C]0.423766[/C][/ROW]
[ROW][C]46[/C][C]-0.052161[/C][C]-0.5421[/C][C]0.294444[/C][/ROW]
[ROW][C]47[/C][C]-0.000562[/C][C]-0.0058[/C][C]0.497677[/C][/ROW]
[ROW][C]48[/C][C]-0.024555[/C][C]-0.2552[/C][C]0.399532[/C][/ROW]
[ROW][C]49[/C][C]-0.015535[/C][C]-0.1614[/C][C]0.436023[/C][/ROW]
[ROW][C]50[/C][C]-0.057006[/C][C]-0.5924[/C][C]0.277402[/C][/ROW]
[ROW][C]51[/C][C]0.008005[/C][C]0.0832[/C][C]0.466928[/C][/ROW]
[ROW][C]52[/C][C]-0.03216[/C][C]-0.3342[/C][C]0.36943[/C][/ROW]
[ROW][C]53[/C][C]-0.009981[/C][C]-0.1037[/C][C]0.458791[/C][/ROW]
[ROW][C]54[/C][C]0.048186[/C][C]0.5008[/C][C]0.308778[/C][/ROW]
[ROW][C]55[/C][C]-0.008154[/C][C]-0.0847[/C][C]0.466314[/C][/ROW]
[ROW][C]56[/C][C]-0.082212[/C][C]-0.8544[/C][C]0.197396[/C][/ROW]
[ROW][C]57[/C][C]0.035775[/C][C]0.3718[/C][C]0.355389[/C][/ROW]
[ROW][C]58[/C][C]-0.03338[/C][C]-0.3469[/C][C]0.364673[/C][/ROW]
[ROW][C]59[/C][C]-0.025726[/C][C]-0.2674[/C][C]0.394853[/C][/ROW]
[ROW][C]60[/C][C]0.104273[/C][C]1.0836[/C][C]0.14047[/C][/ROW]
[/TABLE]
Source: https://freestatistics.org/blog/index.php?pk=33292&T=2

Globally Unique Identifier (entire table): ba.freestatistics.org/blog/index.php?pk=33292&T=2

As an alternative you can also use a QR Code:  

The GUIDs for individual cells are displayed in the table below:

Partial Autocorrelation Function
Time lag kPACF(k)T-STATP-value
1-0.593563-6.16850
2-0.284074-2.95220.001936
30.1402071.45710.073999
40.1612911.67620.048297
5-0.150623-1.56530.060216
60.136631.41990.079259
7-0.094891-0.98610.163136
8-0.229427-2.38430.009429
90.1927462.00310.023837
100.1109191.15270.125788
11-0.026738-0.27790.390822
12-0.190899-1.98390.024903
13-0.210145-2.18390.015567
14-0.248267-2.58010.00561
15-0.036194-0.37610.353776
160.1230051.27830.101941
17-0.037353-0.38820.34932
180.1974852.05230.021278
19-0.016195-0.16830.433331
20-0.175076-1.81940.035807
21-0.024359-0.25310.400317
22-0.148-1.53810.06348
230.0514250.53440.297072
24-0.076763-0.79770.213386
25-0.155175-1.61260.054872
260.0133170.13840.445094
270.0325570.33830.367882
280.0189630.19710.422073
290.0282760.29380.384719
300.0017990.01870.49256
31-0.013486-0.14010.444403
32-0.208783-2.16970.016109
33-0.003535-0.03670.48538
340.0079410.08250.467189
350.1011251.05090.14782
36-0.067798-0.70460.241295
37-0.144583-1.50250.067937
380.1015611.05550.146786
39-0.026178-0.2720.393052
40-0.045768-0.47560.317646
410.0321090.33370.369631
42-0.070755-0.73530.231873
430.0494170.51360.304307
44-0.137419-1.42810.078074
45-0.018545-0.19270.423766
46-0.052161-0.54210.294444
47-0.000562-0.00580.497677
48-0.024555-0.25520.399532
49-0.015535-0.16140.436023
50-0.057006-0.59240.277402
510.0080050.08320.466928
52-0.03216-0.33420.36943
53-0.009981-0.10370.458791
540.0481860.50080.308778
55-0.008154-0.08470.466314
56-0.082212-0.85440.197396
570.0357750.37180.355389
58-0.03338-0.34690.364673
59-0.025726-0.26740.394853
600.1042731.08360.14047


Parameters (Session):
par1 = 60 ; par2 = 1 ; par3 = 1 ; par4 = 1 ; par5 = 12 ;
Parameters (R input):
par1 = 60 ; par2 = 1 ; par3 = 1 ; par4 = 1 ; par5 = 12 ;
R code (references can be found in the software module):
if (par1 == 'Default') {
par1 = 10*log10(length(x))
} else {
par1 <- as.numeric(par1)
}
par2 <- as.numeric(par2)
par3 <- as.numeric(par3)
par4 <- as.numeric(par4)
par5 <- as.numeric(par5)
if (par2 == 0) {
x <- log(x)
} else {
x <- (x ^ par2 - 1) / par2
}
if (par3 > 0) x <- diff(x,lag=1,difference=par3)
if (par4 > 0) x <- diff(x,lag=par5,difference=par4)
bitmap(file='pic1.png')
racf <- acf(x,par1,main='Autocorrelation',xlab='lags',ylab='ACF')
dev.off()
bitmap(file='pic2.png')
rpacf <- pacf(x,par1,main='Partial Autocorrelation',xlab='lags',ylab='PACF')
dev.off()
(myacf <- c(racf$acf))
(mypacf <- c(rpacf$acf))
lengthx <- length(x)
sqrtn <- sqrt(lengthx)
load(file='createtable')
a<-table.start()
a<-table.row.start(a)
a<-table.element(a,'Autocorrelation Function',4,TRUE)
a<-table.row.end(a)
a<-table.row.start(a)
a<-table.element(a,'Time lag k',header=TRUE)
a<-table.element(a,hyperlink('basics.htm','ACF(k)','click here for more information about the Autocorrelation Function'),header=TRUE)
a<-table.element(a,'T-STAT',header=TRUE)
a<-table.element(a,'P-value',header=TRUE)
a<-table.row.end(a)
for (i in 2:(par1+1)) {
a<-table.row.start(a)
a<-table.element(a,i-1,header=TRUE)
a<-table.element(a,round(myacf[i],6))
mytstat <- myacf[i]*sqrtn
a<-table.element(a,round(mytstat,4))
a<-table.element(a,round(1-pt(abs(mytstat),lengthx),6))
a<-table.row.end(a)
}
a<-table.end(a)
table.save(a,file='mytable.tab')
a<-table.start()
a<-table.row.start(a)
a<-table.element(a,'Partial Autocorrelation Function',4,TRUE)
a<-table.row.end(a)
a<-table.row.start(a)
a<-table.element(a,'Time lag k',header=TRUE)
a<-table.element(a,hyperlink('basics.htm','PACF(k)','click here for more information about the Partial Autocorrelation Function'),header=TRUE)
a<-table.element(a,'T-STAT',header=TRUE)
a<-table.element(a,'P-value',header=TRUE)
a<-table.row.end(a)
for (i in 1:par1) {
a<-table.row.start(a)
a<-table.element(a,i,header=TRUE)
a<-table.element(a,round(mypacf[i],6))
mytstat <- mypacf[i]*sqrtn
a<-table.element(a,round(mytstat,4))
a<-table.element(a,round(1-pt(abs(mytstat),lengthx),6))
a<-table.row.end(a)
}
a<-table.end(a)
table.save(a,file='mytable1.tab')