Free Statistics

of Irreproducible Research!

Author's title

Author*Unverified author*
R Software Modulerwasp_autocorrelation.wasp
Title produced by software(Partial) Autocorrelation Function
Date of computationSun, 14 Dec 2008 04:12:33 -0700
Cite this page as followsStatistical Computations at FreeStatistics.org, Office for Research Development and Education, URL https://freestatistics.org/blog/index.php?v=date/2008/Dec/14/t1229253226lg4mcfc7ly7vgf4.htm/, Retrieved Thu, 16 May 2024 03:08:49 +0000
Statistical Computations at FreeStatistics.org, Office for Research Development and Education, URL https://freestatistics.org/blog/index.php?pk=33287, Retrieved Thu, 16 May 2024 03:08:49 +0000
QR Codes:

Original text written by user:
IsPrivate?No (this computation is public)
User-defined keywords
Estimated Impact156
Family? (F = Feedback message, R = changed R code, M = changed R Module, P = changed Parameters, D = changed Data)
-       [(Partial) Autocorrelation Function] [paper autocorrela...] [2008-12-14 11:12:33] [d41d8cd98f00b204e9800998ecf8427e] [Current]
Feedback Forum

Post a new message
Dataseries X:
6340.5
7901.5
8191.1
7181.7
7594.4
7384.7
7876.7
8463.4
8317.2
7778.7
8532.8
7272.2
6680.1
8427.6
8752.8
7952.7
8694.3
7787
8474.2
9154.7
8557.2
7951.1
9156.7
7865.7
7337.4
9131.7
8814.6
8598.8
8439.6
7451.8
8016.2
9544.1
8270.7
8102.2
9369
7657.7
7816.6
9391.3
9445.4
9533.1
10068.7
8955.5
10423.9
11617.2
9391.1
10872
10230.4
9221
9428.6
10934.5
10986
11724.6
11180.9
11163.2
11240.9
12107.1
10762.3
11340.4
11266.8
9542.7
9227.7
10571.9
10774.4
10392.8
9920.2
9884.9
10174.5
11395.4
10760.2
10570.1
10536
9902.6
8889
10837.3
11624.1
10509
10984.9
10649.1
10855.7
11677.4
10760.2
10046.2
10772.8
9987.7
8638.7
11063.7
11855.7
10684.5
11337.4
10478
11123.9
12909.3
11339.9
10462.2
12733.5
10519.2
10414.9
12476.8
12384.6
12266.7
12919.9
11497.3
12142
13919.4
12656.8
12034.1
13199.7
10881.3
11301.2
13643.9
12517
13981.1
14275.7
13435
13565.7
16216.3
12970
14079.9
14235
12213.4
12581


Summary of computational transaction
Raw Inputview raw input (R code)
Raw Outputview raw output of R engine
Computing time1 seconds
R Server'Gwilym Jenkins' @ 72.249.127.135

\begin{tabular}{lllllllll}
\hline
Summary of computational transaction \tabularnewline
Raw Input & view raw input (R code)  \tabularnewline
Raw Output & view raw output of R engine  \tabularnewline
Computing time & 1 seconds \tabularnewline
R Server & 'Gwilym Jenkins' @ 72.249.127.135 \tabularnewline
\hline
\end{tabular}
%Source: https://freestatistics.org/blog/index.php?pk=33287&T=0

[TABLE]
[ROW][C]Summary of computational transaction[/C][/ROW]
[ROW][C]Raw Input[/C][C]view raw input (R code) [/C][/ROW]
[ROW][C]Raw Output[/C][C]view raw output of R engine [/C][/ROW]
[ROW][C]Computing time[/C][C]1 seconds[/C][/ROW]
[ROW][C]R Server[/C][C]'Gwilym Jenkins' @ 72.249.127.135[/C][/ROW]
[/TABLE]
Source: https://freestatistics.org/blog/index.php?pk=33287&T=0

Globally Unique Identifier (entire table): ba.freestatistics.org/blog/index.php?pk=33287&T=0

As an alternative you can also use a QR Code:  

The GUIDs for individual cells are displayed in the table below:

Summary of computational transaction
Raw Inputview raw input (R code)
Raw Outputview raw output of R engine
Computing time1 seconds
R Server'Gwilym Jenkins' @ 72.249.127.135


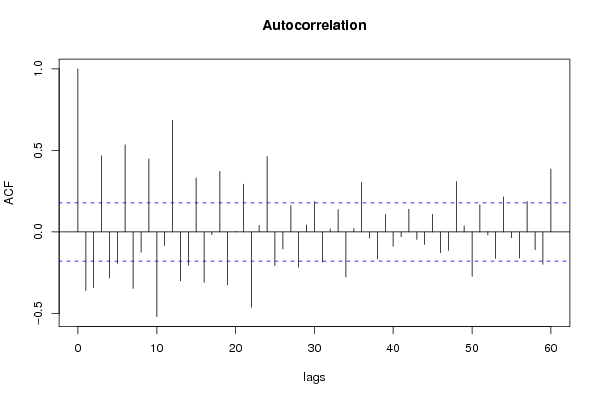
Autocorrelation Function
Time lag kACF(k)T-STATP-value
1-0.358524-3.92747.2e-05
2-0.341399-3.73980.000142
30.4670395.11621e-06
4-0.282642-3.09620.00122
5-0.192695-2.11090.01843
60.53425.85190
7-0.347078-3.8020.000114
8-0.124569-1.36460.087468
90.4478454.90591e-06
10-0.519907-5.69530
11-0.083192-0.91130.181976
120.6851697.50560
13-0.299973-3.2860.000666
14-0.203828-2.23280.013707
150.331023.62610.000212
16-0.309217-3.38730.000478
17-0.017196-0.18840.425453
180.3717444.07224.2e-05
19-0.325585-3.56660.00026
200.0029280.03210.487231
210.292563.20480.000866
22-0.462649-5.06811e-06
230.0398980.43710.331427
240.462455.06591e-06
25-0.206501-2.26210.012745
26-0.104561-1.14540.12716
270.1611331.76510.040043
28-0.216902-2.3760.009541
290.0426560.46730.320575
300.1862862.04070.021739
31-0.185992-2.03740.021903
320.0182610.20.420896
330.1362551.49260.069083
34-0.2761-3.02450.001523
350.0216870.23760.40631
360.3054893.34650.000547
37-0.037494-0.41070.341002
38-0.165576-1.81380.036104
390.106961.17170.121821
40-0.087638-0.960.169485
41-0.030308-0.3320.370232
420.1395191.52840.064529
43-0.046177-0.50580.306946
44-0.07653-0.83830.201753
450.1091231.19540.117147
46-0.128047-1.40270.081646
47-0.113004-1.23790.109086
480.3095243.39070.000472
490.0365120.40.344944
50-0.272599-2.98620.001713
510.1672891.83260.034674
52-0.01835-0.2010.420516
53-0.162638-1.78160.038671
540.2143542.34810.010252
55-0.036316-0.39780.345734
56-0.159843-1.7510.041251
570.1861692.03940.021804
58-0.109158-1.19580.117073
59-0.19872-2.17690.015724
600.3860174.22862.3e-05

\begin{tabular}{lllllllll}
\hline
Autocorrelation Function \tabularnewline
Time lag k & ACF(k) & T-STAT & P-value \tabularnewline
1 & -0.358524 & -3.9274 & 7.2e-05 \tabularnewline
2 & -0.341399 & -3.7398 & 0.000142 \tabularnewline
3 & 0.467039 & 5.1162 & 1e-06 \tabularnewline
4 & -0.282642 & -3.0962 & 0.00122 \tabularnewline
5 & -0.192695 & -2.1109 & 0.01843 \tabularnewline
6 & 0.5342 & 5.8519 & 0 \tabularnewline
7 & -0.347078 & -3.802 & 0.000114 \tabularnewline
8 & -0.124569 & -1.3646 & 0.087468 \tabularnewline
9 & 0.447845 & 4.9059 & 1e-06 \tabularnewline
10 & -0.519907 & -5.6953 & 0 \tabularnewline
11 & -0.083192 & -0.9113 & 0.181976 \tabularnewline
12 & 0.685169 & 7.5056 & 0 \tabularnewline
13 & -0.299973 & -3.286 & 0.000666 \tabularnewline
14 & -0.203828 & -2.2328 & 0.013707 \tabularnewline
15 & 0.33102 & 3.6261 & 0.000212 \tabularnewline
16 & -0.309217 & -3.3873 & 0.000478 \tabularnewline
17 & -0.017196 & -0.1884 & 0.425453 \tabularnewline
18 & 0.371744 & 4.0722 & 4.2e-05 \tabularnewline
19 & -0.325585 & -3.5666 & 0.00026 \tabularnewline
20 & 0.002928 & 0.0321 & 0.487231 \tabularnewline
21 & 0.29256 & 3.2048 & 0.000866 \tabularnewline
22 & -0.462649 & -5.0681 & 1e-06 \tabularnewline
23 & 0.039898 & 0.4371 & 0.331427 \tabularnewline
24 & 0.46245 & 5.0659 & 1e-06 \tabularnewline
25 & -0.206501 & -2.2621 & 0.012745 \tabularnewline
26 & -0.104561 & -1.1454 & 0.12716 \tabularnewline
27 & 0.161133 & 1.7651 & 0.040043 \tabularnewline
28 & -0.216902 & -2.376 & 0.009541 \tabularnewline
29 & 0.042656 & 0.4673 & 0.320575 \tabularnewline
30 & 0.186286 & 2.0407 & 0.021739 \tabularnewline
31 & -0.185992 & -2.0374 & 0.021903 \tabularnewline
32 & 0.018261 & 0.2 & 0.420896 \tabularnewline
33 & 0.136255 & 1.4926 & 0.069083 \tabularnewline
34 & -0.2761 & -3.0245 & 0.001523 \tabularnewline
35 & 0.021687 & 0.2376 & 0.40631 \tabularnewline
36 & 0.305489 & 3.3465 & 0.000547 \tabularnewline
37 & -0.037494 & -0.4107 & 0.341002 \tabularnewline
38 & -0.165576 & -1.8138 & 0.036104 \tabularnewline
39 & 0.10696 & 1.1717 & 0.121821 \tabularnewline
40 & -0.087638 & -0.96 & 0.169485 \tabularnewline
41 & -0.030308 & -0.332 & 0.370232 \tabularnewline
42 & 0.139519 & 1.5284 & 0.064529 \tabularnewline
43 & -0.046177 & -0.5058 & 0.306946 \tabularnewline
44 & -0.07653 & -0.8383 & 0.201753 \tabularnewline
45 & 0.109123 & 1.1954 & 0.117147 \tabularnewline
46 & -0.128047 & -1.4027 & 0.081646 \tabularnewline
47 & -0.113004 & -1.2379 & 0.109086 \tabularnewline
48 & 0.309524 & 3.3907 & 0.000472 \tabularnewline
49 & 0.036512 & 0.4 & 0.344944 \tabularnewline
50 & -0.272599 & -2.9862 & 0.001713 \tabularnewline
51 & 0.167289 & 1.8326 & 0.034674 \tabularnewline
52 & -0.01835 & -0.201 & 0.420516 \tabularnewline
53 & -0.162638 & -1.7816 & 0.038671 \tabularnewline
54 & 0.214354 & 2.3481 & 0.010252 \tabularnewline
55 & -0.036316 & -0.3978 & 0.345734 \tabularnewline
56 & -0.159843 & -1.751 & 0.041251 \tabularnewline
57 & 0.186169 & 2.0394 & 0.021804 \tabularnewline
58 & -0.109158 & -1.1958 & 0.117073 \tabularnewline
59 & -0.19872 & -2.1769 & 0.015724 \tabularnewline
60 & 0.386017 & 4.2286 & 2.3e-05 \tabularnewline
\hline
\end{tabular}
%Source: https://freestatistics.org/blog/index.php?pk=33287&T=1

[TABLE]
[ROW][C]Autocorrelation Function[/C][/ROW]
[ROW][C]Time lag k[/C][C]ACF(k)[/C][C]T-STAT[/C][C]P-value[/C][/ROW]
[ROW][C]1[/C][C]-0.358524[/C][C]-3.9274[/C][C]7.2e-05[/C][/ROW]
[ROW][C]2[/C][C]-0.341399[/C][C]-3.7398[/C][C]0.000142[/C][/ROW]
[ROW][C]3[/C][C]0.467039[/C][C]5.1162[/C][C]1e-06[/C][/ROW]
[ROW][C]4[/C][C]-0.282642[/C][C]-3.0962[/C][C]0.00122[/C][/ROW]
[ROW][C]5[/C][C]-0.192695[/C][C]-2.1109[/C][C]0.01843[/C][/ROW]
[ROW][C]6[/C][C]0.5342[/C][C]5.8519[/C][C]0[/C][/ROW]
[ROW][C]7[/C][C]-0.347078[/C][C]-3.802[/C][C]0.000114[/C][/ROW]
[ROW][C]8[/C][C]-0.124569[/C][C]-1.3646[/C][C]0.087468[/C][/ROW]
[ROW][C]9[/C][C]0.447845[/C][C]4.9059[/C][C]1e-06[/C][/ROW]
[ROW][C]10[/C][C]-0.519907[/C][C]-5.6953[/C][C]0[/C][/ROW]
[ROW][C]11[/C][C]-0.083192[/C][C]-0.9113[/C][C]0.181976[/C][/ROW]
[ROW][C]12[/C][C]0.685169[/C][C]7.5056[/C][C]0[/C][/ROW]
[ROW][C]13[/C][C]-0.299973[/C][C]-3.286[/C][C]0.000666[/C][/ROW]
[ROW][C]14[/C][C]-0.203828[/C][C]-2.2328[/C][C]0.013707[/C][/ROW]
[ROW][C]15[/C][C]0.33102[/C][C]3.6261[/C][C]0.000212[/C][/ROW]
[ROW][C]16[/C][C]-0.309217[/C][C]-3.3873[/C][C]0.000478[/C][/ROW]
[ROW][C]17[/C][C]-0.017196[/C][C]-0.1884[/C][C]0.425453[/C][/ROW]
[ROW][C]18[/C][C]0.371744[/C][C]4.0722[/C][C]4.2e-05[/C][/ROW]
[ROW][C]19[/C][C]-0.325585[/C][C]-3.5666[/C][C]0.00026[/C][/ROW]
[ROW][C]20[/C][C]0.002928[/C][C]0.0321[/C][C]0.487231[/C][/ROW]
[ROW][C]21[/C][C]0.29256[/C][C]3.2048[/C][C]0.000866[/C][/ROW]
[ROW][C]22[/C][C]-0.462649[/C][C]-5.0681[/C][C]1e-06[/C][/ROW]
[ROW][C]23[/C][C]0.039898[/C][C]0.4371[/C][C]0.331427[/C][/ROW]
[ROW][C]24[/C][C]0.46245[/C][C]5.0659[/C][C]1e-06[/C][/ROW]
[ROW][C]25[/C][C]-0.206501[/C][C]-2.2621[/C][C]0.012745[/C][/ROW]
[ROW][C]26[/C][C]-0.104561[/C][C]-1.1454[/C][C]0.12716[/C][/ROW]
[ROW][C]27[/C][C]0.161133[/C][C]1.7651[/C][C]0.040043[/C][/ROW]
[ROW][C]28[/C][C]-0.216902[/C][C]-2.376[/C][C]0.009541[/C][/ROW]
[ROW][C]29[/C][C]0.042656[/C][C]0.4673[/C][C]0.320575[/C][/ROW]
[ROW][C]30[/C][C]0.186286[/C][C]2.0407[/C][C]0.021739[/C][/ROW]
[ROW][C]31[/C][C]-0.185992[/C][C]-2.0374[/C][C]0.021903[/C][/ROW]
[ROW][C]32[/C][C]0.018261[/C][C]0.2[/C][C]0.420896[/C][/ROW]
[ROW][C]33[/C][C]0.136255[/C][C]1.4926[/C][C]0.069083[/C][/ROW]
[ROW][C]34[/C][C]-0.2761[/C][C]-3.0245[/C][C]0.001523[/C][/ROW]
[ROW][C]35[/C][C]0.021687[/C][C]0.2376[/C][C]0.40631[/C][/ROW]
[ROW][C]36[/C][C]0.305489[/C][C]3.3465[/C][C]0.000547[/C][/ROW]
[ROW][C]37[/C][C]-0.037494[/C][C]-0.4107[/C][C]0.341002[/C][/ROW]
[ROW][C]38[/C][C]-0.165576[/C][C]-1.8138[/C][C]0.036104[/C][/ROW]
[ROW][C]39[/C][C]0.10696[/C][C]1.1717[/C][C]0.121821[/C][/ROW]
[ROW][C]40[/C][C]-0.087638[/C][C]-0.96[/C][C]0.169485[/C][/ROW]
[ROW][C]41[/C][C]-0.030308[/C][C]-0.332[/C][C]0.370232[/C][/ROW]
[ROW][C]42[/C][C]0.139519[/C][C]1.5284[/C][C]0.064529[/C][/ROW]
[ROW][C]43[/C][C]-0.046177[/C][C]-0.5058[/C][C]0.306946[/C][/ROW]
[ROW][C]44[/C][C]-0.07653[/C][C]-0.8383[/C][C]0.201753[/C][/ROW]
[ROW][C]45[/C][C]0.109123[/C][C]1.1954[/C][C]0.117147[/C][/ROW]
[ROW][C]46[/C][C]-0.128047[/C][C]-1.4027[/C][C]0.081646[/C][/ROW]
[ROW][C]47[/C][C]-0.113004[/C][C]-1.2379[/C][C]0.109086[/C][/ROW]
[ROW][C]48[/C][C]0.309524[/C][C]3.3907[/C][C]0.000472[/C][/ROW]
[ROW][C]49[/C][C]0.036512[/C][C]0.4[/C][C]0.344944[/C][/ROW]
[ROW][C]50[/C][C]-0.272599[/C][C]-2.9862[/C][C]0.001713[/C][/ROW]
[ROW][C]51[/C][C]0.167289[/C][C]1.8326[/C][C]0.034674[/C][/ROW]
[ROW][C]52[/C][C]-0.01835[/C][C]-0.201[/C][C]0.420516[/C][/ROW]
[ROW][C]53[/C][C]-0.162638[/C][C]-1.7816[/C][C]0.038671[/C][/ROW]
[ROW][C]54[/C][C]0.214354[/C][C]2.3481[/C][C]0.010252[/C][/ROW]
[ROW][C]55[/C][C]-0.036316[/C][C]-0.3978[/C][C]0.345734[/C][/ROW]
[ROW][C]56[/C][C]-0.159843[/C][C]-1.751[/C][C]0.041251[/C][/ROW]
[ROW][C]57[/C][C]0.186169[/C][C]2.0394[/C][C]0.021804[/C][/ROW]
[ROW][C]58[/C][C]-0.109158[/C][C]-1.1958[/C][C]0.117073[/C][/ROW]
[ROW][C]59[/C][C]-0.19872[/C][C]-2.1769[/C][C]0.015724[/C][/ROW]
[ROW][C]60[/C][C]0.386017[/C][C]4.2286[/C][C]2.3e-05[/C][/ROW]
[/TABLE]
Source: https://freestatistics.org/blog/index.php?pk=33287&T=1

Globally Unique Identifier (entire table): ba.freestatistics.org/blog/index.php?pk=33287&T=1

As an alternative you can also use a QR Code:  

The GUIDs for individual cells are displayed in the table below:

Autocorrelation Function
Time lag kACF(k)T-STATP-value
1-0.358524-3.92747.2e-05
2-0.341399-3.73980.000142
30.4670395.11621e-06
4-0.282642-3.09620.00122
5-0.192695-2.11090.01843
60.53425.85190
7-0.347078-3.8020.000114
8-0.124569-1.36460.087468
90.4478454.90591e-06
10-0.519907-5.69530
11-0.083192-0.91130.181976
120.6851697.50560
13-0.299973-3.2860.000666
14-0.203828-2.23280.013707
150.331023.62610.000212
16-0.309217-3.38730.000478
17-0.017196-0.18840.425453
180.3717444.07224.2e-05
19-0.325585-3.56660.00026
200.0029280.03210.487231
210.292563.20480.000866
22-0.462649-5.06811e-06
230.0398980.43710.331427
240.462455.06591e-06
25-0.206501-2.26210.012745
26-0.104561-1.14540.12716
270.1611331.76510.040043
28-0.216902-2.3760.009541
290.0426560.46730.320575
300.1862862.04070.021739
31-0.185992-2.03740.021903
320.0182610.20.420896
330.1362551.49260.069083
34-0.2761-3.02450.001523
350.0216870.23760.40631
360.3054893.34650.000547
37-0.037494-0.41070.341002
38-0.165576-1.81380.036104
390.106961.17170.121821
40-0.087638-0.960.169485
41-0.030308-0.3320.370232
420.1395191.52840.064529
43-0.046177-0.50580.306946
44-0.07653-0.83830.201753
450.1091231.19540.117147
46-0.128047-1.40270.081646
47-0.113004-1.23790.109086
480.3095243.39070.000472
490.0365120.40.344944
50-0.272599-2.98620.001713
510.1672891.83260.034674
52-0.01835-0.2010.420516
53-0.162638-1.78160.038671
540.2143542.34810.010252
55-0.036316-0.39780.345734
56-0.159843-1.7510.041251
570.1861692.03940.021804
58-0.109158-1.19580.117073
59-0.19872-2.17690.015724
600.3860174.22862.3e-05


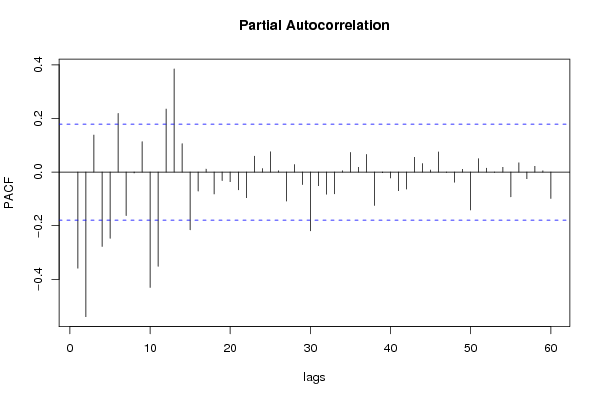
Partial Autocorrelation Function
Time lag kPACF(k)T-STATP-value
1-0.358524-3.92747.2e-05
2-0.539254-5.90720
30.1380141.51190.066599
4-0.277563-3.04050.00145
5-0.246863-2.70420.003921
60.2186892.39560.009069
7-0.162385-1.77880.038899
8-0.002932-0.03210.487217
90.1132311.24040.108627
10-0.430087-4.71143e-06
11-0.351264-3.84799.6e-05
120.2349782.57410.005634
130.3847524.21472.4e-05
140.105921.16030.124115
15-0.215403-2.35960.009954
16-0.070731-0.77480.219987
170.0110720.12130.451831
18-0.081383-0.89150.18722
19-0.031598-0.34610.364923
20-0.035883-0.39310.347479
21-0.065911-0.7220.235844
22-0.095452-1.04560.148917
230.0594280.6510.258146
240.0132230.14490.442534
250.0756630.82880.20442
260.0047270.05180.479396
27-0.107925-1.18230.119721
280.0280930.30770.379404
29-0.046746-0.51210.304769
30-0.219133-2.40050.008955
31-0.050565-0.55390.290336
32-0.082563-0.90440.183789
33-0.081204-0.88950.187744
340.0048060.05260.479052
350.0734180.80430.21142
360.0179780.19690.422103
370.0660310.72330.235442
38-0.124456-1.36330.087664
39-0.00237-0.0260.489665
40-0.021995-0.24090.405007
41-0.069525-0.76160.223894
42-0.063468-0.69530.24412
430.0552530.60530.273073
440.0319310.34980.363557
450.0077890.08530.466072
460.0751630.82340.205966
47-0.001428-0.01560.493774
48-0.0377-0.4130.340178
490.0106150.11630.453814
50-0.141012-1.54470.062525
510.0497880.54540.293245
520.0145550.15940.436794
53-0.000701-0.00770.496942
540.0178360.19540.422713
55-0.092141-1.00930.157419
560.0346630.37970.352415
57-0.024633-0.26980.393874
580.0214340.23480.407383
590.0047230.05170.479414
60-0.098125-1.07490.142288

\begin{tabular}{lllllllll}
\hline
Partial Autocorrelation Function \tabularnewline
Time lag k & PACF(k) & T-STAT & P-value \tabularnewline
1 & -0.358524 & -3.9274 & 7.2e-05 \tabularnewline
2 & -0.539254 & -5.9072 & 0 \tabularnewline
3 & 0.138014 & 1.5119 & 0.066599 \tabularnewline
4 & -0.277563 & -3.0405 & 0.00145 \tabularnewline
5 & -0.246863 & -2.7042 & 0.003921 \tabularnewline
6 & 0.218689 & 2.3956 & 0.009069 \tabularnewline
7 & -0.162385 & -1.7788 & 0.038899 \tabularnewline
8 & -0.002932 & -0.0321 & 0.487217 \tabularnewline
9 & 0.113231 & 1.2404 & 0.108627 \tabularnewline
10 & -0.430087 & -4.7114 & 3e-06 \tabularnewline
11 & -0.351264 & -3.8479 & 9.6e-05 \tabularnewline
12 & 0.234978 & 2.5741 & 0.005634 \tabularnewline
13 & 0.384752 & 4.2147 & 2.4e-05 \tabularnewline
14 & 0.10592 & 1.1603 & 0.124115 \tabularnewline
15 & -0.215403 & -2.3596 & 0.009954 \tabularnewline
16 & -0.070731 & -0.7748 & 0.219987 \tabularnewline
17 & 0.011072 & 0.1213 & 0.451831 \tabularnewline
18 & -0.081383 & -0.8915 & 0.18722 \tabularnewline
19 & -0.031598 & -0.3461 & 0.364923 \tabularnewline
20 & -0.035883 & -0.3931 & 0.347479 \tabularnewline
21 & -0.065911 & -0.722 & 0.235844 \tabularnewline
22 & -0.095452 & -1.0456 & 0.148917 \tabularnewline
23 & 0.059428 & 0.651 & 0.258146 \tabularnewline
24 & 0.013223 & 0.1449 & 0.442534 \tabularnewline
25 & 0.075663 & 0.8288 & 0.20442 \tabularnewline
26 & 0.004727 & 0.0518 & 0.479396 \tabularnewline
27 & -0.107925 & -1.1823 & 0.119721 \tabularnewline
28 & 0.028093 & 0.3077 & 0.379404 \tabularnewline
29 & -0.046746 & -0.5121 & 0.304769 \tabularnewline
30 & -0.219133 & -2.4005 & 0.008955 \tabularnewline
31 & -0.050565 & -0.5539 & 0.290336 \tabularnewline
32 & -0.082563 & -0.9044 & 0.183789 \tabularnewline
33 & -0.081204 & -0.8895 & 0.187744 \tabularnewline
34 & 0.004806 & 0.0526 & 0.479052 \tabularnewline
35 & 0.073418 & 0.8043 & 0.21142 \tabularnewline
36 & 0.017978 & 0.1969 & 0.422103 \tabularnewline
37 & 0.066031 & 0.7233 & 0.235442 \tabularnewline
38 & -0.124456 & -1.3633 & 0.087664 \tabularnewline
39 & -0.00237 & -0.026 & 0.489665 \tabularnewline
40 & -0.021995 & -0.2409 & 0.405007 \tabularnewline
41 & -0.069525 & -0.7616 & 0.223894 \tabularnewline
42 & -0.063468 & -0.6953 & 0.24412 \tabularnewline
43 & 0.055253 & 0.6053 & 0.273073 \tabularnewline
44 & 0.031931 & 0.3498 & 0.363557 \tabularnewline
45 & 0.007789 & 0.0853 & 0.466072 \tabularnewline
46 & 0.075163 & 0.8234 & 0.205966 \tabularnewline
47 & -0.001428 & -0.0156 & 0.493774 \tabularnewline
48 & -0.0377 & -0.413 & 0.340178 \tabularnewline
49 & 0.010615 & 0.1163 & 0.453814 \tabularnewline
50 & -0.141012 & -1.5447 & 0.062525 \tabularnewline
51 & 0.049788 & 0.5454 & 0.293245 \tabularnewline
52 & 0.014555 & 0.1594 & 0.436794 \tabularnewline
53 & -0.000701 & -0.0077 & 0.496942 \tabularnewline
54 & 0.017836 & 0.1954 & 0.422713 \tabularnewline
55 & -0.092141 & -1.0093 & 0.157419 \tabularnewline
56 & 0.034663 & 0.3797 & 0.352415 \tabularnewline
57 & -0.024633 & -0.2698 & 0.393874 \tabularnewline
58 & 0.021434 & 0.2348 & 0.407383 \tabularnewline
59 & 0.004723 & 0.0517 & 0.479414 \tabularnewline
60 & -0.098125 & -1.0749 & 0.142288 \tabularnewline
\hline
\end{tabular}
%Source: https://freestatistics.org/blog/index.php?pk=33287&T=2

[TABLE]
[ROW][C]Partial Autocorrelation Function[/C][/ROW]
[ROW][C]Time lag k[/C][C]PACF(k)[/C][C]T-STAT[/C][C]P-value[/C][/ROW]
[ROW][C]1[/C][C]-0.358524[/C][C]-3.9274[/C][C]7.2e-05[/C][/ROW]
[ROW][C]2[/C][C]-0.539254[/C][C]-5.9072[/C][C]0[/C][/ROW]
[ROW][C]3[/C][C]0.138014[/C][C]1.5119[/C][C]0.066599[/C][/ROW]
[ROW][C]4[/C][C]-0.277563[/C][C]-3.0405[/C][C]0.00145[/C][/ROW]
[ROW][C]5[/C][C]-0.246863[/C][C]-2.7042[/C][C]0.003921[/C][/ROW]
[ROW][C]6[/C][C]0.218689[/C][C]2.3956[/C][C]0.009069[/C][/ROW]
[ROW][C]7[/C][C]-0.162385[/C][C]-1.7788[/C][C]0.038899[/C][/ROW]
[ROW][C]8[/C][C]-0.002932[/C][C]-0.0321[/C][C]0.487217[/C][/ROW]
[ROW][C]9[/C][C]0.113231[/C][C]1.2404[/C][C]0.108627[/C][/ROW]
[ROW][C]10[/C][C]-0.430087[/C][C]-4.7114[/C][C]3e-06[/C][/ROW]
[ROW][C]11[/C][C]-0.351264[/C][C]-3.8479[/C][C]9.6e-05[/C][/ROW]
[ROW][C]12[/C][C]0.234978[/C][C]2.5741[/C][C]0.005634[/C][/ROW]
[ROW][C]13[/C][C]0.384752[/C][C]4.2147[/C][C]2.4e-05[/C][/ROW]
[ROW][C]14[/C][C]0.10592[/C][C]1.1603[/C][C]0.124115[/C][/ROW]
[ROW][C]15[/C][C]-0.215403[/C][C]-2.3596[/C][C]0.009954[/C][/ROW]
[ROW][C]16[/C][C]-0.070731[/C][C]-0.7748[/C][C]0.219987[/C][/ROW]
[ROW][C]17[/C][C]0.011072[/C][C]0.1213[/C][C]0.451831[/C][/ROW]
[ROW][C]18[/C][C]-0.081383[/C][C]-0.8915[/C][C]0.18722[/C][/ROW]
[ROW][C]19[/C][C]-0.031598[/C][C]-0.3461[/C][C]0.364923[/C][/ROW]
[ROW][C]20[/C][C]-0.035883[/C][C]-0.3931[/C][C]0.347479[/C][/ROW]
[ROW][C]21[/C][C]-0.065911[/C][C]-0.722[/C][C]0.235844[/C][/ROW]
[ROW][C]22[/C][C]-0.095452[/C][C]-1.0456[/C][C]0.148917[/C][/ROW]
[ROW][C]23[/C][C]0.059428[/C][C]0.651[/C][C]0.258146[/C][/ROW]
[ROW][C]24[/C][C]0.013223[/C][C]0.1449[/C][C]0.442534[/C][/ROW]
[ROW][C]25[/C][C]0.075663[/C][C]0.8288[/C][C]0.20442[/C][/ROW]
[ROW][C]26[/C][C]0.004727[/C][C]0.0518[/C][C]0.479396[/C][/ROW]
[ROW][C]27[/C][C]-0.107925[/C][C]-1.1823[/C][C]0.119721[/C][/ROW]
[ROW][C]28[/C][C]0.028093[/C][C]0.3077[/C][C]0.379404[/C][/ROW]
[ROW][C]29[/C][C]-0.046746[/C][C]-0.5121[/C][C]0.304769[/C][/ROW]
[ROW][C]30[/C][C]-0.219133[/C][C]-2.4005[/C][C]0.008955[/C][/ROW]
[ROW][C]31[/C][C]-0.050565[/C][C]-0.5539[/C][C]0.290336[/C][/ROW]
[ROW][C]32[/C][C]-0.082563[/C][C]-0.9044[/C][C]0.183789[/C][/ROW]
[ROW][C]33[/C][C]-0.081204[/C][C]-0.8895[/C][C]0.187744[/C][/ROW]
[ROW][C]34[/C][C]0.004806[/C][C]0.0526[/C][C]0.479052[/C][/ROW]
[ROW][C]35[/C][C]0.073418[/C][C]0.8043[/C][C]0.21142[/C][/ROW]
[ROW][C]36[/C][C]0.017978[/C][C]0.1969[/C][C]0.422103[/C][/ROW]
[ROW][C]37[/C][C]0.066031[/C][C]0.7233[/C][C]0.235442[/C][/ROW]
[ROW][C]38[/C][C]-0.124456[/C][C]-1.3633[/C][C]0.087664[/C][/ROW]
[ROW][C]39[/C][C]-0.00237[/C][C]-0.026[/C][C]0.489665[/C][/ROW]
[ROW][C]40[/C][C]-0.021995[/C][C]-0.2409[/C][C]0.405007[/C][/ROW]
[ROW][C]41[/C][C]-0.069525[/C][C]-0.7616[/C][C]0.223894[/C][/ROW]
[ROW][C]42[/C][C]-0.063468[/C][C]-0.6953[/C][C]0.24412[/C][/ROW]
[ROW][C]43[/C][C]0.055253[/C][C]0.6053[/C][C]0.273073[/C][/ROW]
[ROW][C]44[/C][C]0.031931[/C][C]0.3498[/C][C]0.363557[/C][/ROW]
[ROW][C]45[/C][C]0.007789[/C][C]0.0853[/C][C]0.466072[/C][/ROW]
[ROW][C]46[/C][C]0.075163[/C][C]0.8234[/C][C]0.205966[/C][/ROW]
[ROW][C]47[/C][C]-0.001428[/C][C]-0.0156[/C][C]0.493774[/C][/ROW]
[ROW][C]48[/C][C]-0.0377[/C][C]-0.413[/C][C]0.340178[/C][/ROW]
[ROW][C]49[/C][C]0.010615[/C][C]0.1163[/C][C]0.453814[/C][/ROW]
[ROW][C]50[/C][C]-0.141012[/C][C]-1.5447[/C][C]0.062525[/C][/ROW]
[ROW][C]51[/C][C]0.049788[/C][C]0.5454[/C][C]0.293245[/C][/ROW]
[ROW][C]52[/C][C]0.014555[/C][C]0.1594[/C][C]0.436794[/C][/ROW]
[ROW][C]53[/C][C]-0.000701[/C][C]-0.0077[/C][C]0.496942[/C][/ROW]
[ROW][C]54[/C][C]0.017836[/C][C]0.1954[/C][C]0.422713[/C][/ROW]
[ROW][C]55[/C][C]-0.092141[/C][C]-1.0093[/C][C]0.157419[/C][/ROW]
[ROW][C]56[/C][C]0.034663[/C][C]0.3797[/C][C]0.352415[/C][/ROW]
[ROW][C]57[/C][C]-0.024633[/C][C]-0.2698[/C][C]0.393874[/C][/ROW]
[ROW][C]58[/C][C]0.021434[/C][C]0.2348[/C][C]0.407383[/C][/ROW]
[ROW][C]59[/C][C]0.004723[/C][C]0.0517[/C][C]0.479414[/C][/ROW]
[ROW][C]60[/C][C]-0.098125[/C][C]-1.0749[/C][C]0.142288[/C][/ROW]
[/TABLE]
Source: https://freestatistics.org/blog/index.php?pk=33287&T=2

Globally Unique Identifier (entire table): ba.freestatistics.org/blog/index.php?pk=33287&T=2

As an alternative you can also use a QR Code:  

The GUIDs for individual cells are displayed in the table below:

Partial Autocorrelation Function
Time lag kPACF(k)T-STATP-value
1-0.358524-3.92747.2e-05
2-0.539254-5.90720
30.1380141.51190.066599
4-0.277563-3.04050.00145
5-0.246863-2.70420.003921
60.2186892.39560.009069
7-0.162385-1.77880.038899
8-0.002932-0.03210.487217
90.1132311.24040.108627
10-0.430087-4.71143e-06
11-0.351264-3.84799.6e-05
120.2349782.57410.005634
130.3847524.21472.4e-05
140.105921.16030.124115
15-0.215403-2.35960.009954
16-0.070731-0.77480.219987
170.0110720.12130.451831
18-0.081383-0.89150.18722
19-0.031598-0.34610.364923
20-0.035883-0.39310.347479
21-0.065911-0.7220.235844
22-0.095452-1.04560.148917
230.0594280.6510.258146
240.0132230.14490.442534
250.0756630.82880.20442
260.0047270.05180.479396
27-0.107925-1.18230.119721
280.0280930.30770.379404
29-0.046746-0.51210.304769
30-0.219133-2.40050.008955
31-0.050565-0.55390.290336
32-0.082563-0.90440.183789
33-0.081204-0.88950.187744
340.0048060.05260.479052
350.0734180.80430.21142
360.0179780.19690.422103
370.0660310.72330.235442
38-0.124456-1.36330.087664
39-0.00237-0.0260.489665
40-0.021995-0.24090.405007
41-0.069525-0.76160.223894
42-0.063468-0.69530.24412
430.0552530.60530.273073
440.0319310.34980.363557
450.0077890.08530.466072
460.0751630.82340.205966
47-0.001428-0.01560.493774
48-0.0377-0.4130.340178
490.0106150.11630.453814
50-0.141012-1.54470.062525
510.0497880.54540.293245
520.0145550.15940.436794
53-0.000701-0.00770.496942
540.0178360.19540.422713
55-0.092141-1.00930.157419
560.0346630.37970.352415
57-0.024633-0.26980.393874
580.0214340.23480.407383
590.0047230.05170.479414
60-0.098125-1.07490.142288


Parameters (Session):
par1 = 60 ; par2 = 1 ; par3 = 1 ; par4 = 0 ; par5 = 12 ;
Parameters (R input):
par1 = 60 ; par2 = 1 ; par3 = 1 ; par4 = 0 ; par5 = 12 ;
R code (references can be found in the software module):
if (par1 == 'Default') {
par1 = 10*log10(length(x))
} else {
par1 <- as.numeric(par1)
}
par2 <- as.numeric(par2)
par3 <- as.numeric(par3)
par4 <- as.numeric(par4)
par5 <- as.numeric(par5)
if (par2 == 0) {
x <- log(x)
} else {
x <- (x ^ par2 - 1) / par2
}
if (par3 > 0) x <- diff(x,lag=1,difference=par3)
if (par4 > 0) x <- diff(x,lag=par5,difference=par4)
bitmap(file='pic1.png')
racf <- acf(x,par1,main='Autocorrelation',xlab='lags',ylab='ACF')
dev.off()
bitmap(file='pic2.png')
rpacf <- pacf(x,par1,main='Partial Autocorrelation',xlab='lags',ylab='PACF')
dev.off()
(myacf <- c(racf$acf))
(mypacf <- c(rpacf$acf))
lengthx <- length(x)
sqrtn <- sqrt(lengthx)
load(file='createtable')
a<-table.start()
a<-table.row.start(a)
a<-table.element(a,'Autocorrelation Function',4,TRUE)
a<-table.row.end(a)
a<-table.row.start(a)
a<-table.element(a,'Time lag k',header=TRUE)
a<-table.element(a,hyperlink('basics.htm','ACF(k)','click here for more information about the Autocorrelation Function'),header=TRUE)
a<-table.element(a,'T-STAT',header=TRUE)
a<-table.element(a,'P-value',header=TRUE)
a<-table.row.end(a)
for (i in 2:(par1+1)) {
a<-table.row.start(a)
a<-table.element(a,i-1,header=TRUE)
a<-table.element(a,round(myacf[i],6))
mytstat <- myacf[i]*sqrtn
a<-table.element(a,round(mytstat,4))
a<-table.element(a,round(1-pt(abs(mytstat),lengthx),6))
a<-table.row.end(a)
}
a<-table.end(a)
table.save(a,file='mytable.tab')
a<-table.start()
a<-table.row.start(a)
a<-table.element(a,'Partial Autocorrelation Function',4,TRUE)
a<-table.row.end(a)
a<-table.row.start(a)
a<-table.element(a,'Time lag k',header=TRUE)
a<-table.element(a,hyperlink('basics.htm','PACF(k)','click here for more information about the Partial Autocorrelation Function'),header=TRUE)
a<-table.element(a,'T-STAT',header=TRUE)
a<-table.element(a,'P-value',header=TRUE)
a<-table.row.end(a)
for (i in 1:par1) {
a<-table.row.start(a)
a<-table.element(a,i,header=TRUE)
a<-table.element(a,round(mypacf[i],6))
mytstat <- mypacf[i]*sqrtn
a<-table.element(a,round(mytstat,4))
a<-table.element(a,round(1-pt(abs(mytstat),lengthx),6))
a<-table.row.end(a)
}
a<-table.end(a)
table.save(a,file='mytable1.tab')