Free Statistics

of Irreproducible Research!

Author's title

Author*Unverified author*
R Software Modulerwasp_autocorrelation.wasp
Title produced by software(Partial) Autocorrelation Function
Date of computationSun, 14 Dec 2008 04:10:58 -0700
Cite this page as followsStatistical Computations at FreeStatistics.org, Office for Research Development and Education, URL https://freestatistics.org/blog/index.php?v=date/2008/Dec/14/t1229253098gxb27zcwsqr4m7n.htm/, Retrieved Wed, 15 May 2024 02:32:09 +0000
Statistical Computations at FreeStatistics.org, Office for Research Development and Education, URL https://freestatistics.org/blog/index.php?pk=33285, Retrieved Wed, 15 May 2024 02:32:09 +0000
QR Codes:

Original text written by user:
IsPrivate?No (this computation is public)
User-defined keywords
Estimated Impact159
Family? (F = Feedback message, R = changed R code, M = changed R Module, P = changed Parameters, D = changed Data)
-       [(Partial) Autocorrelation Function] [paper autocorrela...] [2008-12-14 11:10:58] [d41d8cd98f00b204e9800998ecf8427e] [Current]
Feedback Forum

Post a new message
Dataseries X:
6340.5
7901.5
8191.1
7181.7
7594.4
7384.7
7876.7
8463.4
8317.2
7778.7
8532.8
7272.2
6680.1
8427.6
8752.8
7952.7
8694.3
7787
8474.2
9154.7
8557.2
7951.1
9156.7
7865.7
7337.4
9131.7
8814.6
8598.8
8439.6
7451.8
8016.2
9544.1
8270.7
8102.2
9369
7657.7
7816.6
9391.3
9445.4
9533.1
10068.7
8955.5
10423.9
11617.2
9391.1
10872
10230.4
9221
9428.6
10934.5
10986
11724.6
11180.9
11163.2
11240.9
12107.1
10762.3
11340.4
11266.8
9542.7
9227.7
10571.9
10774.4
10392.8
9920.2
9884.9
10174.5
11395.4
10760.2
10570.1
10536
9902.6
8889
10837.3
11624.1
10509
10984.9
10649.1
10855.7
11677.4
10760.2
10046.2
10772.8
9987.7
8638.7
11063.7
11855.7
10684.5
11337.4
10478
11123.9
12909.3
11339.9
10462.2
12733.5
10519.2
10414.9
12476.8
12384.6
12266.7
12919.9
11497.3
12142
13919.4
12656.8
12034.1
13199.7
10881.3
11301.2
13643.9
12517
13981.1
14275.7
13435
13565.7
16216.3
12970
14079.9
14235
12213.4
12581


Summary of computational transaction
Raw Inputview raw input (R code)
Raw Outputview raw output of R engine
Computing time1 seconds
R Server'Gwilym Jenkins' @ 72.249.127.135

\begin{tabular}{lllllllll}
\hline
Summary of computational transaction \tabularnewline
Raw Input & view raw input (R code)  \tabularnewline
Raw Output & view raw output of R engine  \tabularnewline
Computing time & 1 seconds \tabularnewline
R Server & 'Gwilym Jenkins' @ 72.249.127.135 \tabularnewline
\hline
\end{tabular}
%Source: https://freestatistics.org/blog/index.php?pk=33285&T=0

[TABLE]
[ROW][C]Summary of computational transaction[/C][/ROW]
[ROW][C]Raw Input[/C][C]view raw input (R code) [/C][/ROW]
[ROW][C]Raw Output[/C][C]view raw output of R engine [/C][/ROW]
[ROW][C]Computing time[/C][C]1 seconds[/C][/ROW]
[ROW][C]R Server[/C][C]'Gwilym Jenkins' @ 72.249.127.135[/C][/ROW]
[/TABLE]
Source: https://freestatistics.org/blog/index.php?pk=33285&T=0

Globally Unique Identifier (entire table): ba.freestatistics.org/blog/index.php?pk=33285&T=0

As an alternative you can also use a QR Code:  

The GUIDs for individual cells are displayed in the table below:

Summary of computational transaction
Raw Inputview raw input (R code)
Raw Outputview raw output of R engine
Computing time1 seconds
R Server'Gwilym Jenkins' @ 72.249.127.135


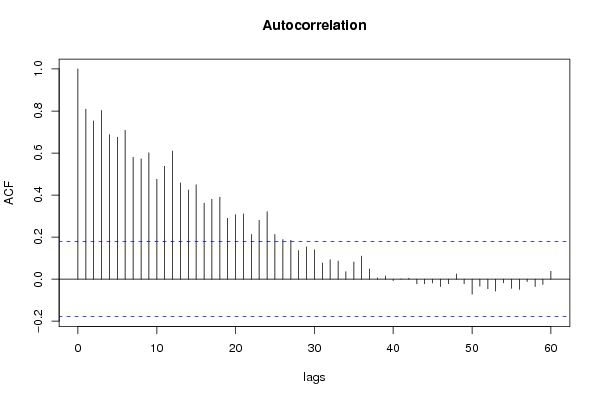
Autocorrelation Function
Time lag kACF(k)T-STATP-value
10.8087078.89580
20.7527728.28050
30.8028968.83190
40.6875057.56260
50.6754617.43010
60.708687.79550
70.5799266.37920
80.572746.30010
90.6010186.61120
100.475145.22650
110.537075.90780
120.6091986.70120
130.4576715.03441e-06
140.4239414.66334e-06
150.4490934.941e-06
160.3615333.97696e-05
170.3804824.18532.7e-05
180.389954.28951.8e-05
190.2893753.18310.000926
200.3068253.37510.000496
210.3101783.4120.000439
220.2127772.34050.010446
230.2800233.08020.00128
240.3213033.53430.00029
250.2128252.34110.010432
260.1886352.0750.020054
270.1848752.03360.022088
280.1362951.49920.068208
290.1540551.69460.046362
300.1400171.54020.063063
310.0770340.84740.19923
320.0929081.0220.154412
330.0864740.95120.171697
340.0356790.39250.3477
350.0822460.90470.18371
360.1097561.20730.114833
370.0482330.53060.298347
380.0061390.06750.473135
390.0156670.17230.43173
40-0.006498-0.07150.471569
410.0015320.01690.493292
420.0046450.05110.479667
43-0.022124-0.24340.404066
44-0.021934-0.24130.404876
45-0.017993-0.19790.42172
46-0.035309-0.38840.3492
47-0.021478-0.23630.406818
480.0247750.27250.392843
49-0.021249-0.23370.40779
50-0.071446-0.78590.216728
51-0.033276-0.3660.357487
52-0.044965-0.49460.310883
53-0.056554-0.62210.267526
54-0.017348-0.19080.424489
55-0.043326-0.47660.317257
56-0.048059-0.52860.29901
57-0.011571-0.12730.449463
58-0.03497-0.38470.35058
59-0.024658-0.27120.393333
600.0375030.41250.340339

\begin{tabular}{lllllllll}
\hline
Autocorrelation Function \tabularnewline
Time lag k & ACF(k) & T-STAT & P-value \tabularnewline
1 & 0.808707 & 8.8958 & 0 \tabularnewline
2 & 0.752772 & 8.2805 & 0 \tabularnewline
3 & 0.802896 & 8.8319 & 0 \tabularnewline
4 & 0.687505 & 7.5626 & 0 \tabularnewline
5 & 0.675461 & 7.4301 & 0 \tabularnewline
6 & 0.70868 & 7.7955 & 0 \tabularnewline
7 & 0.579926 & 6.3792 & 0 \tabularnewline
8 & 0.57274 & 6.3001 & 0 \tabularnewline
9 & 0.601018 & 6.6112 & 0 \tabularnewline
10 & 0.47514 & 5.2265 & 0 \tabularnewline
11 & 0.53707 & 5.9078 & 0 \tabularnewline
12 & 0.609198 & 6.7012 & 0 \tabularnewline
13 & 0.457671 & 5.0344 & 1e-06 \tabularnewline
14 & 0.423941 & 4.6633 & 4e-06 \tabularnewline
15 & 0.449093 & 4.94 & 1e-06 \tabularnewline
16 & 0.361533 & 3.9769 & 6e-05 \tabularnewline
17 & 0.380482 & 4.1853 & 2.7e-05 \tabularnewline
18 & 0.38995 & 4.2895 & 1.8e-05 \tabularnewline
19 & 0.289375 & 3.1831 & 0.000926 \tabularnewline
20 & 0.306825 & 3.3751 & 0.000496 \tabularnewline
21 & 0.310178 & 3.412 & 0.000439 \tabularnewline
22 & 0.212777 & 2.3405 & 0.010446 \tabularnewline
23 & 0.280023 & 3.0802 & 0.00128 \tabularnewline
24 & 0.321303 & 3.5343 & 0.00029 \tabularnewline
25 & 0.212825 & 2.3411 & 0.010432 \tabularnewline
26 & 0.188635 & 2.075 & 0.020054 \tabularnewline
27 & 0.184875 & 2.0336 & 0.022088 \tabularnewline
28 & 0.136295 & 1.4992 & 0.068208 \tabularnewline
29 & 0.154055 & 1.6946 & 0.046362 \tabularnewline
30 & 0.140017 & 1.5402 & 0.063063 \tabularnewline
31 & 0.077034 & 0.8474 & 0.19923 \tabularnewline
32 & 0.092908 & 1.022 & 0.154412 \tabularnewline
33 & 0.086474 & 0.9512 & 0.171697 \tabularnewline
34 & 0.035679 & 0.3925 & 0.3477 \tabularnewline
35 & 0.082246 & 0.9047 & 0.18371 \tabularnewline
36 & 0.109756 & 1.2073 & 0.114833 \tabularnewline
37 & 0.048233 & 0.5306 & 0.298347 \tabularnewline
38 & 0.006139 & 0.0675 & 0.473135 \tabularnewline
39 & 0.015667 & 0.1723 & 0.43173 \tabularnewline
40 & -0.006498 & -0.0715 & 0.471569 \tabularnewline
41 & 0.001532 & 0.0169 & 0.493292 \tabularnewline
42 & 0.004645 & 0.0511 & 0.479667 \tabularnewline
43 & -0.022124 & -0.2434 & 0.404066 \tabularnewline
44 & -0.021934 & -0.2413 & 0.404876 \tabularnewline
45 & -0.017993 & -0.1979 & 0.42172 \tabularnewline
46 & -0.035309 & -0.3884 & 0.3492 \tabularnewline
47 & -0.021478 & -0.2363 & 0.406818 \tabularnewline
48 & 0.024775 & 0.2725 & 0.392843 \tabularnewline
49 & -0.021249 & -0.2337 & 0.40779 \tabularnewline
50 & -0.071446 & -0.7859 & 0.216728 \tabularnewline
51 & -0.033276 & -0.366 & 0.357487 \tabularnewline
52 & -0.044965 & -0.4946 & 0.310883 \tabularnewline
53 & -0.056554 & -0.6221 & 0.267526 \tabularnewline
54 & -0.017348 & -0.1908 & 0.424489 \tabularnewline
55 & -0.043326 & -0.4766 & 0.317257 \tabularnewline
56 & -0.048059 & -0.5286 & 0.29901 \tabularnewline
57 & -0.011571 & -0.1273 & 0.449463 \tabularnewline
58 & -0.03497 & -0.3847 & 0.35058 \tabularnewline
59 & -0.024658 & -0.2712 & 0.393333 \tabularnewline
60 & 0.037503 & 0.4125 & 0.340339 \tabularnewline
\hline
\end{tabular}
%Source: https://freestatistics.org/blog/index.php?pk=33285&T=1

[TABLE]
[ROW][C]Autocorrelation Function[/C][/ROW]
[ROW][C]Time lag k[/C][C]ACF(k)[/C][C]T-STAT[/C][C]P-value[/C][/ROW]
[ROW][C]1[/C][C]0.808707[/C][C]8.8958[/C][C]0[/C][/ROW]
[ROW][C]2[/C][C]0.752772[/C][C]8.2805[/C][C]0[/C][/ROW]
[ROW][C]3[/C][C]0.802896[/C][C]8.8319[/C][C]0[/C][/ROW]
[ROW][C]4[/C][C]0.687505[/C][C]7.5626[/C][C]0[/C][/ROW]
[ROW][C]5[/C][C]0.675461[/C][C]7.4301[/C][C]0[/C][/ROW]
[ROW][C]6[/C][C]0.70868[/C][C]7.7955[/C][C]0[/C][/ROW]
[ROW][C]7[/C][C]0.579926[/C][C]6.3792[/C][C]0[/C][/ROW]
[ROW][C]8[/C][C]0.57274[/C][C]6.3001[/C][C]0[/C][/ROW]
[ROW][C]9[/C][C]0.601018[/C][C]6.6112[/C][C]0[/C][/ROW]
[ROW][C]10[/C][C]0.47514[/C][C]5.2265[/C][C]0[/C][/ROW]
[ROW][C]11[/C][C]0.53707[/C][C]5.9078[/C][C]0[/C][/ROW]
[ROW][C]12[/C][C]0.609198[/C][C]6.7012[/C][C]0[/C][/ROW]
[ROW][C]13[/C][C]0.457671[/C][C]5.0344[/C][C]1e-06[/C][/ROW]
[ROW][C]14[/C][C]0.423941[/C][C]4.6633[/C][C]4e-06[/C][/ROW]
[ROW][C]15[/C][C]0.449093[/C][C]4.94[/C][C]1e-06[/C][/ROW]
[ROW][C]16[/C][C]0.361533[/C][C]3.9769[/C][C]6e-05[/C][/ROW]
[ROW][C]17[/C][C]0.380482[/C][C]4.1853[/C][C]2.7e-05[/C][/ROW]
[ROW][C]18[/C][C]0.38995[/C][C]4.2895[/C][C]1.8e-05[/C][/ROW]
[ROW][C]19[/C][C]0.289375[/C][C]3.1831[/C][C]0.000926[/C][/ROW]
[ROW][C]20[/C][C]0.306825[/C][C]3.3751[/C][C]0.000496[/C][/ROW]
[ROW][C]21[/C][C]0.310178[/C][C]3.412[/C][C]0.000439[/C][/ROW]
[ROW][C]22[/C][C]0.212777[/C][C]2.3405[/C][C]0.010446[/C][/ROW]
[ROW][C]23[/C][C]0.280023[/C][C]3.0802[/C][C]0.00128[/C][/ROW]
[ROW][C]24[/C][C]0.321303[/C][C]3.5343[/C][C]0.00029[/C][/ROW]
[ROW][C]25[/C][C]0.212825[/C][C]2.3411[/C][C]0.010432[/C][/ROW]
[ROW][C]26[/C][C]0.188635[/C][C]2.075[/C][C]0.020054[/C][/ROW]
[ROW][C]27[/C][C]0.184875[/C][C]2.0336[/C][C]0.022088[/C][/ROW]
[ROW][C]28[/C][C]0.136295[/C][C]1.4992[/C][C]0.068208[/C][/ROW]
[ROW][C]29[/C][C]0.154055[/C][C]1.6946[/C][C]0.046362[/C][/ROW]
[ROW][C]30[/C][C]0.140017[/C][C]1.5402[/C][C]0.063063[/C][/ROW]
[ROW][C]31[/C][C]0.077034[/C][C]0.8474[/C][C]0.19923[/C][/ROW]
[ROW][C]32[/C][C]0.092908[/C][C]1.022[/C][C]0.154412[/C][/ROW]
[ROW][C]33[/C][C]0.086474[/C][C]0.9512[/C][C]0.171697[/C][/ROW]
[ROW][C]34[/C][C]0.035679[/C][C]0.3925[/C][C]0.3477[/C][/ROW]
[ROW][C]35[/C][C]0.082246[/C][C]0.9047[/C][C]0.18371[/C][/ROW]
[ROW][C]36[/C][C]0.109756[/C][C]1.2073[/C][C]0.114833[/C][/ROW]
[ROW][C]37[/C][C]0.048233[/C][C]0.5306[/C][C]0.298347[/C][/ROW]
[ROW][C]38[/C][C]0.006139[/C][C]0.0675[/C][C]0.473135[/C][/ROW]
[ROW][C]39[/C][C]0.015667[/C][C]0.1723[/C][C]0.43173[/C][/ROW]
[ROW][C]40[/C][C]-0.006498[/C][C]-0.0715[/C][C]0.471569[/C][/ROW]
[ROW][C]41[/C][C]0.001532[/C][C]0.0169[/C][C]0.493292[/C][/ROW]
[ROW][C]42[/C][C]0.004645[/C][C]0.0511[/C][C]0.479667[/C][/ROW]
[ROW][C]43[/C][C]-0.022124[/C][C]-0.2434[/C][C]0.404066[/C][/ROW]
[ROW][C]44[/C][C]-0.021934[/C][C]-0.2413[/C][C]0.404876[/C][/ROW]
[ROW][C]45[/C][C]-0.017993[/C][C]-0.1979[/C][C]0.42172[/C][/ROW]
[ROW][C]46[/C][C]-0.035309[/C][C]-0.3884[/C][C]0.3492[/C][/ROW]
[ROW][C]47[/C][C]-0.021478[/C][C]-0.2363[/C][C]0.406818[/C][/ROW]
[ROW][C]48[/C][C]0.024775[/C][C]0.2725[/C][C]0.392843[/C][/ROW]
[ROW][C]49[/C][C]-0.021249[/C][C]-0.2337[/C][C]0.40779[/C][/ROW]
[ROW][C]50[/C][C]-0.071446[/C][C]-0.7859[/C][C]0.216728[/C][/ROW]
[ROW][C]51[/C][C]-0.033276[/C][C]-0.366[/C][C]0.357487[/C][/ROW]
[ROW][C]52[/C][C]-0.044965[/C][C]-0.4946[/C][C]0.310883[/C][/ROW]
[ROW][C]53[/C][C]-0.056554[/C][C]-0.6221[/C][C]0.267526[/C][/ROW]
[ROW][C]54[/C][C]-0.017348[/C][C]-0.1908[/C][C]0.424489[/C][/ROW]
[ROW][C]55[/C][C]-0.043326[/C][C]-0.4766[/C][C]0.317257[/C][/ROW]
[ROW][C]56[/C][C]-0.048059[/C][C]-0.5286[/C][C]0.29901[/C][/ROW]
[ROW][C]57[/C][C]-0.011571[/C][C]-0.1273[/C][C]0.449463[/C][/ROW]
[ROW][C]58[/C][C]-0.03497[/C][C]-0.3847[/C][C]0.35058[/C][/ROW]
[ROW][C]59[/C][C]-0.024658[/C][C]-0.2712[/C][C]0.393333[/C][/ROW]
[ROW][C]60[/C][C]0.037503[/C][C]0.4125[/C][C]0.340339[/C][/ROW]
[/TABLE]
Source: https://freestatistics.org/blog/index.php?pk=33285&T=1

Globally Unique Identifier (entire table): ba.freestatistics.org/blog/index.php?pk=33285&T=1

As an alternative you can also use a QR Code:  

The GUIDs for individual cells are displayed in the table below:

Autocorrelation Function
Time lag kACF(k)T-STATP-value
10.8087078.89580
20.7527728.28050
30.8028968.83190
40.6875057.56260
50.6754617.43010
60.708687.79550
70.5799266.37920
80.572746.30010
90.6010186.61120
100.475145.22650
110.537075.90780
120.6091986.70120
130.4576715.03441e-06
140.4239414.66334e-06
150.4490934.941e-06
160.3615333.97696e-05
170.3804824.18532.7e-05
180.389954.28951.8e-05
190.2893753.18310.000926
200.3068253.37510.000496
210.3101783.4120.000439
220.2127772.34050.010446
230.2800233.08020.00128
240.3213033.53430.00029
250.2128252.34110.010432
260.1886352.0750.020054
270.1848752.03360.022088
280.1362951.49920.068208
290.1540551.69460.046362
300.1400171.54020.063063
310.0770340.84740.19923
320.0929081.0220.154412
330.0864740.95120.171697
340.0356790.39250.3477
350.0822460.90470.18371
360.1097561.20730.114833
370.0482330.53060.298347
380.0061390.06750.473135
390.0156670.17230.43173
40-0.006498-0.07150.471569
410.0015320.01690.493292
420.0046450.05110.479667
43-0.022124-0.24340.404066
44-0.021934-0.24130.404876
45-0.017993-0.19790.42172
46-0.035309-0.38840.3492
47-0.021478-0.23630.406818
480.0247750.27250.392843
49-0.021249-0.23370.40779
50-0.071446-0.78590.216728
51-0.033276-0.3660.357487
52-0.044965-0.49460.310883
53-0.056554-0.62210.267526
54-0.017348-0.19080.424489
55-0.043326-0.47660.317257
56-0.048059-0.52860.29901
57-0.011571-0.12730.449463
58-0.03497-0.38470.35058
59-0.024658-0.27120.393333
600.0375030.41250.340339


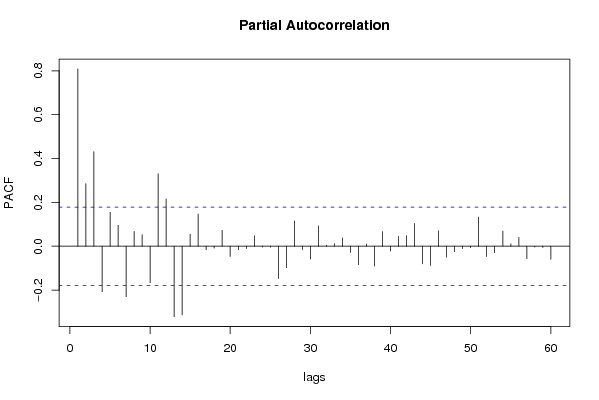
Partial Autocorrelation Function
Time lag kPACF(k)T-STATP-value
10.8087078.89580
20.2854533.140.001062
30.4312524.74383e-06
4-0.207434-2.28180.012125
50.1546151.70080.045777
60.0955751.05130.147602
7-0.230084-2.53090.00633
80.0672980.74030.230284
90.0524470.57690.282532
10-0.166479-1.83130.034761
110.3301463.63160.000207
120.2158832.37470.009567
13-0.321351-3.53490.000289
14-0.313277-3.44610.000391
150.0550990.60610.272794
160.1467721.61450.054513
17-0.016685-0.18350.427341
18-0.008184-0.090.464209
190.0728320.80120.212306
20-0.046738-0.51410.304055
21-0.016582-0.18240.427787
22-0.010019-0.11020.456214
230.0472290.51950.302173
24-0.004124-0.04540.481945
25-0.004326-0.04760.481061
26-0.147692-1.62460.053424
27-0.098089-1.0790.141373
280.1147481.26220.104647
29-0.01543-0.16970.432754
30-0.058182-0.640.26169
310.0925161.01770.155431
320.0048440.05330.478797
330.0113070.12440.450613
340.0379460.41740.338559
35-0.028433-0.31280.377501
36-0.084782-0.93260.17644
370.0105150.11570.454054
38-0.090347-0.99380.161146
390.0662540.72880.233769
40-0.021633-0.2380.406158
410.0443770.48810.313166
420.047860.52650.299767
430.1030751.13380.129554
44-0.080396-0.88440.18913
45-0.087759-0.96530.168148
460.0704280.77470.220013
47-0.050232-0.55260.290795
48-0.02556-0.28120.389534
49-0.010965-0.12060.452097
50-0.006647-0.07310.470918
510.1328351.46120.073279
52-0.04642-0.51060.305274
53-0.029255-0.32180.374077
540.0688910.75780.225022
550.0112240.12350.450973
560.0402330.44260.329436
57-0.057379-0.63120.264559
58-0.004016-0.04420.482419
59-0.005635-0.0620.47534
60-0.059993-0.65990.255279

\begin{tabular}{lllllllll}
\hline
Partial Autocorrelation Function \tabularnewline
Time lag k & PACF(k) & T-STAT & P-value \tabularnewline
1 & 0.808707 & 8.8958 & 0 \tabularnewline
2 & 0.285453 & 3.14 & 0.001062 \tabularnewline
3 & 0.431252 & 4.7438 & 3e-06 \tabularnewline
4 & -0.207434 & -2.2818 & 0.012125 \tabularnewline
5 & 0.154615 & 1.7008 & 0.045777 \tabularnewline
6 & 0.095575 & 1.0513 & 0.147602 \tabularnewline
7 & -0.230084 & -2.5309 & 0.00633 \tabularnewline
8 & 0.067298 & 0.7403 & 0.230284 \tabularnewline
9 & 0.052447 & 0.5769 & 0.282532 \tabularnewline
10 & -0.166479 & -1.8313 & 0.034761 \tabularnewline
11 & 0.330146 & 3.6316 & 0.000207 \tabularnewline
12 & 0.215883 & 2.3747 & 0.009567 \tabularnewline
13 & -0.321351 & -3.5349 & 0.000289 \tabularnewline
14 & -0.313277 & -3.4461 & 0.000391 \tabularnewline
15 & 0.055099 & 0.6061 & 0.272794 \tabularnewline
16 & 0.146772 & 1.6145 & 0.054513 \tabularnewline
17 & -0.016685 & -0.1835 & 0.427341 \tabularnewline
18 & -0.008184 & -0.09 & 0.464209 \tabularnewline
19 & 0.072832 & 0.8012 & 0.212306 \tabularnewline
20 & -0.046738 & -0.5141 & 0.304055 \tabularnewline
21 & -0.016582 & -0.1824 & 0.427787 \tabularnewline
22 & -0.010019 & -0.1102 & 0.456214 \tabularnewline
23 & 0.047229 & 0.5195 & 0.302173 \tabularnewline
24 & -0.004124 & -0.0454 & 0.481945 \tabularnewline
25 & -0.004326 & -0.0476 & 0.481061 \tabularnewline
26 & -0.147692 & -1.6246 & 0.053424 \tabularnewline
27 & -0.098089 & -1.079 & 0.141373 \tabularnewline
28 & 0.114748 & 1.2622 & 0.104647 \tabularnewline
29 & -0.01543 & -0.1697 & 0.432754 \tabularnewline
30 & -0.058182 & -0.64 & 0.26169 \tabularnewline
31 & 0.092516 & 1.0177 & 0.155431 \tabularnewline
32 & 0.004844 & 0.0533 & 0.478797 \tabularnewline
33 & 0.011307 & 0.1244 & 0.450613 \tabularnewline
34 & 0.037946 & 0.4174 & 0.338559 \tabularnewline
35 & -0.028433 & -0.3128 & 0.377501 \tabularnewline
36 & -0.084782 & -0.9326 & 0.17644 \tabularnewline
37 & 0.010515 & 0.1157 & 0.454054 \tabularnewline
38 & -0.090347 & -0.9938 & 0.161146 \tabularnewline
39 & 0.066254 & 0.7288 & 0.233769 \tabularnewline
40 & -0.021633 & -0.238 & 0.406158 \tabularnewline
41 & 0.044377 & 0.4881 & 0.313166 \tabularnewline
42 & 0.04786 & 0.5265 & 0.299767 \tabularnewline
43 & 0.103075 & 1.1338 & 0.129554 \tabularnewline
44 & -0.080396 & -0.8844 & 0.18913 \tabularnewline
45 & -0.087759 & -0.9653 & 0.168148 \tabularnewline
46 & 0.070428 & 0.7747 & 0.220013 \tabularnewline
47 & -0.050232 & -0.5526 & 0.290795 \tabularnewline
48 & -0.02556 & -0.2812 & 0.389534 \tabularnewline
49 & -0.010965 & -0.1206 & 0.452097 \tabularnewline
50 & -0.006647 & -0.0731 & 0.470918 \tabularnewline
51 & 0.132835 & 1.4612 & 0.073279 \tabularnewline
52 & -0.04642 & -0.5106 & 0.305274 \tabularnewline
53 & -0.029255 & -0.3218 & 0.374077 \tabularnewline
54 & 0.068891 & 0.7578 & 0.225022 \tabularnewline
55 & 0.011224 & 0.1235 & 0.450973 \tabularnewline
56 & 0.040233 & 0.4426 & 0.329436 \tabularnewline
57 & -0.057379 & -0.6312 & 0.264559 \tabularnewline
58 & -0.004016 & -0.0442 & 0.482419 \tabularnewline
59 & -0.005635 & -0.062 & 0.47534 \tabularnewline
60 & -0.059993 & -0.6599 & 0.255279 \tabularnewline
\hline
\end{tabular}
%Source: https://freestatistics.org/blog/index.php?pk=33285&T=2

[TABLE]
[ROW][C]Partial Autocorrelation Function[/C][/ROW]
[ROW][C]Time lag k[/C][C]PACF(k)[/C][C]T-STAT[/C][C]P-value[/C][/ROW]
[ROW][C]1[/C][C]0.808707[/C][C]8.8958[/C][C]0[/C][/ROW]
[ROW][C]2[/C][C]0.285453[/C][C]3.14[/C][C]0.001062[/C][/ROW]
[ROW][C]3[/C][C]0.431252[/C][C]4.7438[/C][C]3e-06[/C][/ROW]
[ROW][C]4[/C][C]-0.207434[/C][C]-2.2818[/C][C]0.012125[/C][/ROW]
[ROW][C]5[/C][C]0.154615[/C][C]1.7008[/C][C]0.045777[/C][/ROW]
[ROW][C]6[/C][C]0.095575[/C][C]1.0513[/C][C]0.147602[/C][/ROW]
[ROW][C]7[/C][C]-0.230084[/C][C]-2.5309[/C][C]0.00633[/C][/ROW]
[ROW][C]8[/C][C]0.067298[/C][C]0.7403[/C][C]0.230284[/C][/ROW]
[ROW][C]9[/C][C]0.052447[/C][C]0.5769[/C][C]0.282532[/C][/ROW]
[ROW][C]10[/C][C]-0.166479[/C][C]-1.8313[/C][C]0.034761[/C][/ROW]
[ROW][C]11[/C][C]0.330146[/C][C]3.6316[/C][C]0.000207[/C][/ROW]
[ROW][C]12[/C][C]0.215883[/C][C]2.3747[/C][C]0.009567[/C][/ROW]
[ROW][C]13[/C][C]-0.321351[/C][C]-3.5349[/C][C]0.000289[/C][/ROW]
[ROW][C]14[/C][C]-0.313277[/C][C]-3.4461[/C][C]0.000391[/C][/ROW]
[ROW][C]15[/C][C]0.055099[/C][C]0.6061[/C][C]0.272794[/C][/ROW]
[ROW][C]16[/C][C]0.146772[/C][C]1.6145[/C][C]0.054513[/C][/ROW]
[ROW][C]17[/C][C]-0.016685[/C][C]-0.1835[/C][C]0.427341[/C][/ROW]
[ROW][C]18[/C][C]-0.008184[/C][C]-0.09[/C][C]0.464209[/C][/ROW]
[ROW][C]19[/C][C]0.072832[/C][C]0.8012[/C][C]0.212306[/C][/ROW]
[ROW][C]20[/C][C]-0.046738[/C][C]-0.5141[/C][C]0.304055[/C][/ROW]
[ROW][C]21[/C][C]-0.016582[/C][C]-0.1824[/C][C]0.427787[/C][/ROW]
[ROW][C]22[/C][C]-0.010019[/C][C]-0.1102[/C][C]0.456214[/C][/ROW]
[ROW][C]23[/C][C]0.047229[/C][C]0.5195[/C][C]0.302173[/C][/ROW]
[ROW][C]24[/C][C]-0.004124[/C][C]-0.0454[/C][C]0.481945[/C][/ROW]
[ROW][C]25[/C][C]-0.004326[/C][C]-0.0476[/C][C]0.481061[/C][/ROW]
[ROW][C]26[/C][C]-0.147692[/C][C]-1.6246[/C][C]0.053424[/C][/ROW]
[ROW][C]27[/C][C]-0.098089[/C][C]-1.079[/C][C]0.141373[/C][/ROW]
[ROW][C]28[/C][C]0.114748[/C][C]1.2622[/C][C]0.104647[/C][/ROW]
[ROW][C]29[/C][C]-0.01543[/C][C]-0.1697[/C][C]0.432754[/C][/ROW]
[ROW][C]30[/C][C]-0.058182[/C][C]-0.64[/C][C]0.26169[/C][/ROW]
[ROW][C]31[/C][C]0.092516[/C][C]1.0177[/C][C]0.155431[/C][/ROW]
[ROW][C]32[/C][C]0.004844[/C][C]0.0533[/C][C]0.478797[/C][/ROW]
[ROW][C]33[/C][C]0.011307[/C][C]0.1244[/C][C]0.450613[/C][/ROW]
[ROW][C]34[/C][C]0.037946[/C][C]0.4174[/C][C]0.338559[/C][/ROW]
[ROW][C]35[/C][C]-0.028433[/C][C]-0.3128[/C][C]0.377501[/C][/ROW]
[ROW][C]36[/C][C]-0.084782[/C][C]-0.9326[/C][C]0.17644[/C][/ROW]
[ROW][C]37[/C][C]0.010515[/C][C]0.1157[/C][C]0.454054[/C][/ROW]
[ROW][C]38[/C][C]-0.090347[/C][C]-0.9938[/C][C]0.161146[/C][/ROW]
[ROW][C]39[/C][C]0.066254[/C][C]0.7288[/C][C]0.233769[/C][/ROW]
[ROW][C]40[/C][C]-0.021633[/C][C]-0.238[/C][C]0.406158[/C][/ROW]
[ROW][C]41[/C][C]0.044377[/C][C]0.4881[/C][C]0.313166[/C][/ROW]
[ROW][C]42[/C][C]0.04786[/C][C]0.5265[/C][C]0.299767[/C][/ROW]
[ROW][C]43[/C][C]0.103075[/C][C]1.1338[/C][C]0.129554[/C][/ROW]
[ROW][C]44[/C][C]-0.080396[/C][C]-0.8844[/C][C]0.18913[/C][/ROW]
[ROW][C]45[/C][C]-0.087759[/C][C]-0.9653[/C][C]0.168148[/C][/ROW]
[ROW][C]46[/C][C]0.070428[/C][C]0.7747[/C][C]0.220013[/C][/ROW]
[ROW][C]47[/C][C]-0.050232[/C][C]-0.5526[/C][C]0.290795[/C][/ROW]
[ROW][C]48[/C][C]-0.02556[/C][C]-0.2812[/C][C]0.389534[/C][/ROW]
[ROW][C]49[/C][C]-0.010965[/C][C]-0.1206[/C][C]0.452097[/C][/ROW]
[ROW][C]50[/C][C]-0.006647[/C][C]-0.0731[/C][C]0.470918[/C][/ROW]
[ROW][C]51[/C][C]0.132835[/C][C]1.4612[/C][C]0.073279[/C][/ROW]
[ROW][C]52[/C][C]-0.04642[/C][C]-0.5106[/C][C]0.305274[/C][/ROW]
[ROW][C]53[/C][C]-0.029255[/C][C]-0.3218[/C][C]0.374077[/C][/ROW]
[ROW][C]54[/C][C]0.068891[/C][C]0.7578[/C][C]0.225022[/C][/ROW]
[ROW][C]55[/C][C]0.011224[/C][C]0.1235[/C][C]0.450973[/C][/ROW]
[ROW][C]56[/C][C]0.040233[/C][C]0.4426[/C][C]0.329436[/C][/ROW]
[ROW][C]57[/C][C]-0.057379[/C][C]-0.6312[/C][C]0.264559[/C][/ROW]
[ROW][C]58[/C][C]-0.004016[/C][C]-0.0442[/C][C]0.482419[/C][/ROW]
[ROW][C]59[/C][C]-0.005635[/C][C]-0.062[/C][C]0.47534[/C][/ROW]
[ROW][C]60[/C][C]-0.059993[/C][C]-0.6599[/C][C]0.255279[/C][/ROW]
[/TABLE]
Source: https://freestatistics.org/blog/index.php?pk=33285&T=2

Globally Unique Identifier (entire table): ba.freestatistics.org/blog/index.php?pk=33285&T=2

As an alternative you can also use a QR Code:  

The GUIDs for individual cells are displayed in the table below:

Partial Autocorrelation Function
Time lag kPACF(k)T-STATP-value
10.8087078.89580
20.2854533.140.001062
30.4312524.74383e-06
4-0.207434-2.28180.012125
50.1546151.70080.045777
60.0955751.05130.147602
7-0.230084-2.53090.00633
80.0672980.74030.230284
90.0524470.57690.282532
10-0.166479-1.83130.034761
110.3301463.63160.000207
120.2158832.37470.009567
13-0.321351-3.53490.000289
14-0.313277-3.44610.000391
150.0550990.60610.272794
160.1467721.61450.054513
17-0.016685-0.18350.427341
18-0.008184-0.090.464209
190.0728320.80120.212306
20-0.046738-0.51410.304055
21-0.016582-0.18240.427787
22-0.010019-0.11020.456214
230.0472290.51950.302173
24-0.004124-0.04540.481945
25-0.004326-0.04760.481061
26-0.147692-1.62460.053424
27-0.098089-1.0790.141373
280.1147481.26220.104647
29-0.01543-0.16970.432754
30-0.058182-0.640.26169
310.0925161.01770.155431
320.0048440.05330.478797
330.0113070.12440.450613
340.0379460.41740.338559
35-0.028433-0.31280.377501
36-0.084782-0.93260.17644
370.0105150.11570.454054
38-0.090347-0.99380.161146
390.0662540.72880.233769
40-0.021633-0.2380.406158
410.0443770.48810.313166
420.047860.52650.299767
430.1030751.13380.129554
44-0.080396-0.88440.18913
45-0.087759-0.96530.168148
460.0704280.77470.220013
47-0.050232-0.55260.290795
48-0.02556-0.28120.389534
49-0.010965-0.12060.452097
50-0.006647-0.07310.470918
510.1328351.46120.073279
52-0.04642-0.51060.305274
53-0.029255-0.32180.374077
540.0688910.75780.225022
550.0112240.12350.450973
560.0402330.44260.329436
57-0.057379-0.63120.264559
58-0.004016-0.04420.482419
59-0.005635-0.0620.47534
60-0.059993-0.65990.255279


Parameters (Session):
par1 = 60 ; par2 = 1 ; par3 = 0 ; par4 = 0 ; par5 = 12 ;
Parameters (R input):
par1 = 60 ; par2 = 1 ; par3 = 0 ; par4 = 0 ; par5 = 12 ;
R code (references can be found in the software module):
if (par1 == 'Default') {
par1 = 10*log10(length(x))
} else {
par1 <- as.numeric(par1)
}
par2 <- as.numeric(par2)
par3 <- as.numeric(par3)
par4 <- as.numeric(par4)
par5 <- as.numeric(par5)
if (par2 == 0) {
x <- log(x)
} else {
x <- (x ^ par2 - 1) / par2
}
if (par3 > 0) x <- diff(x,lag=1,difference=par3)
if (par4 > 0) x <- diff(x,lag=par5,difference=par4)
bitmap(file='pic1.png')
racf <- acf(x,par1,main='Autocorrelation',xlab='lags',ylab='ACF')
dev.off()
bitmap(file='pic2.png')
rpacf <- pacf(x,par1,main='Partial Autocorrelation',xlab='lags',ylab='PACF')
dev.off()
(myacf <- c(racf$acf))
(mypacf <- c(rpacf$acf))
lengthx <- length(x)
sqrtn <- sqrt(lengthx)
load(file='createtable')
a<-table.start()
a<-table.row.start(a)
a<-table.element(a,'Autocorrelation Function',4,TRUE)
a<-table.row.end(a)
a<-table.row.start(a)
a<-table.element(a,'Time lag k',header=TRUE)
a<-table.element(a,hyperlink('basics.htm','ACF(k)','click here for more information about the Autocorrelation Function'),header=TRUE)
a<-table.element(a,'T-STAT',header=TRUE)
a<-table.element(a,'P-value',header=TRUE)
a<-table.row.end(a)
for (i in 2:(par1+1)) {
a<-table.row.start(a)
a<-table.element(a,i-1,header=TRUE)
a<-table.element(a,round(myacf[i],6))
mytstat <- myacf[i]*sqrtn
a<-table.element(a,round(mytstat,4))
a<-table.element(a,round(1-pt(abs(mytstat),lengthx),6))
a<-table.row.end(a)
}
a<-table.end(a)
table.save(a,file='mytable.tab')
a<-table.start()
a<-table.row.start(a)
a<-table.element(a,'Partial Autocorrelation Function',4,TRUE)
a<-table.row.end(a)
a<-table.row.start(a)
a<-table.element(a,'Time lag k',header=TRUE)
a<-table.element(a,hyperlink('basics.htm','PACF(k)','click here for more information about the Partial Autocorrelation Function'),header=TRUE)
a<-table.element(a,'T-STAT',header=TRUE)
a<-table.element(a,'P-value',header=TRUE)
a<-table.row.end(a)
for (i in 1:par1) {
a<-table.row.start(a)
a<-table.element(a,i,header=TRUE)
a<-table.element(a,round(mypacf[i],6))
mytstat <- mypacf[i]*sqrtn
a<-table.element(a,round(mytstat,4))
a<-table.element(a,round(1-pt(abs(mytstat),lengthx),6))
a<-table.row.end(a)
}
a<-table.end(a)
table.save(a,file='mytable1.tab')