Free Statistics

of Irreproducible Research!

Author's title

Author*The author of this computation has been verified*
R Software Modulerwasp_arimaforecasting.wasp
Title produced by softwareARIMA Forecasting
Date of computationSat, 13 Dec 2008 05:33:11 -0700
Cite this page as followsStatistical Computations at FreeStatistics.org, Office for Research Development and Education, URL https://freestatistics.org/blog/index.php?v=date/2008/Dec/13/t1229171662dx3q94hct5zdze8.htm/, Retrieved Fri, 17 May 2024 06:17:00 +0000
Statistical Computations at FreeStatistics.org, Office for Research Development and Education, URL https://freestatistics.org/blog/index.php?pk=33021, Retrieved Fri, 17 May 2024 06:17:00 +0000
QR Codes:

Original text written by user:
IsPrivate?No (this computation is public)
User-defined keywords
Estimated Impact157
Family? (F = Feedback message, R = changed R code, M = changed R Module, P = changed Parameters, D = changed Data)
F       [ARIMA Forecasting] [ARIMA Forecast] [2008-12-13 12:33:11] [21d7d81e7693ad6dde5aadefb1046611] [Current]
Feedback Forum
2008-12-20 22:13:13 [Evelien Blockx] [reply
Step 1 en step 2:
De berekening is correct uitgevoerd en de vragen zijn beantwoord.

Step 3:
Er wordt terecht geconcludeerd dat de verwachte voorspellingsfout vergroot naarmate we verder in de tijd gaan. Ook de andere vragen zijn goed beantwoord.

Step 4:
Duidelijk antwoord

Step 5:
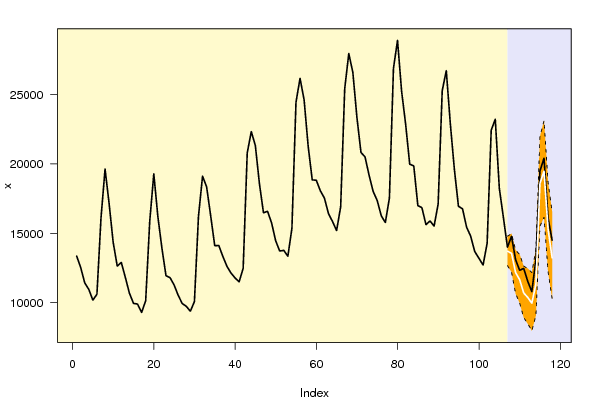
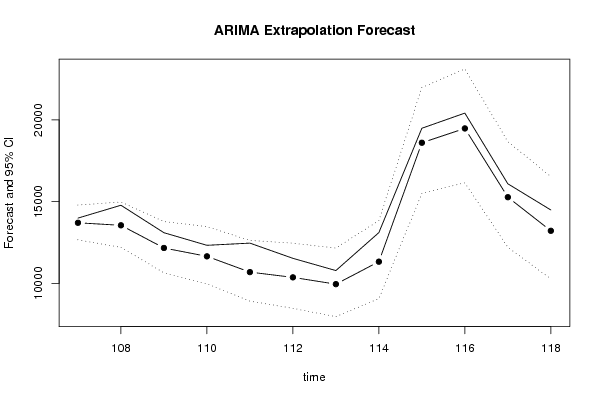
De werkelijke waarden en de voorspelde waarden vallen inderdaad steeds binnen het betrouwbaarheidsinterval. Dit is ook heel duidelijk te zien op de grafiek.

Post a new message
Dataseries X:
13363
12530
11420
10948
10173
10602
16094
19631
17140
14345
12632
12894
11808
10673
9939
9890
9283
10131
15864
19283
16203
13919
11937
11795
11268
10522
9929
9725
9372
10068
16230
19115
18351
16265
14103
14115
13327
12618
12129
11775
11493
12470
20792
22337
21325
18581
16475
16581
15745
14453
13712
13766
13336
15346
24446
26178
24628
21282
18850
18822
18060
17536
16417
15842
15188
16905
25430
27962
26607
23364
20827
20506
19181
18016
17354
16256
15770
17538
26899
28915
25247
22856
19980
19856
16994
16839
15618
15883
15513
17106
25272
26731
22891
19583
16939
16757
15435
14786
13680
13208
12707
14277
22436
23229
18241
16145
13994
14780
13100
12329
12463
11532
10784
13106
19491
20418
16094
14491


Summary of computational transaction
Raw Inputview raw input (R code)
Raw Outputview raw output of R engine
Computing time1 seconds
R Server'Gwilym Jenkins' @ 72.249.127.135

\begin{tabular}{lllllllll}
\hline
Summary of computational transaction \tabularnewline
Raw Input & view raw input (R code)  \tabularnewline
Raw Output & view raw output of R engine  \tabularnewline
Computing time & 1 seconds \tabularnewline
R Server & 'Gwilym Jenkins' @ 72.249.127.135 \tabularnewline
\hline
\end{tabular}
%Source: https://freestatistics.org/blog/index.php?pk=33021&T=0

[TABLE]
[ROW][C]Summary of computational transaction[/C][/ROW]
[ROW][C]Raw Input[/C][C]view raw input (R code) [/C][/ROW]
[ROW][C]Raw Output[/C][C]view raw output of R engine [/C][/ROW]
[ROW][C]Computing time[/C][C]1 seconds[/C][/ROW]
[ROW][C]R Server[/C][C]'Gwilym Jenkins' @ 72.249.127.135[/C][/ROW]
[/TABLE]
Source: https://freestatistics.org/blog/index.php?pk=33021&T=0

Globally Unique Identifier (entire table): ba.freestatistics.org/blog/index.php?pk=33021&T=0

As an alternative you can also use a QR Code:  

The GUIDs for individual cells are displayed in the table below:

Summary of computational transaction
Raw Inputview raw input (R code)
Raw Outputview raw output of R engine
Computing time1 seconds
R Server'Gwilym Jenkins' @ 72.249.127.135


Univariate ARIMA Extrapolation Forecast
timeY[t]F[t]95% LB95% UBp-value(H0: Y[t] = F[t])P(F[t]>Y[t-1])P(F[t]>Y[t-s])P(F[t]>Y[106])
9419583-------
9516939-------
9616757-------
9715435-------
9814786-------
9913680-------
10013208-------
10112707-------
10214277-------
10322436-------
10423229-------
10518241-------
10616145-------
1071399413707.433812665.153314790.92260.3021000
1081478013552.743312198.739414977.98950.04570.27202e-04
1091310012165.165110646.063213785.54320.12918e-0400
1101232911654.20759970.396813469.32830.23310.05924e-040
1111246310689.42368912.853412627.33770.03640.04860.00120
1121153210367.45458471.108512455.17830.13710.02460.00380
113107849951.9037963.338312161.87940.23030.08060.00730
1141310611327.85519066.806113840.34980.08270.66430.01071e-04
1151949118605.691215510.037521982.82450.30370.99930.01310.9234
1162041819480.817316152.743923120.40420.30690.49780.02180.9638
1171609415272.74512213.544918673.49230.3180.00150.04360.3076
1181449113216.509110268.290616536.30880.22590.04470.04190.0419

\begin{tabular}{lllllllll}
\hline
Univariate ARIMA Extrapolation Forecast \tabularnewline
time & Y[t] & F[t] & 95% LB & 95% UB & p-value(H0: Y[t] = F[t]) & P(F[t]>Y[t-1]) & P(F[t]>Y[t-s]) & P(F[t]>Y[106]) \tabularnewline
94 & 19583 & - & - & - & - & - & - & - \tabularnewline
95 & 16939 & - & - & - & - & - & - & - \tabularnewline
96 & 16757 & - & - & - & - & - & - & - \tabularnewline
97 & 15435 & - & - & - & - & - & - & - \tabularnewline
98 & 14786 & - & - & - & - & - & - & - \tabularnewline
99 & 13680 & - & - & - & - & - & - & - \tabularnewline
100 & 13208 & - & - & - & - & - & - & - \tabularnewline
101 & 12707 & - & - & - & - & - & - & - \tabularnewline
102 & 14277 & - & - & - & - & - & - & - \tabularnewline
103 & 22436 & - & - & - & - & - & - & - \tabularnewline
104 & 23229 & - & - & - & - & - & - & - \tabularnewline
105 & 18241 & - & - & - & - & - & - & - \tabularnewline
106 & 16145 & - & - & - & - & - & - & - \tabularnewline
107 & 13994 & 13707.4338 & 12665.1533 & 14790.9226 & 0.3021 & 0 & 0 & 0 \tabularnewline
108 & 14780 & 13552.7433 & 12198.7394 & 14977.9895 & 0.0457 & 0.272 & 0 & 2e-04 \tabularnewline
109 & 13100 & 12165.1651 & 10646.0632 & 13785.5432 & 0.1291 & 8e-04 & 0 & 0 \tabularnewline
110 & 12329 & 11654.2075 & 9970.3968 & 13469.3283 & 0.2331 & 0.0592 & 4e-04 & 0 \tabularnewline
111 & 12463 & 10689.4236 & 8912.8534 & 12627.3377 & 0.0364 & 0.0486 & 0.0012 & 0 \tabularnewline
112 & 11532 & 10367.4545 & 8471.1085 & 12455.1783 & 0.1371 & 0.0246 & 0.0038 & 0 \tabularnewline
113 & 10784 & 9951.903 & 7963.3383 & 12161.8794 & 0.2303 & 0.0806 & 0.0073 & 0 \tabularnewline
114 & 13106 & 11327.8551 & 9066.8061 & 13840.3498 & 0.0827 & 0.6643 & 0.0107 & 1e-04 \tabularnewline
115 & 19491 & 18605.6912 & 15510.0375 & 21982.8245 & 0.3037 & 0.9993 & 0.0131 & 0.9234 \tabularnewline
116 & 20418 & 19480.8173 & 16152.7439 & 23120.4042 & 0.3069 & 0.4978 & 0.0218 & 0.9638 \tabularnewline
117 & 16094 & 15272.745 & 12213.5449 & 18673.4923 & 0.318 & 0.0015 & 0.0436 & 0.3076 \tabularnewline
118 & 14491 & 13216.5091 & 10268.2906 & 16536.3088 & 0.2259 & 0.0447 & 0.0419 & 0.0419 \tabularnewline
\hline
\end{tabular}
%Source: https://freestatistics.org/blog/index.php?pk=33021&T=1

[TABLE]
[ROW][C]Univariate ARIMA Extrapolation Forecast[/C][/ROW]
[ROW][C]time[/C][C]Y[t][/C][C]F[t][/C][C]95% LB[/C][C]95% UB[/C][C]p-value(H0: Y[t] = F[t])[/C][C]P(F[t]>Y[t-1])[/C][C]P(F[t]>Y[t-s])[/C][C]P(F[t]>Y[106])[/C][/ROW]
[ROW][C]94[/C][C]19583[/C][C]-[/C][C]-[/C][C]-[/C][C]-[/C][C]-[/C][C]-[/C][C]-[/C][/ROW]
[ROW][C]95[/C][C]16939[/C][C]-[/C][C]-[/C][C]-[/C][C]-[/C][C]-[/C][C]-[/C][C]-[/C][/ROW]
[ROW][C]96[/C][C]16757[/C][C]-[/C][C]-[/C][C]-[/C][C]-[/C][C]-[/C][C]-[/C][C]-[/C][/ROW]
[ROW][C]97[/C][C]15435[/C][C]-[/C][C]-[/C][C]-[/C][C]-[/C][C]-[/C][C]-[/C][C]-[/C][/ROW]
[ROW][C]98[/C][C]14786[/C][C]-[/C][C]-[/C][C]-[/C][C]-[/C][C]-[/C][C]-[/C][C]-[/C][/ROW]
[ROW][C]99[/C][C]13680[/C][C]-[/C][C]-[/C][C]-[/C][C]-[/C][C]-[/C][C]-[/C][C]-[/C][/ROW]
[ROW][C]100[/C][C]13208[/C][C]-[/C][C]-[/C][C]-[/C][C]-[/C][C]-[/C][C]-[/C][C]-[/C][/ROW]
[ROW][C]101[/C][C]12707[/C][C]-[/C][C]-[/C][C]-[/C][C]-[/C][C]-[/C][C]-[/C][C]-[/C][/ROW]
[ROW][C]102[/C][C]14277[/C][C]-[/C][C]-[/C][C]-[/C][C]-[/C][C]-[/C][C]-[/C][C]-[/C][/ROW]
[ROW][C]103[/C][C]22436[/C][C]-[/C][C]-[/C][C]-[/C][C]-[/C][C]-[/C][C]-[/C][C]-[/C][/ROW]
[ROW][C]104[/C][C]23229[/C][C]-[/C][C]-[/C][C]-[/C][C]-[/C][C]-[/C][C]-[/C][C]-[/C][/ROW]
[ROW][C]105[/C][C]18241[/C][C]-[/C][C]-[/C][C]-[/C][C]-[/C][C]-[/C][C]-[/C][C]-[/C][/ROW]
[ROW][C]106[/C][C]16145[/C][C]-[/C][C]-[/C][C]-[/C][C]-[/C][C]-[/C][C]-[/C][C]-[/C][/ROW]
[ROW][C]107[/C][C]13994[/C][C]13707.4338[/C][C]12665.1533[/C][C]14790.9226[/C][C]0.3021[/C][C]0[/C][C]0[/C][C]0[/C][/ROW]
[ROW][C]108[/C][C]14780[/C][C]13552.7433[/C][C]12198.7394[/C][C]14977.9895[/C][C]0.0457[/C][C]0.272[/C][C]0[/C][C]2e-04[/C][/ROW]
[ROW][C]109[/C][C]13100[/C][C]12165.1651[/C][C]10646.0632[/C][C]13785.5432[/C][C]0.1291[/C][C]8e-04[/C][C]0[/C][C]0[/C][/ROW]
[ROW][C]110[/C][C]12329[/C][C]11654.2075[/C][C]9970.3968[/C][C]13469.3283[/C][C]0.2331[/C][C]0.0592[/C][C]4e-04[/C][C]0[/C][/ROW]
[ROW][C]111[/C][C]12463[/C][C]10689.4236[/C][C]8912.8534[/C][C]12627.3377[/C][C]0.0364[/C][C]0.0486[/C][C]0.0012[/C][C]0[/C][/ROW]
[ROW][C]112[/C][C]11532[/C][C]10367.4545[/C][C]8471.1085[/C][C]12455.1783[/C][C]0.1371[/C][C]0.0246[/C][C]0.0038[/C][C]0[/C][/ROW]
[ROW][C]113[/C][C]10784[/C][C]9951.903[/C][C]7963.3383[/C][C]12161.8794[/C][C]0.2303[/C][C]0.0806[/C][C]0.0073[/C][C]0[/C][/ROW]
[ROW][C]114[/C][C]13106[/C][C]11327.8551[/C][C]9066.8061[/C][C]13840.3498[/C][C]0.0827[/C][C]0.6643[/C][C]0.0107[/C][C]1e-04[/C][/ROW]
[ROW][C]115[/C][C]19491[/C][C]18605.6912[/C][C]15510.0375[/C][C]21982.8245[/C][C]0.3037[/C][C]0.9993[/C][C]0.0131[/C][C]0.9234[/C][/ROW]
[ROW][C]116[/C][C]20418[/C][C]19480.8173[/C][C]16152.7439[/C][C]23120.4042[/C][C]0.3069[/C][C]0.4978[/C][C]0.0218[/C][C]0.9638[/C][/ROW]
[ROW][C]117[/C][C]16094[/C][C]15272.745[/C][C]12213.5449[/C][C]18673.4923[/C][C]0.318[/C][C]0.0015[/C][C]0.0436[/C][C]0.3076[/C][/ROW]
[ROW][C]118[/C][C]14491[/C][C]13216.5091[/C][C]10268.2906[/C][C]16536.3088[/C][C]0.2259[/C][C]0.0447[/C][C]0.0419[/C][C]0.0419[/C][/ROW]
[/TABLE]
Source: https://freestatistics.org/blog/index.php?pk=33021&T=1

Globally Unique Identifier (entire table): ba.freestatistics.org/blog/index.php?pk=33021&T=1

As an alternative you can also use a QR Code:  

The GUIDs for individual cells are displayed in the table below:

Univariate ARIMA Extrapolation Forecast
timeY[t]F[t]95% LB95% UBp-value(H0: Y[t] = F[t])P(F[t]>Y[t-1])P(F[t]>Y[t-s])P(F[t]>Y[106])
9419583-------
9516939-------
9616757-------
9715435-------
9814786-------
9913680-------
10013208-------
10112707-------
10214277-------
10322436-------
10423229-------
10518241-------
10616145-------
1071399413707.433812665.153314790.92260.3021000
1081478013552.743312198.739414977.98950.04570.27202e-04
1091310012165.165110646.063213785.54320.12918e-0400
1101232911654.20759970.396813469.32830.23310.05924e-040
1111246310689.42368912.853412627.33770.03640.04860.00120
1121153210367.45458471.108512455.17830.13710.02460.00380
113107849951.9037963.338312161.87940.23030.08060.00730
1141310611327.85519066.806113840.34980.08270.66430.01071e-04
1151949118605.691215510.037521982.82450.30370.99930.01310.9234
1162041819480.817316152.743923120.40420.30690.49780.02180.9638
1171609415272.74512213.544918673.49230.3180.00150.04360.3076
1181449113216.509110268.290616536.30880.22590.04470.04190.0419


Univariate ARIMA Extrapolation Forecast Performance
time% S.E.PEMAPESq.EMSERMSE
1070.04030.02090.001782120.20836843.350782.7245
1080.05370.09060.00751506159.0331125513.2528354.2785
1090.0680.07680.0064873916.251872826.3543269.8636
1100.07950.05790.0048455344.903237945.4086194.7958
1110.09250.16590.01383145573.3279262131.1107511.9874
1120.10270.11230.00941356166.3346113013.8612336.1753
1130.11330.08360.007692385.446357698.7872240.2057
1140.11320.1570.01313161799.2534263483.2711513.3062
1150.09260.04760.004783771.663565314.3053255.5666
1160.09530.04810.004878311.422773192.6186270.5413
1170.11360.05380.0045674459.857156204.9881237.0759
1180.12820.09640.0081624327.0536135360.5878367.9138

\begin{tabular}{lllllllll}
\hline
Univariate ARIMA Extrapolation Forecast Performance \tabularnewline
time & % S.E. & PE & MAPE & Sq.E & MSE & RMSE \tabularnewline
107 & 0.0403 & 0.0209 & 0.0017 & 82120.2083 & 6843.3507 & 82.7245 \tabularnewline
108 & 0.0537 & 0.0906 & 0.0075 & 1506159.0331 & 125513.2528 & 354.2785 \tabularnewline
109 & 0.068 & 0.0768 & 0.0064 & 873916.2518 & 72826.3543 & 269.8636 \tabularnewline
110 & 0.0795 & 0.0579 & 0.0048 & 455344.9032 & 37945.4086 & 194.7958 \tabularnewline
111 & 0.0925 & 0.1659 & 0.0138 & 3145573.3279 & 262131.1107 & 511.9874 \tabularnewline
112 & 0.1027 & 0.1123 & 0.0094 & 1356166.3346 & 113013.8612 & 336.1753 \tabularnewline
113 & 0.1133 & 0.0836 & 0.007 & 692385.4463 & 57698.7872 & 240.2057 \tabularnewline
114 & 0.1132 & 0.157 & 0.0131 & 3161799.2534 & 263483.2711 & 513.3062 \tabularnewline
115 & 0.0926 & 0.0476 & 0.004 & 783771.6635 & 65314.3053 & 255.5666 \tabularnewline
116 & 0.0953 & 0.0481 & 0.004 & 878311.4227 & 73192.6186 & 270.5413 \tabularnewline
117 & 0.1136 & 0.0538 & 0.0045 & 674459.8571 & 56204.9881 & 237.0759 \tabularnewline
118 & 0.1282 & 0.0964 & 0.008 & 1624327.0536 & 135360.5878 & 367.9138 \tabularnewline
\hline
\end{tabular}
%Source: https://freestatistics.org/blog/index.php?pk=33021&T=2

[TABLE]
[ROW][C]Univariate ARIMA Extrapolation Forecast Performance[/C][/ROW]
[ROW][C]time[/C][C]% S.E.[/C][C]PE[/C][C]MAPE[/C][C]Sq.E[/C][C]MSE[/C][C]RMSE[/C][/ROW]
[ROW][C]107[/C][C]0.0403[/C][C]0.0209[/C][C]0.0017[/C][C]82120.2083[/C][C]6843.3507[/C][C]82.7245[/C][/ROW]
[ROW][C]108[/C][C]0.0537[/C][C]0.0906[/C][C]0.0075[/C][C]1506159.0331[/C][C]125513.2528[/C][C]354.2785[/C][/ROW]
[ROW][C]109[/C][C]0.068[/C][C]0.0768[/C][C]0.0064[/C][C]873916.2518[/C][C]72826.3543[/C][C]269.8636[/C][/ROW]
[ROW][C]110[/C][C]0.0795[/C][C]0.0579[/C][C]0.0048[/C][C]455344.9032[/C][C]37945.4086[/C][C]194.7958[/C][/ROW]
[ROW][C]111[/C][C]0.0925[/C][C]0.1659[/C][C]0.0138[/C][C]3145573.3279[/C][C]262131.1107[/C][C]511.9874[/C][/ROW]
[ROW][C]112[/C][C]0.1027[/C][C]0.1123[/C][C]0.0094[/C][C]1356166.3346[/C][C]113013.8612[/C][C]336.1753[/C][/ROW]
[ROW][C]113[/C][C]0.1133[/C][C]0.0836[/C][C]0.007[/C][C]692385.4463[/C][C]57698.7872[/C][C]240.2057[/C][/ROW]
[ROW][C]114[/C][C]0.1132[/C][C]0.157[/C][C]0.0131[/C][C]3161799.2534[/C][C]263483.2711[/C][C]513.3062[/C][/ROW]
[ROW][C]115[/C][C]0.0926[/C][C]0.0476[/C][C]0.004[/C][C]783771.6635[/C][C]65314.3053[/C][C]255.5666[/C][/ROW]
[ROW][C]116[/C][C]0.0953[/C][C]0.0481[/C][C]0.004[/C][C]878311.4227[/C][C]73192.6186[/C][C]270.5413[/C][/ROW]
[ROW][C]117[/C][C]0.1136[/C][C]0.0538[/C][C]0.0045[/C][C]674459.8571[/C][C]56204.9881[/C][C]237.0759[/C][/ROW]
[ROW][C]118[/C][C]0.1282[/C][C]0.0964[/C][C]0.008[/C][C]1624327.0536[/C][C]135360.5878[/C][C]367.9138[/C][/ROW]
[/TABLE]
Source: https://freestatistics.org/blog/index.php?pk=33021&T=2

Globally Unique Identifier (entire table): ba.freestatistics.org/blog/index.php?pk=33021&T=2

As an alternative you can also use a QR Code:  

The GUIDs for individual cells are displayed in the table below:

Univariate ARIMA Extrapolation Forecast Performance
time% S.E.PEMAPESq.EMSERMSE
1070.04030.02090.001782120.20836843.350782.7245
1080.05370.09060.00751506159.0331125513.2528354.2785
1090.0680.07680.0064873916.251872826.3543269.8636
1100.07950.05790.0048455344.903237945.4086194.7958
1110.09250.16590.01383145573.3279262131.1107511.9874
1120.10270.11230.00941356166.3346113013.8612336.1753
1130.11330.08360.007692385.446357698.7872240.2057
1140.11320.1570.01313161799.2534263483.2711513.3062
1150.09260.04760.004783771.663565314.3053255.5666
1160.09530.04810.004878311.422773192.6186270.5413
1170.11360.05380.0045674459.857156204.9881237.0759
1180.12820.09640.0081624327.0536135360.5878367.9138


Parameters (Session):
par1 = 12 ; par2 = 0.5 ; par3 = 1 ; par4 = 1 ; par5 = 12 ; par6 = 0 ; par7 = 1 ; par8 = 0 ; par9 = 1 ; par10 = FALSE ;
Parameters (R input):
par1 = 12 ; par2 = 0.5 ; par3 = 1 ; par4 = 1 ; par5 = 12 ; par6 = 0 ; par7 = 1 ; par8 = 0 ; par9 = 1 ; par10 = FALSE ;
R code (references can be found in the software module):
par1 <- as.numeric(par1) #cut off periods
par2 <- as.numeric(par2) #lambda
par3 <- as.numeric(par3) #degree of non-seasonal differencing
par4 <- as.numeric(par4) #degree of seasonal differencing
par5 <- as.numeric(par5) #seasonal period
par6 <- as.numeric(par6) #p
par7 <- as.numeric(par7) #q
par8 <- as.numeric(par8) #P
par9 <- as.numeric(par9) #Q
if (par10 == 'TRUE') par10 <- TRUE
if (par10 == 'FALSE') par10 <- FALSE
if (par2 == 0) x <- log(x)
if (par2 != 0) x <- x^par2
lx <- length(x)
first <- lx - 2*par1
nx <- lx - par1
nx1 <- nx + 1
fx <- lx - nx
if (fx < 1) {
fx <- par5
nx1 <- lx + fx - 1
first <- lx - 2*fx
}
first <- 1
if (fx < 3) fx <- round(lx/10,0)
(arima.out <- arima(x[1:nx], order=c(par6,par3,par7), seasonal=list(order=c(par8,par4,par9), period=par5), include.mean=par10, method='ML'))
(forecast <- predict(arima.out,fx))
(lb <- forecast$pred - 1.96 * forecast$se)
(ub <- forecast$pred + 1.96 * forecast$se)
if (par2 == 0) {
x <- exp(x)
forecast$pred <- exp(forecast$pred)
lb <- exp(lb)
ub <- exp(ub)
}
if (par2 != 0) {
x <- x^(1/par2)
forecast$pred <- forecast$pred^(1/par2)
lb <- lb^(1/par2)
ub <- ub^(1/par2)
}
if (par2 < 0) {
olb <- lb
lb <- ub
ub <- olb
}
(actandfor <- c(x[1:nx], forecast$pred))
(perc.se <- (ub-forecast$pred)/1.96/forecast$pred)
bitmap(file='test1.png')
opar <- par(mar=c(4,4,2,2),las=1)
ylim <- c( min(x[first:nx],lb), max(x[first:nx],ub))
plot(x,ylim=ylim,type='n',xlim=c(first,lx))
usr <- par('usr')
rect(usr[1],usr[3],nx+1,usr[4],border=NA,col='lemonchiffon')
rect(nx1,usr[3],usr[2],usr[4],border=NA,col='lavender')
abline(h= (-3:3)*2 , col ='gray', lty =3)
polygon( c(nx1:lx,lx:nx1), c(lb,rev(ub)), col = 'orange', lty=2,border=NA)
lines(nx1:lx, lb , lty=2)
lines(nx1:lx, ub , lty=2)
lines(x, lwd=2)
lines(nx1:lx, forecast$pred , lwd=2 , col ='white')
box()
par(opar)
dev.off()
prob.dec <- array(NA, dim=fx)
prob.sdec <- array(NA, dim=fx)
prob.ldec <- array(NA, dim=fx)
prob.pval <- array(NA, dim=fx)
perf.pe <- array(0, dim=fx)
perf.mape <- array(0, dim=fx)
perf.se <- array(0, dim=fx)
perf.mse <- array(0, dim=fx)
perf.rmse <- array(0, dim=fx)
for (i in 1:fx) {
locSD <- (ub[i] - forecast$pred[i]) / 1.96
perf.pe[i] = (x[nx+i] - forecast$pred[i]) / forecast$pred[i]
perf.mape[i] = perf.mape[i] + abs(perf.pe[i])
perf.se[i] = (x[nx+i] - forecast$pred[i])^2
perf.mse[i] = perf.mse[i] + perf.se[i]
prob.dec[i] = pnorm((x[nx+i-1] - forecast$pred[i]) / locSD)
prob.sdec[i] = pnorm((x[nx+i-par5] - forecast$pred[i]) / locSD)
prob.ldec[i] = pnorm((x[nx] - forecast$pred[i]) / locSD)
prob.pval[i] = pnorm(abs(x[nx+i] - forecast$pred[i]) / locSD)
}
perf.mape = perf.mape / fx
perf.mse = perf.mse / fx
perf.rmse = sqrt(perf.mse)
bitmap(file='test2.png')
plot(forecast$pred, pch=19, type='b',main='ARIMA Extrapolation Forecast', ylab='Forecast and 95% CI', xlab='time',ylim=c(min(lb),max(ub)))
dum <- forecast$pred
dum[1:12] <- x[(nx+1):lx]
lines(dum, lty=1)
lines(ub,lty=3)
lines(lb,lty=3)
dev.off()
load(file='createtable')
a<-table.start()
a<-table.row.start(a)
a<-table.element(a,'Univariate ARIMA Extrapolation Forecast',9,TRUE)
a<-table.row.end(a)
a<-table.row.start(a)
a<-table.element(a,'time',1,header=TRUE)
a<-table.element(a,'Y[t]',1,header=TRUE)
a<-table.element(a,'F[t]',1,header=TRUE)
a<-table.element(a,'95% LB',1,header=TRUE)
a<-table.element(a,'95% UB',1,header=TRUE)
a<-table.element(a,'p-value
(H0: Y[t] = F[t])',1,header=TRUE)
a<-table.element(a,'P(F[t]>Y[t-1])',1,header=TRUE)
a<-table.element(a,'P(F[t]>Y[t-s])',1,header=TRUE)
mylab <- paste('P(F[t]>Y[',nx,sep='')
mylab <- paste(mylab,'])',sep='')
a<-table.element(a,mylab,1,header=TRUE)
a<-table.row.end(a)
for (i in (nx-par5):nx) {
a<-table.row.start(a)
a<-table.element(a,i,header=TRUE)
a<-table.element(a,x[i])
a<-table.element(a,'-')
a<-table.row.end(a)
}
for (i in 1:fx) {
a<-table.row.start(a)
a<-table.element(a,nx+i,header=TRUE)
a<-table.element(a,round(x[nx+i],4))
a<-table.element(a,round(forecast$pred[i],4))
a<-table.element(a,round(lb[i],4))
a<-table.element(a,round(ub[i],4))
a<-table.element(a,round((1-prob.pval[i]),4))
a<-table.element(a,round((1-prob.dec[i]),4))
a<-table.element(a,round((1-prob.sdec[i]),4))
a<-table.element(a,round((1-prob.ldec[i]),4))
a<-table.row.end(a)
}
a<-table.end(a)
table.save(a,file='mytable.tab')
a<-table.start()
a<-table.row.start(a)
a<-table.element(a,'Univariate ARIMA Extrapolation Forecast Performance',7,TRUE)
a<-table.row.end(a)
a<-table.row.start(a)
a<-table.element(a,'time',1,header=TRUE)
a<-table.element(a,'% S.E.',1,header=TRUE)
a<-table.element(a,'PE',1,header=TRUE)
a<-table.element(a,'MAPE',1,header=TRUE)
a<-table.element(a,'Sq.E',1,header=TRUE)
a<-table.element(a,'MSE',1,header=TRUE)
a<-table.element(a,'RMSE',1,header=TRUE)
a<-table.row.end(a)
for (i in 1:fx) {
a<-table.row.start(a)
a<-table.element(a,nx+i,header=TRUE)
a<-table.element(a,round(perc.se[i],4))
a<-table.element(a,round(perf.pe[i],4))
a<-table.element(a,round(perf.mape[i],4))
a<-table.element(a,round(perf.se[i],4))
a<-table.element(a,round(perf.mse[i],4))
a<-table.element(a,round(perf.rmse[i],4))
a<-table.row.end(a)
}
a<-table.end(a)
table.save(a,file='mytable1.tab')