Free Statistics

of Irreproducible Research!

Author's title

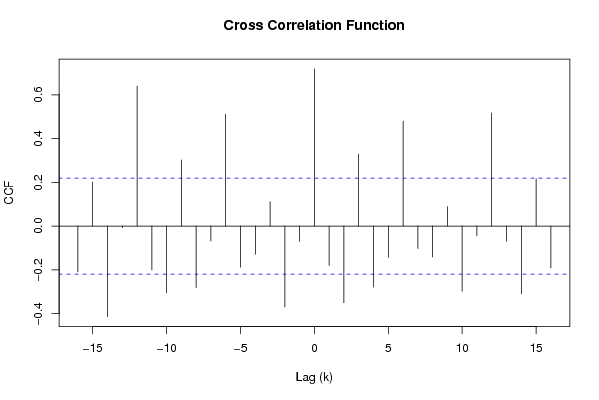
Cross Correlation Function: gedifferentieerd: Duurzame en niet-duurzame con...

Author*The author of this computation has been verified*
R Software Modulerwasp_cross.wasp
Title produced by softwareCross Correlation Function
Date of computationSat, 13 Dec 2008 04:49:54 -0700
Cite this page as followsStatistical Computations at FreeStatistics.org, Office for Research Development and Education, URL https://freestatistics.org/blog/index.php?v=date/2008/Dec/13/t1229169031ldyvzb2yyqzd30x.htm/, Retrieved Fri, 17 May 2024 02:01:26 +0000
Statistical Computations at FreeStatistics.org, Office for Research Development and Education, URL https://freestatistics.org/blog/index.php?pk=32981, Retrieved Fri, 17 May 2024 02:01:26 +0000
QR Codes:

Original text written by user:
IsPrivate?No (this computation is public)
User-defined keywords
Estimated Impact178
Family? (F = Feedback message, R = changed R code, M = changed R Module, P = changed Parameters, D = changed Data)
-       [Cross Correlation Function] [Cross Correlation...] [2008-12-13 11:49:54] [b5110a3ab194da7214bdf478e0a05dbd] [Current]
Feedback Forum

Post a new message
Dataseries X:
85.0
95.9
108.9
96.2
100.1
105.7
64.5
66.8
110.3
96.1
102.5
97.6
83.6
86.5
96.0
91.1
87.2
84.5
59.2
61.5
98.8
97.9
92.7
84.2
74.5
79.7
86.8
79.8
87.0
91.4
58.7
62.8
87.9
90.4
80.6
73.5
71.4
70.6
78.3
76.0
77.4
80.9
63.4
58.1
88.2
81.2
84.9
76.4
71.5
76.1
82.9
78.0
82.0
84.7
55.7
59.5
83.2
87.6
76.2
76.4
68.3
70.0
76.3
70.9
72.4
80.1
57.4
62.7
82.6
88.9
80.4
72.0
69.4
69.2
77.3
79.4
78.6
76.1
61.8
59.4
78.1
Dataseries Y:
99.5
98.2
108.9
100.0
105.0
108.4
96.7
100.5
115.6
114.9
110.7
107.7
113.5
106.9
119.6
109.4
106.9
118.7
108.9
113.1
125.1
126.5
122.7
127.5
107.1
112.0
122.1
111.5
113.2
128.2
115.1
117.4
132.0
130.8
128.0
132.7
117.0
110.9
123.5
117.4
122.7
123.5
111.5
113.8
131.2
127.0
126.2
121.2
118.8
117.9
135.2
120.7
126.4
129.6
113.4
120.5
135.5
137.6
130.6
133.1
121.5
120.5
136.9
123.7
128.5
135.0
120.9
121.1
132.2
134.5
133.6
136.1
124.5
124.6
133.5
132.3
125.3
135.5
121.2
117.5
135.9


Summary of computational transaction
Raw Inputview raw input (R code)
Raw Outputview raw output of R engine
Computing time4 seconds
R Server'Herman Ole Andreas Wold' @ 193.190.124.10:1001

\begin{tabular}{lllllllll}
\hline
Summary of computational transaction \tabularnewline
Raw Input & view raw input (R code)  \tabularnewline
Raw Output & view raw output of R engine  \tabularnewline
Computing time & 4 seconds \tabularnewline
R Server & 'Herman Ole Andreas Wold' @ 193.190.124.10:1001 \tabularnewline
\hline
\end{tabular}
%Source: https://freestatistics.org/blog/index.php?pk=32981&T=0

[TABLE]
[ROW][C]Summary of computational transaction[/C][/ROW]
[ROW][C]Raw Input[/C][C]view raw input (R code) [/C][/ROW]
[ROW][C]Raw Output[/C][C]view raw output of R engine [/C][/ROW]
[ROW][C]Computing time[/C][C]4 seconds[/C][/ROW]
[ROW][C]R Server[/C][C]'Herman Ole Andreas Wold' @ 193.190.124.10:1001[/C][/ROW]
[/TABLE]
Source: https://freestatistics.org/blog/index.php?pk=32981&T=0

Globally Unique Identifier (entire table): ba.freestatistics.org/blog/index.php?pk=32981&T=0

As an alternative you can also use a QR Code:  

The GUIDs for individual cells are displayed in the table below:

Summary of computational transaction
Raw Inputview raw input (R code)
Raw Outputview raw output of R engine
Computing time4 seconds
R Server'Herman Ole Andreas Wold' @ 193.190.124.10:1001


Cross Correlation Function
ParameterValue
Box-Cox transformation parameter (lambda) of X series1
Degree of non-seasonal differencing (d) of X series0
Degree of seasonal differencing (D) of X series1
Seasonal Period (s)1
Box-Cox transformation parameter (lambda) of Y series1
Degree of non-seasonal differencing (d) of Y series0
Degree of seasonal differencing (D) of Y series1
krho(Y[t],X[t+k])
-16-0.209349513553748
-150.201058179988019
-14-0.413595757436715
-13-0.00702759326821829
-120.639171733520724
-11-0.200282830341698
-10-0.305294627681689
-90.302515897110176
-8-0.280717643697217
-7-0.0679252835155007
-60.510496847365487
-5-0.187911047975588
-4-0.128697421934353
-30.111208451641820
-2-0.369511254830928
-1-0.070142501317943
00.717940927889122
1-0.180324953950285
2-0.349587159744925
30.328532809397484
4-0.27863114874845
5-0.143355544391548
60.479338560963869
7-0.101989912293016
8-0.140583217380519
90.0892056938605346
10-0.297212506270523
11-0.0442221702108991
120.516996131558922
13-0.0689651662773008
14-0.309022956690513
150.216918640252303
16-0.191141217421205

\begin{tabular}{lllllllll}
\hline
Cross Correlation Function \tabularnewline
Parameter & Value \tabularnewline
Box-Cox transformation parameter (lambda) of X series & 1 \tabularnewline
Degree of non-seasonal differencing (d) of X series & 0 \tabularnewline
Degree of seasonal differencing (D) of X series & 1 \tabularnewline
Seasonal Period (s) & 1 \tabularnewline
Box-Cox transformation parameter (lambda) of Y series & 1 \tabularnewline
Degree of non-seasonal differencing (d) of Y series & 0 \tabularnewline
Degree of seasonal differencing (D) of Y series & 1 \tabularnewline
k & rho(Y[t],X[t+k]) \tabularnewline
-16 & -0.209349513553748 \tabularnewline
-15 & 0.201058179988019 \tabularnewline
-14 & -0.413595757436715 \tabularnewline
-13 & -0.00702759326821829 \tabularnewline
-12 & 0.639171733520724 \tabularnewline
-11 & -0.200282830341698 \tabularnewline
-10 & -0.305294627681689 \tabularnewline
-9 & 0.302515897110176 \tabularnewline
-8 & -0.280717643697217 \tabularnewline
-7 & -0.0679252835155007 \tabularnewline
-6 & 0.510496847365487 \tabularnewline
-5 & -0.187911047975588 \tabularnewline
-4 & -0.128697421934353 \tabularnewline
-3 & 0.111208451641820 \tabularnewline
-2 & -0.369511254830928 \tabularnewline
-1 & -0.070142501317943 \tabularnewline
0 & 0.717940927889122 \tabularnewline
1 & -0.180324953950285 \tabularnewline
2 & -0.349587159744925 \tabularnewline
3 & 0.328532809397484 \tabularnewline
4 & -0.27863114874845 \tabularnewline
5 & -0.143355544391548 \tabularnewline
6 & 0.479338560963869 \tabularnewline
7 & -0.101989912293016 \tabularnewline
8 & -0.140583217380519 \tabularnewline
9 & 0.0892056938605346 \tabularnewline
10 & -0.297212506270523 \tabularnewline
11 & -0.0442221702108991 \tabularnewline
12 & 0.516996131558922 \tabularnewline
13 & -0.0689651662773008 \tabularnewline
14 & -0.309022956690513 \tabularnewline
15 & 0.216918640252303 \tabularnewline
16 & -0.191141217421205 \tabularnewline
\hline
\end{tabular}
%Source: https://freestatistics.org/blog/index.php?pk=32981&T=1

[TABLE]
[ROW][C]Cross Correlation Function[/C][/ROW]
[ROW][C]Parameter[/C][C]Value[/C][/ROW]
[ROW][C]Box-Cox transformation parameter (lambda) of X series[/C][C]1[/C][/ROW]
[ROW][C]Degree of non-seasonal differencing (d) of X series[/C][C]0[/C][/ROW]
[ROW][C]Degree of seasonal differencing (D) of X series[/C][C]1[/C][/ROW]
[ROW][C]Seasonal Period (s)[/C][C]1[/C][/ROW]
[ROW][C]Box-Cox transformation parameter (lambda) of Y series[/C][C]1[/C][/ROW]
[ROW][C]Degree of non-seasonal differencing (d) of Y series[/C][C]0[/C][/ROW]
[ROW][C]Degree of seasonal differencing (D) of Y series[/C][C]1[/C][/ROW]
[ROW][C]k[/C][C]rho(Y[t],X[t+k])[/C][/ROW]
[ROW][C]-16[/C][C]-0.209349513553748[/C][/ROW]
[ROW][C]-15[/C][C]0.201058179988019[/C][/ROW]
[ROW][C]-14[/C][C]-0.413595757436715[/C][/ROW]
[ROW][C]-13[/C][C]-0.00702759326821829[/C][/ROW]
[ROW][C]-12[/C][C]0.639171733520724[/C][/ROW]
[ROW][C]-11[/C][C]-0.200282830341698[/C][/ROW]
[ROW][C]-10[/C][C]-0.305294627681689[/C][/ROW]
[ROW][C]-9[/C][C]0.302515897110176[/C][/ROW]
[ROW][C]-8[/C][C]-0.280717643697217[/C][/ROW]
[ROW][C]-7[/C][C]-0.0679252835155007[/C][/ROW]
[ROW][C]-6[/C][C]0.510496847365487[/C][/ROW]
[ROW][C]-5[/C][C]-0.187911047975588[/C][/ROW]
[ROW][C]-4[/C][C]-0.128697421934353[/C][/ROW]
[ROW][C]-3[/C][C]0.111208451641820[/C][/ROW]
[ROW][C]-2[/C][C]-0.369511254830928[/C][/ROW]
[ROW][C]-1[/C][C]-0.070142501317943[/C][/ROW]
[ROW][C]0[/C][C]0.717940927889122[/C][/ROW]
[ROW][C]1[/C][C]-0.180324953950285[/C][/ROW]
[ROW][C]2[/C][C]-0.349587159744925[/C][/ROW]
[ROW][C]3[/C][C]0.328532809397484[/C][/ROW]
[ROW][C]4[/C][C]-0.27863114874845[/C][/ROW]
[ROW][C]5[/C][C]-0.143355544391548[/C][/ROW]
[ROW][C]6[/C][C]0.479338560963869[/C][/ROW]
[ROW][C]7[/C][C]-0.101989912293016[/C][/ROW]
[ROW][C]8[/C][C]-0.140583217380519[/C][/ROW]
[ROW][C]9[/C][C]0.0892056938605346[/C][/ROW]
[ROW][C]10[/C][C]-0.297212506270523[/C][/ROW]
[ROW][C]11[/C][C]-0.0442221702108991[/C][/ROW]
[ROW][C]12[/C][C]0.516996131558922[/C][/ROW]
[ROW][C]13[/C][C]-0.0689651662773008[/C][/ROW]
[ROW][C]14[/C][C]-0.309022956690513[/C][/ROW]
[ROW][C]15[/C][C]0.216918640252303[/C][/ROW]
[ROW][C]16[/C][C]-0.191141217421205[/C][/ROW]
[/TABLE]
Source: https://freestatistics.org/blog/index.php?pk=32981&T=1

Globally Unique Identifier (entire table): ba.freestatistics.org/blog/index.php?pk=32981&T=1

As an alternative you can also use a QR Code:  

The GUIDs for individual cells are displayed in the table below:

Cross Correlation Function
ParameterValue
Box-Cox transformation parameter (lambda) of X series1
Degree of non-seasonal differencing (d) of X series0
Degree of seasonal differencing (D) of X series1
Seasonal Period (s)1
Box-Cox transformation parameter (lambda) of Y series1
Degree of non-seasonal differencing (d) of Y series0
Degree of seasonal differencing (D) of Y series1
krho(Y[t],X[t+k])
-16-0.209349513553748
-150.201058179988019
-14-0.413595757436715
-13-0.00702759326821829
-120.639171733520724
-11-0.200282830341698
-10-0.305294627681689
-90.302515897110176
-8-0.280717643697217
-7-0.0679252835155007
-60.510496847365487
-5-0.187911047975588
-4-0.128697421934353
-30.111208451641820
-2-0.369511254830928
-1-0.070142501317943
00.717940927889122
1-0.180324953950285
2-0.349587159744925
30.328532809397484
4-0.27863114874845
5-0.143355544391548
60.479338560963869
7-0.101989912293016
8-0.140583217380519
90.0892056938605346
10-0.297212506270523
11-0.0442221702108991
120.516996131558922
13-0.0689651662773008
14-0.309022956690513
150.216918640252303
16-0.191141217421205


Parameters (Session):
par1 = 1 ; par2 = 0 ; par3 = 1 ; par4 = 1 ; par5 = 1 ; par6 = 0 ; par7 = 1 ;
Parameters (R input):
par1 = 1 ; par2 = 0 ; par3 = 1 ; par4 = 1 ; par5 = 1 ; par6 = 0 ; par7 = 1 ;
R code (references can be found in the software module):
par1 <- as.numeric(par1)
par2 <- as.numeric(par2)
par3 <- as.numeric(par3)
par4 <- as.numeric(par4)
par5 <- as.numeric(par5)
par6 <- as.numeric(par6)
par7 <- as.numeric(par7)
if (par1 == 0) {
x <- log(x)
} else {
x <- (x ^ par1 - 1) / par1
}
if (par5 == 0) {
y <- log(y)
} else {
y <- (y ^ par5 - 1) / par5
}
if (par2 > 0) x <- diff(x,lag=1,difference=par2)
if (par6 > 0) y <- diff(y,lag=1,difference=par6)
if (par3 > 0) x <- diff(x,lag=par4,difference=par3)
if (par7 > 0) y <- diff(y,lag=par4,difference=par7)
x
y
bitmap(file='test1.png')
(r <- ccf(x,y,main='Cross Correlation Function',ylab='CCF',xlab='Lag (k)'))
dev.off()
load(file='createtable')
a<-table.start()
a<-table.row.start(a)
a<-table.element(a,'Cross Correlation Function',2,TRUE)
a<-table.row.end(a)
a<-table.row.start(a)
a<-table.element(a,'Parameter',header=TRUE)
a<-table.element(a,'Value',header=TRUE)
a<-table.row.end(a)
a<-table.row.start(a)
a<-table.element(a,'Box-Cox transformation parameter (lambda) of X series',header=TRUE)
a<-table.element(a,par1)
a<-table.row.end(a)
a<-table.row.start(a)
a<-table.element(a,'Degree of non-seasonal differencing (d) of X series',header=TRUE)
a<-table.element(a,par2)
a<-table.row.end(a)
a<-table.row.start(a)
a<-table.element(a,'Degree of seasonal differencing (D) of X series',header=TRUE)
a<-table.element(a,par3)
a<-table.row.end(a)
a<-table.row.start(a)
a<-table.element(a,'Seasonal Period (s)',header=TRUE)
a<-table.element(a,par4)
a<-table.row.end(a)
a<-table.row.start(a)
a<-table.element(a,'Box-Cox transformation parameter (lambda) of Y series',header=TRUE)
a<-table.element(a,par5)
a<-table.row.end(a)
a<-table.row.start(a)
a<-table.element(a,'Degree of non-seasonal differencing (d) of Y series',header=TRUE)
a<-table.element(a,par6)
a<-table.row.end(a)
a<-table.row.start(a)
a<-table.element(a,'Degree of seasonal differencing (D) of Y series',header=TRUE)
a<-table.element(a,par7)
a<-table.row.end(a)
a<-table.row.start(a)
a<-table.element(a,'k',header=TRUE)
a<-table.element(a,'rho(Y[t],X[t+k])',header=TRUE)
a<-table.row.end(a)
mylength <- length(r$acf)
myhalf <- floor((mylength-1)/2)
for (i in 1:mylength) {
a<-table.row.start(a)
a<-table.element(a,i-myhalf-1,header=TRUE)
a<-table.element(a,r$acf[i])
a<-table.row.end(a)
}
a<-table.end(a)
table.save(a,file='mytable.tab')