Free Statistics

of Irreproducible Research!

Author's title

Author*The author of this computation has been verified*
R Software Modulerwasp_arimabackwardselection.wasp
Title produced by softwareARIMA Backward Selection
Date of computationSat, 13 Dec 2008 02:57:41 -0700
Cite this page as followsStatistical Computations at FreeStatistics.org, Office for Research Development and Education, URL https://freestatistics.org/blog/index.php?v=date/2008/Dec/13/t1229162337fxxxmjx8hvd6fia.htm/, Retrieved Fri, 17 May 2024 03:20:09 +0000
Statistical Computations at FreeStatistics.org, Office for Research Development and Education, URL https://freestatistics.org/blog/index.php?pk=32924, Retrieved Fri, 17 May 2024 03:20:09 +0000
QR Codes:

Original text written by user:
IsPrivate?No (this computation is public)
User-defined keywords
Estimated Impact187
Family? (F = Feedback message, R = changed R code, M = changed R Module, P = changed Parameters, D = changed Data)
-     [Univariate Data Series] [Werkloosheid totalen] [2008-11-28 13:18:02] [6743688719638b0cb1c0a6e0bf433315]
-   P   [Univariate Data Series] [Total unemployment] [2008-12-02 17:54:00] [6743688719638b0cb1c0a6e0bf433315]
- RMP       [ARIMA Backward Selection] [ARIMA backward] [2008-12-13 09:57:41] [9b05d7ef5dbcfba4217d280d9092f628] [Current]
F RMP         [ARIMA Forecasting] [ARIMA forcast] [2008-12-13 10:01:37] [6743688719638b0cb1c0a6e0bf433315]
Feedback Forum

Post a new message
Dataseries X:
569323
579714
577992
565464
547344
554788
562325
560854
555332
543599
536662
542722
593530
610763
612613
611324
594167
595454
590865
589379
584428
573100
567456
569028
620735
628884
628232
612117
595404
597141
593408
590072
579799
574205
572775
572942
619567
625809
619916
587625
565742
557274
560576
548854
531673
525919
511038
498662
555362
564591
541657
527070
509846
514258
516922
507561
492622
490243
469357
477580
528379


Summary of computational transaction
Raw Inputview raw input (R code)
Raw Outputview raw output of R engine
Computing time6 seconds
R Server'Gwilym Jenkins' @ 72.249.127.135

\begin{tabular}{lllllllll}
\hline
Summary of computational transaction \tabularnewline
Raw Input & view raw input (R code)  \tabularnewline
Raw Output & view raw output of R engine  \tabularnewline
Computing time & 6 seconds \tabularnewline
R Server & 'Gwilym Jenkins' @ 72.249.127.135 \tabularnewline
\hline
\end{tabular}
%Source: https://freestatistics.org/blog/index.php?pk=32924&T=0

[TABLE]
[ROW][C]Summary of computational transaction[/C][/ROW]
[ROW][C]Raw Input[/C][C]view raw input (R code) [/C][/ROW]
[ROW][C]Raw Output[/C][C]view raw output of R engine [/C][/ROW]
[ROW][C]Computing time[/C][C]6 seconds[/C][/ROW]
[ROW][C]R Server[/C][C]'Gwilym Jenkins' @ 72.249.127.135[/C][/ROW]
[/TABLE]
Source: https://freestatistics.org/blog/index.php?pk=32924&T=0

Globally Unique Identifier (entire table): ba.freestatistics.org/blog/index.php?pk=32924&T=0

As an alternative you can also use a QR Code:  

The GUIDs for individual cells are displayed in the table below:

Summary of computational transaction
Raw Inputview raw input (R code)
Raw Outputview raw output of R engine
Computing time6 seconds
R Server'Gwilym Jenkins' @ 72.249.127.135


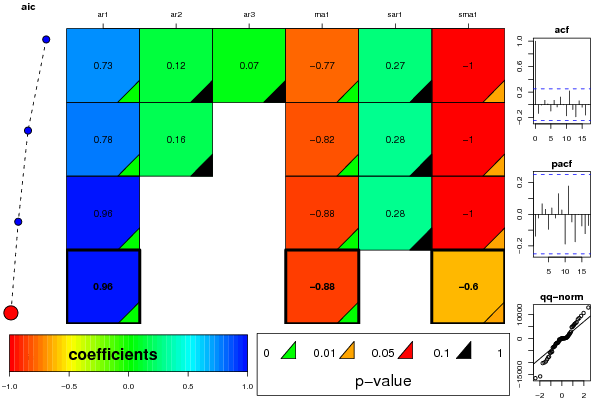
ARIMA Parameter Estimation and Backward Selection
Iterationar1ar2ar3ma1sar1sma1
Estimates ( 1 )0.72710.12010.0721-0.77360.2675-0.9993
(p-val)(0.0095 )(0.5094 )(0.6847 )(0.001 )(0.2184 )(0.011 )
Estimates ( 2 )0.77650.16010-0.8150.2804-1
(p-val)(7e-04 )(0.3042 )(NA )(0 )(0.1904 )(0.013 )
Estimates ( 3 )0.964900-0.87780.2809-0.9998
(p-val)(0 )(NA )(NA )(0 )(0.1898 )(0.0179 )
Estimates ( 4 )0.962400-0.87820-0.6019
(p-val)(0 )(NA )(NA )(0 )(NA )(0.0209 )
Estimates ( 5 )NANANANANANA
(p-val)(NA )(NA )(NA )(NA )(NA )(NA )
Estimates ( 6 )NANANANANANA
(p-val)(NA )(NA )(NA )(NA )(NA )(NA )
Estimates ( 7 )NANANANANANA
(p-val)(NA )(NA )(NA )(NA )(NA )(NA )
Estimates ( 8 )NANANANANANA
(p-val)(NA )(NA )(NA )(NA )(NA )(NA )
Estimates ( 9 )NANANANANANA
(p-val)(NA )(NA )(NA )(NA )(NA )(NA )
Estimates ( 10 )NANANANANANA
(p-val)(NA )(NA )(NA )(NA )(NA )(NA )
Estimates ( 11 )NANANANANANA
(p-val)(NA )(NA )(NA )(NA )(NA )(NA )

\begin{tabular}{lllllllll}
\hline
ARIMA Parameter Estimation and Backward Selection \tabularnewline
Iteration & ar1 & ar2 & ar3 & ma1 & sar1 & sma1 \tabularnewline
Estimates ( 1 ) & 0.7271 & 0.1201 & 0.0721 & -0.7736 & 0.2675 & -0.9993 \tabularnewline
(p-val) & (0.0095 ) & (0.5094 ) & (0.6847 ) & (0.001 ) & (0.2184 ) & (0.011 ) \tabularnewline
Estimates ( 2 ) & 0.7765 & 0.1601 & 0 & -0.815 & 0.2804 & -1 \tabularnewline
(p-val) & (7e-04 ) & (0.3042 ) & (NA ) & (0 ) & (0.1904 ) & (0.013 ) \tabularnewline
Estimates ( 3 ) & 0.9649 & 0 & 0 & -0.8778 & 0.2809 & -0.9998 \tabularnewline
(p-val) & (0 ) & (NA ) & (NA ) & (0 ) & (0.1898 ) & (0.0179 ) \tabularnewline
Estimates ( 4 ) & 0.9624 & 0 & 0 & -0.8782 & 0 & -0.6019 \tabularnewline
(p-val) & (0 ) & (NA ) & (NA ) & (0 ) & (NA ) & (0.0209 ) \tabularnewline
Estimates ( 5 ) & NA & NA & NA & NA & NA & NA \tabularnewline
(p-val) & (NA ) & (NA ) & (NA ) & (NA ) & (NA ) & (NA ) \tabularnewline
Estimates ( 6 ) & NA & NA & NA & NA & NA & NA \tabularnewline
(p-val) & (NA ) & (NA ) & (NA ) & (NA ) & (NA ) & (NA ) \tabularnewline
Estimates ( 7 ) & NA & NA & NA & NA & NA & NA \tabularnewline
(p-val) & (NA ) & (NA ) & (NA ) & (NA ) & (NA ) & (NA ) \tabularnewline
Estimates ( 8 ) & NA & NA & NA & NA & NA & NA \tabularnewline
(p-val) & (NA ) & (NA ) & (NA ) & (NA ) & (NA ) & (NA ) \tabularnewline
Estimates ( 9 ) & NA & NA & NA & NA & NA & NA \tabularnewline
(p-val) & (NA ) & (NA ) & (NA ) & (NA ) & (NA ) & (NA ) \tabularnewline
Estimates ( 10 ) & NA & NA & NA & NA & NA & NA \tabularnewline
(p-val) & (NA ) & (NA ) & (NA ) & (NA ) & (NA ) & (NA ) \tabularnewline
Estimates ( 11 ) & NA & NA & NA & NA & NA & NA \tabularnewline
(p-val) & (NA ) & (NA ) & (NA ) & (NA ) & (NA ) & (NA ) \tabularnewline
\hline
\end{tabular}
%Source: https://freestatistics.org/blog/index.php?pk=32924&T=1

[TABLE]
[ROW][C]ARIMA Parameter Estimation and Backward Selection[/C][/ROW]
[ROW][C]Iteration[/C][C]ar1[/C][C]ar2[/C][C]ar3[/C][C]ma1[/C][C]sar1[/C][C]sma1[/C][/ROW]
[ROW][C]Estimates ( 1 )[/C][C]0.7271[/C][C]0.1201[/C][C]0.0721[/C][C]-0.7736[/C][C]0.2675[/C][C]-0.9993[/C][/ROW]
[ROW][C](p-val)[/C][C](0.0095 )[/C][C](0.5094 )[/C][C](0.6847 )[/C][C](0.001 )[/C][C](0.2184 )[/C][C](0.011 )[/C][/ROW]
[ROW][C]Estimates ( 2 )[/C][C]0.7765[/C][C]0.1601[/C][C]0[/C][C]-0.815[/C][C]0.2804[/C][C]-1[/C][/ROW]
[ROW][C](p-val)[/C][C](7e-04 )[/C][C](0.3042 )[/C][C](NA )[/C][C](0 )[/C][C](0.1904 )[/C][C](0.013 )[/C][/ROW]
[ROW][C]Estimates ( 3 )[/C][C]0.9649[/C][C]0[/C][C]0[/C][C]-0.8778[/C][C]0.2809[/C][C]-0.9998[/C][/ROW]
[ROW][C](p-val)[/C][C](0 )[/C][C](NA )[/C][C](NA )[/C][C](0 )[/C][C](0.1898 )[/C][C](0.0179 )[/C][/ROW]
[ROW][C]Estimates ( 4 )[/C][C]0.9624[/C][C]0[/C][C]0[/C][C]-0.8782[/C][C]0[/C][C]-0.6019[/C][/ROW]
[ROW][C](p-val)[/C][C](0 )[/C][C](NA )[/C][C](NA )[/C][C](0 )[/C][C](NA )[/C][C](0.0209 )[/C][/ROW]
[ROW][C]Estimates ( 5 )[/C][C]NA[/C][C]NA[/C][C]NA[/C][C]NA[/C][C]NA[/C][C]NA[/C][/ROW]
[ROW][C](p-val)[/C][C](NA )[/C][C](NA )[/C][C](NA )[/C][C](NA )[/C][C](NA )[/C][C](NA )[/C][/ROW]
[ROW][C]Estimates ( 6 )[/C][C]NA[/C][C]NA[/C][C]NA[/C][C]NA[/C][C]NA[/C][C]NA[/C][/ROW]
[ROW][C](p-val)[/C][C](NA )[/C][C](NA )[/C][C](NA )[/C][C](NA )[/C][C](NA )[/C][C](NA )[/C][/ROW]
[ROW][C]Estimates ( 7 )[/C][C]NA[/C][C]NA[/C][C]NA[/C][C]NA[/C][C]NA[/C][C]NA[/C][/ROW]
[ROW][C](p-val)[/C][C](NA )[/C][C](NA )[/C][C](NA )[/C][C](NA )[/C][C](NA )[/C][C](NA )[/C][/ROW]
[ROW][C]Estimates ( 8 )[/C][C]NA[/C][C]NA[/C][C]NA[/C][C]NA[/C][C]NA[/C][C]NA[/C][/ROW]
[ROW][C](p-val)[/C][C](NA )[/C][C](NA )[/C][C](NA )[/C][C](NA )[/C][C](NA )[/C][C](NA )[/C][/ROW]
[ROW][C]Estimates ( 9 )[/C][C]NA[/C][C]NA[/C][C]NA[/C][C]NA[/C][C]NA[/C][C]NA[/C][/ROW]
[ROW][C](p-val)[/C][C](NA )[/C][C](NA )[/C][C](NA )[/C][C](NA )[/C][C](NA )[/C][C](NA )[/C][/ROW]
[ROW][C]Estimates ( 10 )[/C][C]NA[/C][C]NA[/C][C]NA[/C][C]NA[/C][C]NA[/C][C]NA[/C][/ROW]
[ROW][C](p-val)[/C][C](NA )[/C][C](NA )[/C][C](NA )[/C][C](NA )[/C][C](NA )[/C][C](NA )[/C][/ROW]
[ROW][C]Estimates ( 11 )[/C][C]NA[/C][C]NA[/C][C]NA[/C][C]NA[/C][C]NA[/C][C]NA[/C][/ROW]
[ROW][C](p-val)[/C][C](NA )[/C][C](NA )[/C][C](NA )[/C][C](NA )[/C][C](NA )[/C][C](NA )[/C][/ROW]
[/TABLE]
Source: https://freestatistics.org/blog/index.php?pk=32924&T=1

Globally Unique Identifier (entire table): ba.freestatistics.org/blog/index.php?pk=32924&T=1

As an alternative you can also use a QR Code:  

The GUIDs for individual cells are displayed in the table below:

ARIMA Parameter Estimation and Backward Selection
Iterationar1ar2ar3ma1sar1sma1
Estimates ( 1 )0.72710.12010.0721-0.77360.2675-0.9993
(p-val)(0.0095 )(0.5094 )(0.6847 )(0.001 )(0.2184 )(0.011 )
Estimates ( 2 )0.77650.16010-0.8150.2804-1
(p-val)(7e-04 )(0.3042 )(NA )(0 )(0.1904 )(0.013 )
Estimates ( 3 )0.964900-0.87780.2809-0.9998
(p-val)(0 )(NA )(NA )(0 )(0.1898 )(0.0179 )
Estimates ( 4 )0.962400-0.87820-0.6019
(p-val)(0 )(NA )(NA )(0 )(NA )(0.0209 )
Estimates ( 5 )NANANANANANA
(p-val)(NA )(NA )(NA )(NA )(NA )(NA )
Estimates ( 6 )NANANANANANA
(p-val)(NA )(NA )(NA )(NA )(NA )(NA )
Estimates ( 7 )NANANANANANA
(p-val)(NA )(NA )(NA )(NA )(NA )(NA )
Estimates ( 8 )NANANANANANA
(p-val)(NA )(NA )(NA )(NA )(NA )(NA )
Estimates ( 9 )NANANANANANA
(p-val)(NA )(NA )(NA )(NA )(NA )(NA )
Estimates ( 10 )NANANANANANA
(p-val)(NA )(NA )(NA )(NA )(NA )(NA )
Estimates ( 11 )NANANANANANA
(p-val)(NA )(NA )(NA )(NA )(NA )(NA )


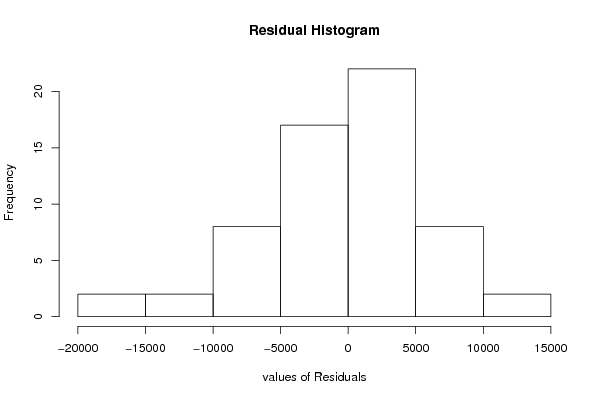
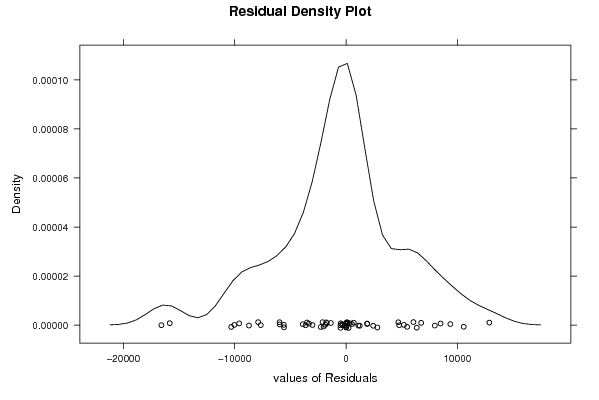
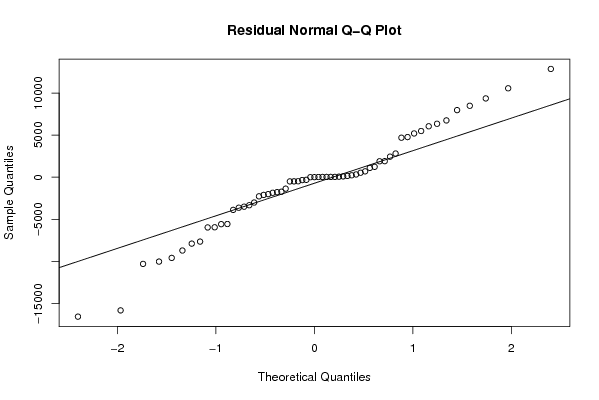
Estimated ARIMA Residuals
Value
-1848.41008916848
5491.96821351625
2442.67589990503
8489.8344421564
-339.109036396039
-5968.18314576167
-10306.3971484059
228.506181650145
699.895301084473
534.004376006063
1236.24795050561
-3503.83378629556
1107.83412110172
-5580.23548050206
-480.535598203962
-8713.69427572871
1908.97413520093
-497.958006772441
-2012.71928246441
-491.014203101057
-3327.99608892922
6352.53470400114
4772.11294423707
-2270.77619091222
-3626.96897939505
-3008.37641481768
-3880.87939586216
-16573.8447665467
-1724.51025027283
-7891.18818968564
6751.0761884188
-5950.65428763142
-5562.39016104372
5202.81144977664
-7652.19072403022
-10029.0226643736
10570.1343181201
2813.84070041396
-15828.3652785442
9367.40277159186
4696.25542812824
7977.30512800648
1894.66520510792
-1359.50610842518
-1774.50104240065
6055.15434340086
-9590.85897890455
12869.4132939755
-2103.37342477568

\begin{tabular}{lllllllll}
\hline
Estimated ARIMA Residuals \tabularnewline
Value \tabularnewline
-1848.41008916848 \tabularnewline
5491.96821351625 \tabularnewline
2442.67589990503 \tabularnewline
8489.8344421564 \tabularnewline
-339.109036396039 \tabularnewline
-5968.18314576167 \tabularnewline
-10306.3971484059 \tabularnewline
228.506181650145 \tabularnewline
699.895301084473 \tabularnewline
534.004376006063 \tabularnewline
1236.24795050561 \tabularnewline
-3503.83378629556 \tabularnewline
1107.83412110172 \tabularnewline
-5580.23548050206 \tabularnewline
-480.535598203962 \tabularnewline
-8713.69427572871 \tabularnewline
1908.97413520093 \tabularnewline
-497.958006772441 \tabularnewline
-2012.71928246441 \tabularnewline
-491.014203101057 \tabularnewline
-3327.99608892922 \tabularnewline
6352.53470400114 \tabularnewline
4772.11294423707 \tabularnewline
-2270.77619091222 \tabularnewline
-3626.96897939505 \tabularnewline
-3008.37641481768 \tabularnewline
-3880.87939586216 \tabularnewline
-16573.8447665467 \tabularnewline
-1724.51025027283 \tabularnewline
-7891.18818968564 \tabularnewline
6751.0761884188 \tabularnewline
-5950.65428763142 \tabularnewline
-5562.39016104372 \tabularnewline
5202.81144977664 \tabularnewline
-7652.19072403022 \tabularnewline
-10029.0226643736 \tabularnewline
10570.1343181201 \tabularnewline
2813.84070041396 \tabularnewline
-15828.3652785442 \tabularnewline
9367.40277159186 \tabularnewline
4696.25542812824 \tabularnewline
7977.30512800648 \tabularnewline
1894.66520510792 \tabularnewline
-1359.50610842518 \tabularnewline
-1774.50104240065 \tabularnewline
6055.15434340086 \tabularnewline
-9590.85897890455 \tabularnewline
12869.4132939755 \tabularnewline
-2103.37342477568 \tabularnewline
\hline
\end{tabular}
%Source: https://freestatistics.org/blog/index.php?pk=32924&T=2

[TABLE]
[ROW][C]Estimated ARIMA Residuals[/C][/ROW]
[ROW][C]Value[/C][/ROW]
[ROW][C]-1848.41008916848[/C][/ROW]
[ROW][C]5491.96821351625[/C][/ROW]
[ROW][C]2442.67589990503[/C][/ROW]
[ROW][C]8489.8344421564[/C][/ROW]
[ROW][C]-339.109036396039[/C][/ROW]
[ROW][C]-5968.18314576167[/C][/ROW]
[ROW][C]-10306.3971484059[/C][/ROW]
[ROW][C]228.506181650145[/C][/ROW]
[ROW][C]699.895301084473[/C][/ROW]
[ROW][C]534.004376006063[/C][/ROW]
[ROW][C]1236.24795050561[/C][/ROW]
[ROW][C]-3503.83378629556[/C][/ROW]
[ROW][C]1107.83412110172[/C][/ROW]
[ROW][C]-5580.23548050206[/C][/ROW]
[ROW][C]-480.535598203962[/C][/ROW]
[ROW][C]-8713.69427572871[/C][/ROW]
[ROW][C]1908.97413520093[/C][/ROW]
[ROW][C]-497.958006772441[/C][/ROW]
[ROW][C]-2012.71928246441[/C][/ROW]
[ROW][C]-491.014203101057[/C][/ROW]
[ROW][C]-3327.99608892922[/C][/ROW]
[ROW][C]6352.53470400114[/C][/ROW]
[ROW][C]4772.11294423707[/C][/ROW]
[ROW][C]-2270.77619091222[/C][/ROW]
[ROW][C]-3626.96897939505[/C][/ROW]
[ROW][C]-3008.37641481768[/C][/ROW]
[ROW][C]-3880.87939586216[/C][/ROW]
[ROW][C]-16573.8447665467[/C][/ROW]
[ROW][C]-1724.51025027283[/C][/ROW]
[ROW][C]-7891.18818968564[/C][/ROW]
[ROW][C]6751.0761884188[/C][/ROW]
[ROW][C]-5950.65428763142[/C][/ROW]
[ROW][C]-5562.39016104372[/C][/ROW]
[ROW][C]5202.81144977664[/C][/ROW]
[ROW][C]-7652.19072403022[/C][/ROW]
[ROW][C]-10029.0226643736[/C][/ROW]
[ROW][C]10570.1343181201[/C][/ROW]
[ROW][C]2813.84070041396[/C][/ROW]
[ROW][C]-15828.3652785442[/C][/ROW]
[ROW][C]9367.40277159186[/C][/ROW]
[ROW][C]4696.25542812824[/C][/ROW]
[ROW][C]7977.30512800648[/C][/ROW]
[ROW][C]1894.66520510792[/C][/ROW]
[ROW][C]-1359.50610842518[/C][/ROW]
[ROW][C]-1774.50104240065[/C][/ROW]
[ROW][C]6055.15434340086[/C][/ROW]
[ROW][C]-9590.85897890455[/C][/ROW]
[ROW][C]12869.4132939755[/C][/ROW]
[ROW][C]-2103.37342477568[/C][/ROW]
[/TABLE]
Source: https://freestatistics.org/blog/index.php?pk=32924&T=2

Globally Unique Identifier (entire table): ba.freestatistics.org/blog/index.php?pk=32924&T=2

As an alternative you can also use a QR Code:  

The GUIDs for individual cells are displayed in the table below:

Estimated ARIMA Residuals
Value
-1848.41008916848
5491.96821351625
2442.67589990503
8489.8344421564
-339.109036396039
-5968.18314576167
-10306.3971484059
228.506181650145
699.895301084473
534.004376006063
1236.24795050561
-3503.83378629556
1107.83412110172
-5580.23548050206
-480.535598203962
-8713.69427572871
1908.97413520093
-497.958006772441
-2012.71928246441
-491.014203101057
-3327.99608892922
6352.53470400114
4772.11294423707
-2270.77619091222
-3626.96897939505
-3008.37641481768
-3880.87939586216
-16573.8447665467
-1724.51025027283
-7891.18818968564
6751.0761884188
-5950.65428763142
-5562.39016104372
5202.81144977664
-7652.19072403022
-10029.0226643736
10570.1343181201
2813.84070041396
-15828.3652785442
9367.40277159186
4696.25542812824
7977.30512800648
1894.66520510792
-1359.50610842518
-1774.50104240065
6055.15434340086
-9590.85897890455
12869.4132939755
-2103.37342477568


Parameters (Session):
par1 = FALSE ; par2 = 1 ; par3 = 1 ; par4 = 1 ; par5 = 12 ; par6 = 3 ; par7 = 1 ; par8 = 1 ; par9 = 1 ;
Parameters (R input):
par1 = FALSE ; par2 = 1 ; par3 = 1 ; par4 = 1 ; par5 = 12 ; par6 = 3 ; par7 = 1 ; par8 = 1 ; par9 = 1 ;
R code (references can be found in the software module):
library(lattice)
if (par1 == 'TRUE') par1 <- TRUE
if (par1 == 'FALSE') par1 <- FALSE
par2 <- as.numeric(par2) #Box-Cox lambda transformation parameter
par3 <- as.numeric(par3) #degree of non-seasonal differencing
par4 <- as.numeric(par4) #degree of seasonal differencing
par5 <- as.numeric(par5) #seasonal period
par6 <- as.numeric(par6) #degree (p) of the non-seasonal AR(p) polynomial
par7 <- as.numeric(par7) #degree (q) of the non-seasonal MA(q) polynomial
par8 <- as.numeric(par8) #degree (P) of the seasonal AR(P) polynomial
par9 <- as.numeric(par9) #degree (Q) of the seasonal MA(Q) polynomial
armaGR <- function(arima.out, names, n){
try1 <- arima.out$coef
try2 <- sqrt(diag(arima.out$var.coef))
try.data.frame <- data.frame(matrix(NA,ncol=4,nrow=length(names)))
dimnames(try.data.frame) <- list(names,c('coef','std','tstat','pv'))
try.data.frame[,1] <- try1
for(i in 1:length(try2)) try.data.frame[which(rownames(try.data.frame)==names(try2)[i]),2] <- try2[i]
try.data.frame[,3] <- try.data.frame[,1] / try.data.frame[,2]
try.data.frame[,4] <- round((1-pt(abs(try.data.frame[,3]),df=n-(length(try2)+1)))*2,5)
vector <- rep(NA,length(names))
vector[is.na(try.data.frame[,4])] <- 0
maxi <- which.max(try.data.frame[,4])
continue <- max(try.data.frame[,4],na.rm=TRUE) > .05
vector[maxi] <- 0
list(summary=try.data.frame,next.vector=vector,continue=continue)
}
arimaSelect <- function(series, order=c(13,0,0), seasonal=list(order=c(2,0,0),period=12), include.mean=F){
nrc <- order[1]+order[3]+seasonal$order[1]+seasonal$order[3]
coeff <- matrix(NA, nrow=nrc*2, ncol=nrc)
pval <- matrix(NA, nrow=nrc*2, ncol=nrc)
mylist <- rep(list(NULL), nrc)
names <- NULL
if(order[1] > 0) names <- paste('ar',1:order[1],sep='')
if(order[3] > 0) names <- c( names , paste('ma',1:order[3],sep='') )
if(seasonal$order[1] > 0) names <- c(names, paste('sar',1:seasonal$order[1],sep=''))
if(seasonal$order[3] > 0) names <- c(names, paste('sma',1:seasonal$order[3],sep=''))
arima.out <- arima(series, order=order, seasonal=seasonal, include.mean=include.mean, method='ML')
mylist[[1]] <- arima.out
last.arma <- armaGR(arima.out, names, length(series))
mystop <- FALSE
i <- 1
coeff[i,] <- last.arma[[1]][,1]
pval [i,] <- last.arma[[1]][,4]
i <- 2
aic <- arima.out$aic
while(!mystop){
mylist[[i]] <- arima.out
arima.out <- arima(series, order=order, seasonal=seasonal, include.mean=include.mean, method='ML', fixed=last.arma$next.vector)
aic <- c(aic, arima.out$aic)
last.arma <- armaGR(arima.out, names, length(series))
mystop <- !last.arma$continue
coeff[i,] <- last.arma[[1]][,1]
pval [i,] <- last.arma[[1]][,4]
i <- i+1
}
list(coeff, pval, mylist, aic=aic)
}
arimaSelectplot <- function(arimaSelect.out,noms,choix){
noms <- names(arimaSelect.out[[3]][[1]]$coef)
coeff <- arimaSelect.out[[1]]
k <- min(which(is.na(coeff[,1])))-1
coeff <- coeff[1:k,]
pval <- arimaSelect.out[[2]][1:k,]
aic <- arimaSelect.out$aic[1:k]
coeff[coeff==0] <- NA
n <- ncol(coeff)
if(missing(choix)) choix <- k
layout(matrix(c(1,1,1,2,
3,3,3,2,
3,3,3,4,
5,6,7,7),nr=4),
widths=c(10,35,45,15),
heights=c(30,30,15,15))
couleurs <- rainbow(75)[1:50]#(50)
ticks <- pretty(coeff)
par(mar=c(1,1,3,1))
plot(aic,k:1-.5,type='o',pch=21,bg='blue',cex=2,axes=F,lty=2,xpd=NA)
points(aic[choix],k-choix+.5,pch=21,cex=4,bg=2,xpd=NA)
title('aic',line=2)
par(mar=c(3,0,0,0))
plot(0,axes=F,xlab='',ylab='',xlim=range(ticks),ylim=c(.1,1))
rect(xleft = min(ticks) + (0:49)/50*(max(ticks)-min(ticks)),
xright = min(ticks) + (1:50)/50*(max(ticks)-min(ticks)),
ytop = rep(1,50),
ybottom= rep(0,50),col=couleurs,border=NA)
axis(1,ticks)
rect(xleft=min(ticks),xright=max(ticks),ytop=1,ybottom=0)
text(mean(coeff,na.rm=T),.5,'coefficients',cex=2,font=2)
par(mar=c(1,1,3,1))
image(1:n,1:k,t(coeff[k:1,]),axes=F,col=couleurs,zlim=range(ticks))
for(i in 1:n) for(j in 1:k) if(!is.na(coeff[j,i])) {
if(pval[j,i]<.01) symb = 'green'
else if( (pval[j,i]<.05) & (pval[j,i]>=.01)) symb = 'orange'
else if( (pval[j,i]<.1) & (pval[j,i]>=.05)) symb = 'red'
else symb = 'black'
polygon(c(i+.5 ,i+.2 ,i+.5 ,i+.5),
c(k-j+0.5,k-j+0.5,k-j+0.8,k-j+0.5),
col=symb)
if(j==choix) {
rect(xleft=i-.5,
xright=i+.5,
ybottom=k-j+1.5,
ytop=k-j+.5,
lwd=4)
text(i,
k-j+1,
round(coeff[j,i],2),
cex=1.2,
font=2)
}
else{
rect(xleft=i-.5,xright=i+.5,ybottom=k-j+1.5,ytop=k-j+.5)
text(i,k-j+1,round(coeff[j,i],2),cex=1.2,font=1)
}
}
axis(3,1:n,noms)
par(mar=c(0.5,0,0,0.5))
plot(0,axes=F,xlab='',ylab='',type='n',xlim=c(0,8),ylim=c(-.2,.8))
cols <- c('green','orange','red','black')
niv <- c('0','0.01','0.05','0.1')
for(i in 0:3){
polygon(c(1+2*i ,1+2*i ,1+2*i-.5 ,1+2*i),
c(.4 ,.7 , .4 , .4),
col=cols[i+1])
text(2*i,0.5,niv[i+1],cex=1.5)
}
text(8,.5,1,cex=1.5)
text(4,0,'p-value',cex=2)
box()
residus <- arimaSelect.out[[3]][[choix]]$res
par(mar=c(1,2,4,1))
acf(residus,main='')
title('acf',line=.5)
par(mar=c(1,2,4,1))
pacf(residus,main='')
title('pacf',line=.5)
par(mar=c(2,2,4,1))
qqnorm(residus,main='')
title('qq-norm',line=.5)
qqline(residus)
residus
}
if (par2 == 0) x <- log(x)
if (par2 != 0) x <- x^par2
(selection <- arimaSelect(x, order=c(par6,par3,par7), seasonal=list(order=c(par8,par4,par9), period=par5)))
bitmap(file='test1.png')
resid <- arimaSelectplot(selection)
dev.off()
resid
bitmap(file='test2.png')
acf(resid,length(resid)/2, main='Residual Autocorrelation Function')
dev.off()
bitmap(file='test3.png')
pacf(resid,length(resid)/2, main='Residual Partial Autocorrelation Function')
dev.off()
bitmap(file='test4.png')
cpgram(resid, main='Residual Cumulative Periodogram')
dev.off()
bitmap(file='test5.png')
hist(resid, main='Residual Histogram', xlab='values of Residuals')
dev.off()
bitmap(file='test6.png')
densityplot(~resid,col='black',main='Residual Density Plot', xlab='values of Residuals')
dev.off()
bitmap(file='test7.png')
qqnorm(resid, main='Residual Normal Q-Q Plot')
qqline(resid)
dev.off()
ncols <- length(selection[[1]][1,])
nrows <- length(selection[[2]][,1])-1
load(file='createtable')
a<-table.start()
a<-table.row.start(a)
a<-table.element(a,'ARIMA Parameter Estimation and Backward Selection', ncols+1,TRUE)
a<-table.row.end(a)
a<-table.row.start(a)
a<-table.element(a,'Iteration', header=TRUE)
for (i in 1:ncols) {
a<-table.element(a,names(selection[[3]][[1]]$coef)[i],header=TRUE)
}
a<-table.row.end(a)
for (j in 1:nrows) {
a<-table.row.start(a)
mydum <- 'Estimates ('
mydum <- paste(mydum,j)
mydum <- paste(mydum,')')
a<-table.element(a,mydum, header=TRUE)
for (i in 1:ncols) {
a<-table.element(a,round(selection[[1]][j,i],4))
}
a<-table.row.end(a)
a<-table.row.start(a)
a<-table.element(a,'(p-val)', header=TRUE)
for (i in 1:ncols) {
mydum <- '('
mydum <- paste(mydum,round(selection[[2]][j,i],4),sep='')
mydum <- paste(mydum,')')
a<-table.element(a,mydum)
}
a<-table.row.end(a)
}
a<-table.end(a)
table.save(a,file='mytable.tab')
a<-table.start()
a<-table.row.start(a)
a<-table.element(a,'Estimated ARIMA Residuals', 1,TRUE)
a<-table.row.end(a)
a<-table.row.start(a)
a<-table.element(a,'Value', 1,TRUE)
a<-table.row.end(a)
for (i in (par4*par5+par3):length(resid)) {
a<-table.row.start(a)
a<-table.element(a,resid[i])
a<-table.row.end(a)
}
a<-table.end(a)
table.save(a,file='mytable1.tab')