Free Statistics

of Irreproducible Research!

Author's title

Author*The author of this computation has been verified*
R Software Modulerwasp_arimabackwardselection.wasp
Title produced by softwareARIMA Backward Selection
Date of computationFri, 12 Dec 2008 15:24:32 -0700
Cite this page as followsStatistical Computations at FreeStatistics.org, Office for Research Development and Education, URL https://freestatistics.org/blog/index.php?v=date/2008/Dec/12/t12291206860a9xa8uyi9pwcvg.htm/, Retrieved Fri, 17 May 2024 14:34:29 +0000
Statistical Computations at FreeStatistics.org, Office for Research Development and Education, URL https://freestatistics.org/blog/index.php?pk=32889, Retrieved Fri, 17 May 2024 14:34:29 +0000
QR Codes:

Original text written by user:
IsPrivate?No (this computation is public)
User-defined keywords
Estimated Impact219
Family? (F = Feedback message, R = changed R code, M = changed R Module, P = changed Parameters, D = changed Data)
F     [Univariate Data Series] [Airline data] [2007-10-18 09:58:47] [42daae401fd3def69a25014f2252b4c2]
F RMPD  [Standard Deviation-Mean Plot] [vraag 5] [2008-11-29 13:37:39] [c45c87b96bbf32ffc2144fc37d767b2e]
- RMPD    [(Partial) Autocorrelation Function] [ACF] [2008-12-12 14:04:37] [c45c87b96bbf32ffc2144fc37d767b2e]
- RMP       [ARIMA Backward Selection] [ABSM] [2008-12-12 19:09:25] [c45c87b96bbf32ffc2144fc37d767b2e]
-   P           [ARIMA Backward Selection] [] [2008-12-12 22:24:32] [19ef54504342c1b076371d395a2ab19f] [Current]
Feedback Forum

Post a new message
Dataseries X:
493
481
462
457
442
439
488
521
501
485
464
460
467
460
448
443
436
431
484
510
513
503
471
471
476
475
470
461
455
456
517
525
523
519
509
512
519
517
510
509
501
507
569
580
578
565
547
555
562
561
555
544
537
543
594
611
613
611
594
595
591
589
584
573
567
569
621
629
628
612
595
597
593
590
580
574
573
573
620
626
620
588
566
557
561
549
532
526
511
499
555
565
542
527
510
514
517
508
493
490
469
478


Summary of computational transaction
Raw Inputview raw input (R code)
Raw Outputview raw output of R engine
Computing time13 seconds
R Server'Gwilym Jenkins' @ 72.249.127.135

\begin{tabular}{lllllllll}
\hline
Summary of computational transaction \tabularnewline
Raw Input & view raw input (R code)  \tabularnewline
Raw Output & view raw output of R engine  \tabularnewline
Computing time & 13 seconds \tabularnewline
R Server & 'Gwilym Jenkins' @ 72.249.127.135 \tabularnewline
\hline
\end{tabular}
%Source: https://freestatistics.org/blog/index.php?pk=32889&T=0

[TABLE]
[ROW][C]Summary of computational transaction[/C][/ROW]
[ROW][C]Raw Input[/C][C]view raw input (R code) [/C][/ROW]
[ROW][C]Raw Output[/C][C]view raw output of R engine [/C][/ROW]
[ROW][C]Computing time[/C][C]13 seconds[/C][/ROW]
[ROW][C]R Server[/C][C]'Gwilym Jenkins' @ 72.249.127.135[/C][/ROW]
[/TABLE]
Source: https://freestatistics.org/blog/index.php?pk=32889&T=0

Globally Unique Identifier (entire table): ba.freestatistics.org/blog/index.php?pk=32889&T=0

As an alternative you can also use a QR Code:  

The GUIDs for individual cells are displayed in the table below:

Summary of computational transaction
Raw Inputview raw input (R code)
Raw Outputview raw output of R engine
Computing time13 seconds
R Server'Gwilym Jenkins' @ 72.249.127.135


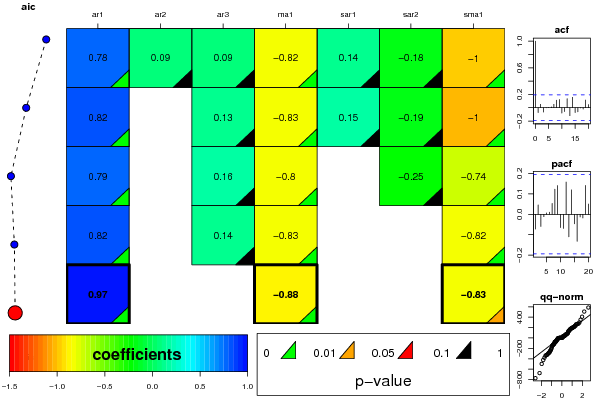
ARIMA Parameter Estimation and Backward Selection
Iterationar1ar2ar3ma1sar1sar2sma1
Estimates ( 1 )0.77850.08660.0921-0.82460.1403-0.1755-0.9999
(p-val)(0 )(0.5399 )(0.4421 )(0 )(0.3527 )(0.3076 )(0.0011 )
Estimates ( 2 )0.82200.1331-0.82610.1531-0.1851-1
(p-val)(0 )(NA )(0.177 )(0 )(0.3094 )(0.2789 )(0.0023 )
Estimates ( 3 )0.794500.1551-0.80460-0.2472-0.7394
(p-val)(0 )(NA )(0.1112 )(0 )(NA )(0.1117 )(0.0015 )
Estimates ( 4 )0.818100.1394-0.825800-0.8233
(p-val)(0 )(NA )(0.1474 )(0 )(NA )(NA )(0.0062 )
Estimates ( 5 )0.970100-0.878200-0.8314
(p-val)(0 )(NA )(NA )(0 )(NA )(NA )(0.0226 )
Estimates ( 6 )NANANANANANANA
(p-val)(NA )(NA )(NA )(NA )(NA )(NA )(NA )
Estimates ( 7 )NANANANANANANA
(p-val)(NA )(NA )(NA )(NA )(NA )(NA )(NA )
Estimates ( 8 )NANANANANANANA
(p-val)(NA )(NA )(NA )(NA )(NA )(NA )(NA )
Estimates ( 9 )NANANANANANANA
(p-val)(NA )(NA )(NA )(NA )(NA )(NA )(NA )
Estimates ( 10 )NANANANANANANA
(p-val)(NA )(NA )(NA )(NA )(NA )(NA )(NA )
Estimates ( 11 )NANANANANANANA
(p-val)(NA )(NA )(NA )(NA )(NA )(NA )(NA )
Estimates ( 12 )NANANANANANANA
(p-val)(NA )(NA )(NA )(NA )(NA )(NA )(NA )
Estimates ( 13 )NANANANANANANA
(p-val)(NA )(NA )(NA )(NA )(NA )(NA )(NA )

\begin{tabular}{lllllllll}
\hline
ARIMA Parameter Estimation and Backward Selection \tabularnewline
Iteration & ar1 & ar2 & ar3 & ma1 & sar1 & sar2 & sma1 \tabularnewline
Estimates ( 1 ) & 0.7785 & 0.0866 & 0.0921 & -0.8246 & 0.1403 & -0.1755 & -0.9999 \tabularnewline
(p-val) & (0 ) & (0.5399 ) & (0.4421 ) & (0 ) & (0.3527 ) & (0.3076 ) & (0.0011 ) \tabularnewline
Estimates ( 2 ) & 0.822 & 0 & 0.1331 & -0.8261 & 0.1531 & -0.1851 & -1 \tabularnewline
(p-val) & (0 ) & (NA ) & (0.177 ) & (0 ) & (0.3094 ) & (0.2789 ) & (0.0023 ) \tabularnewline
Estimates ( 3 ) & 0.7945 & 0 & 0.1551 & -0.8046 & 0 & -0.2472 & -0.7394 \tabularnewline
(p-val) & (0 ) & (NA ) & (0.1112 ) & (0 ) & (NA ) & (0.1117 ) & (0.0015 ) \tabularnewline
Estimates ( 4 ) & 0.8181 & 0 & 0.1394 & -0.8258 & 0 & 0 & -0.8233 \tabularnewline
(p-val) & (0 ) & (NA ) & (0.1474 ) & (0 ) & (NA ) & (NA ) & (0.0062 ) \tabularnewline
Estimates ( 5 ) & 0.9701 & 0 & 0 & -0.8782 & 0 & 0 & -0.8314 \tabularnewline
(p-val) & (0 ) & (NA ) & (NA ) & (0 ) & (NA ) & (NA ) & (0.0226 ) \tabularnewline
Estimates ( 6 ) & NA & NA & NA & NA & NA & NA & NA \tabularnewline
(p-val) & (NA ) & (NA ) & (NA ) & (NA ) & (NA ) & (NA ) & (NA ) \tabularnewline
Estimates ( 7 ) & NA & NA & NA & NA & NA & NA & NA \tabularnewline
(p-val) & (NA ) & (NA ) & (NA ) & (NA ) & (NA ) & (NA ) & (NA ) \tabularnewline
Estimates ( 8 ) & NA & NA & NA & NA & NA & NA & NA \tabularnewline
(p-val) & (NA ) & (NA ) & (NA ) & (NA ) & (NA ) & (NA ) & (NA ) \tabularnewline
Estimates ( 9 ) & NA & NA & NA & NA & NA & NA & NA \tabularnewline
(p-val) & (NA ) & (NA ) & (NA ) & (NA ) & (NA ) & (NA ) & (NA ) \tabularnewline
Estimates ( 10 ) & NA & NA & NA & NA & NA & NA & NA \tabularnewline
(p-val) & (NA ) & (NA ) & (NA ) & (NA ) & (NA ) & (NA ) & (NA ) \tabularnewline
Estimates ( 11 ) & NA & NA & NA & NA & NA & NA & NA \tabularnewline
(p-val) & (NA ) & (NA ) & (NA ) & (NA ) & (NA ) & (NA ) & (NA ) \tabularnewline
Estimates ( 12 ) & NA & NA & NA & NA & NA & NA & NA \tabularnewline
(p-val) & (NA ) & (NA ) & (NA ) & (NA ) & (NA ) & (NA ) & (NA ) \tabularnewline
Estimates ( 13 ) & NA & NA & NA & NA & NA & NA & NA \tabularnewline
(p-val) & (NA ) & (NA ) & (NA ) & (NA ) & (NA ) & (NA ) & (NA ) \tabularnewline
\hline
\end{tabular}
%Source: https://freestatistics.org/blog/index.php?pk=32889&T=1

[TABLE]
[ROW][C]ARIMA Parameter Estimation and Backward Selection[/C][/ROW]
[ROW][C]Iteration[/C][C]ar1[/C][C]ar2[/C][C]ar3[/C][C]ma1[/C][C]sar1[/C][C]sar2[/C][C]sma1[/C][/ROW]
[ROW][C]Estimates ( 1 )[/C][C]0.7785[/C][C]0.0866[/C][C]0.0921[/C][C]-0.8246[/C][C]0.1403[/C][C]-0.1755[/C][C]-0.9999[/C][/ROW]
[ROW][C](p-val)[/C][C](0 )[/C][C](0.5399 )[/C][C](0.4421 )[/C][C](0 )[/C][C](0.3527 )[/C][C](0.3076 )[/C][C](0.0011 )[/C][/ROW]
[ROW][C]Estimates ( 2 )[/C][C]0.822[/C][C]0[/C][C]0.1331[/C][C]-0.8261[/C][C]0.1531[/C][C]-0.1851[/C][C]-1[/C][/ROW]
[ROW][C](p-val)[/C][C](0 )[/C][C](NA )[/C][C](0.177 )[/C][C](0 )[/C][C](0.3094 )[/C][C](0.2789 )[/C][C](0.0023 )[/C][/ROW]
[ROW][C]Estimates ( 3 )[/C][C]0.7945[/C][C]0[/C][C]0.1551[/C][C]-0.8046[/C][C]0[/C][C]-0.2472[/C][C]-0.7394[/C][/ROW]
[ROW][C](p-val)[/C][C](0 )[/C][C](NA )[/C][C](0.1112 )[/C][C](0 )[/C][C](NA )[/C][C](0.1117 )[/C][C](0.0015 )[/C][/ROW]
[ROW][C]Estimates ( 4 )[/C][C]0.8181[/C][C]0[/C][C]0.1394[/C][C]-0.8258[/C][C]0[/C][C]0[/C][C]-0.8233[/C][/ROW]
[ROW][C](p-val)[/C][C](0 )[/C][C](NA )[/C][C](0.1474 )[/C][C](0 )[/C][C](NA )[/C][C](NA )[/C][C](0.0062 )[/C][/ROW]
[ROW][C]Estimates ( 5 )[/C][C]0.9701[/C][C]0[/C][C]0[/C][C]-0.8782[/C][C]0[/C][C]0[/C][C]-0.8314[/C][/ROW]
[ROW][C](p-val)[/C][C](0 )[/C][C](NA )[/C][C](NA )[/C][C](0 )[/C][C](NA )[/C][C](NA )[/C][C](0.0226 )[/C][/ROW]
[ROW][C]Estimates ( 6 )[/C][C]NA[/C][C]NA[/C][C]NA[/C][C]NA[/C][C]NA[/C][C]NA[/C][C]NA[/C][/ROW]
[ROW][C](p-val)[/C][C](NA )[/C][C](NA )[/C][C](NA )[/C][C](NA )[/C][C](NA )[/C][C](NA )[/C][C](NA )[/C][/ROW]
[ROW][C]Estimates ( 7 )[/C][C]NA[/C][C]NA[/C][C]NA[/C][C]NA[/C][C]NA[/C][C]NA[/C][C]NA[/C][/ROW]
[ROW][C](p-val)[/C][C](NA )[/C][C](NA )[/C][C](NA )[/C][C](NA )[/C][C](NA )[/C][C](NA )[/C][C](NA )[/C][/ROW]
[ROW][C]Estimates ( 8 )[/C][C]NA[/C][C]NA[/C][C]NA[/C][C]NA[/C][C]NA[/C][C]NA[/C][C]NA[/C][/ROW]
[ROW][C](p-val)[/C][C](NA )[/C][C](NA )[/C][C](NA )[/C][C](NA )[/C][C](NA )[/C][C](NA )[/C][C](NA )[/C][/ROW]
[ROW][C]Estimates ( 9 )[/C][C]NA[/C][C]NA[/C][C]NA[/C][C]NA[/C][C]NA[/C][C]NA[/C][C]NA[/C][/ROW]
[ROW][C](p-val)[/C][C](NA )[/C][C](NA )[/C][C](NA )[/C][C](NA )[/C][C](NA )[/C][C](NA )[/C][C](NA )[/C][/ROW]
[ROW][C]Estimates ( 10 )[/C][C]NA[/C][C]NA[/C][C]NA[/C][C]NA[/C][C]NA[/C][C]NA[/C][C]NA[/C][/ROW]
[ROW][C](p-val)[/C][C](NA )[/C][C](NA )[/C][C](NA )[/C][C](NA )[/C][C](NA )[/C][C](NA )[/C][C](NA )[/C][/ROW]
[ROW][C]Estimates ( 11 )[/C][C]NA[/C][C]NA[/C][C]NA[/C][C]NA[/C][C]NA[/C][C]NA[/C][C]NA[/C][/ROW]
[ROW][C](p-val)[/C][C](NA )[/C][C](NA )[/C][C](NA )[/C][C](NA )[/C][C](NA )[/C][C](NA )[/C][C](NA )[/C][/ROW]
[ROW][C]Estimates ( 12 )[/C][C]NA[/C][C]NA[/C][C]NA[/C][C]NA[/C][C]NA[/C][C]NA[/C][C]NA[/C][/ROW]
[ROW][C](p-val)[/C][C](NA )[/C][C](NA )[/C][C](NA )[/C][C](NA )[/C][C](NA )[/C][C](NA )[/C][C](NA )[/C][/ROW]
[ROW][C]Estimates ( 13 )[/C][C]NA[/C][C]NA[/C][C]NA[/C][C]NA[/C][C]NA[/C][C]NA[/C][C]NA[/C][/ROW]
[ROW][C](p-val)[/C][C](NA )[/C][C](NA )[/C][C](NA )[/C][C](NA )[/C][C](NA )[/C][C](NA )[/C][C](NA )[/C][/ROW]
[/TABLE]
Source: https://freestatistics.org/blog/index.php?pk=32889&T=1

Globally Unique Identifier (entire table): ba.freestatistics.org/blog/index.php?pk=32889&T=1

As an alternative you can also use a QR Code:  

The GUIDs for individual cells are displayed in the table below:

ARIMA Parameter Estimation and Backward Selection
Iterationar1ar2ar3ma1sar1sar2sma1
Estimates ( 1 )0.77850.08660.0921-0.82460.1403-0.1755-0.9999
(p-val)(0 )(0.5399 )(0.4421 )(0 )(0.3527 )(0.3076 )(0.0011 )
Estimates ( 2 )0.82200.1331-0.82610.1531-0.1851-1
(p-val)(0 )(NA )(0.177 )(0 )(0.3094 )(0.2789 )(0.0023 )
Estimates ( 3 )0.794500.1551-0.80460-0.2472-0.7394
(p-val)(0 )(NA )(0.1112 )(0 )(NA )(0.1117 )(0.0015 )
Estimates ( 4 )0.818100.1394-0.825800-0.8233
(p-val)(0 )(NA )(0.1474 )(0 )(NA )(NA )(0.0062 )
Estimates ( 5 )0.970100-0.878200-0.8314
(p-val)(0 )(NA )(NA )(0 )(NA )(NA )(0.0226 )
Estimates ( 6 )NANANANANANANA
(p-val)(NA )(NA )(NA )(NA )(NA )(NA )(NA )
Estimates ( 7 )NANANANANANANA
(p-val)(NA )(NA )(NA )(NA )(NA )(NA )(NA )
Estimates ( 8 )NANANANANANANA
(p-val)(NA )(NA )(NA )(NA )(NA )(NA )(NA )
Estimates ( 9 )NANANANANANANA
(p-val)(NA )(NA )(NA )(NA )(NA )(NA )(NA )
Estimates ( 10 )NANANANANANANA
(p-val)(NA )(NA )(NA )(NA )(NA )(NA )(NA )
Estimates ( 11 )NANANANANANANA
(p-val)(NA )(NA )(NA )(NA )(NA )(NA )(NA )
Estimates ( 12 )NANANANANANANA
(p-val)(NA )(NA )(NA )(NA )(NA )(NA )(NA )
Estimates ( 13 )NANANANANANANA
(p-val)(NA )(NA )(NA )(NA )(NA )(NA )(NA )


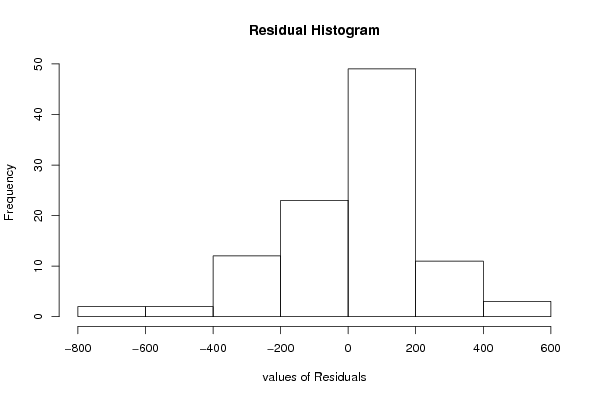
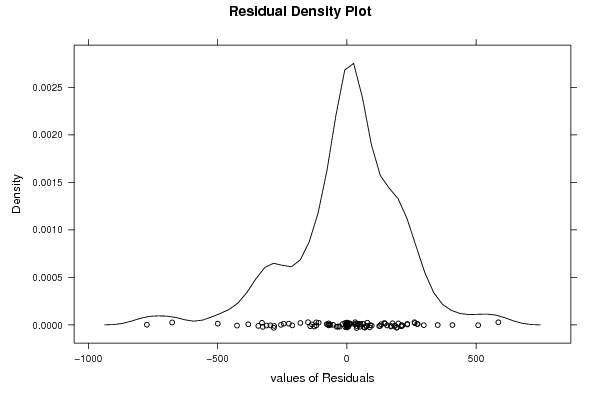
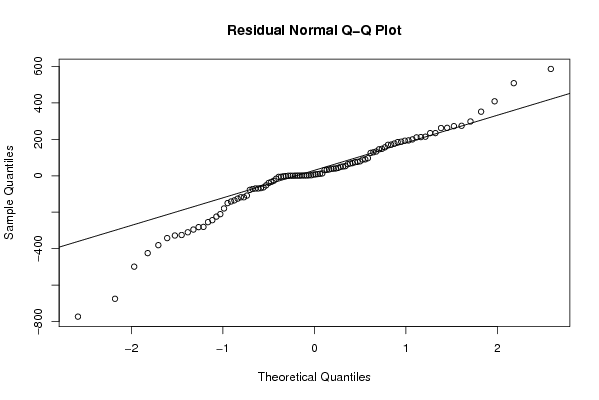
Estimated ARIMA Residuals
Value
-39.3764444418625
132.947443257739
186.895223787161
12.8017316801235
194.017135797846
-69.8592711087664
76.4885916108411
-224.344959922101
586.383874226692
147.783643465338
-254.656876174128
38.9585505908627
-125.662600473275
212.206662065022
262.010830798879
-135.012745139785
90.1421089193308
67.1481118590956
297.936249923663
-675.579349317255
128.858567664670
176.885285942561
508.229533030432
156.062214762549
7.64006541697538
32.5732837838503
31.0040638602402
74.6666284473682
-63.6029992400842
171.149532645773
274.324357805758
-381.077866487743
38.2609054224981
-243.919674653725
0.813151241198847
214.442067573994
9.22283895260628
88.6807212920155
52.6162000592628
-280.805364541774
-27.7214786103772
125.349164954461
-77.6271221810047
-33.8222362909987
192.372747111655
263.084538583628
40.3619017729427
-72.8965272871233
-424.790193272927
-16.2498248709371
63.4406029635647
-179.517372491800
50.6634535554711
-5.82612858507993
43.3591093404935
-325.317223720374
69.4850489021368
-295.428787482792
79.315356153906
34.5369757167729
-210.805365740776
49.1739594529329
-52.6341773836497
96.4222664675565
272.332035092894
-1.99432974982544
-108.855008793732
-328.097339446697
-118.078616830975
-773.566383993443
-69.8105908029587
-310.324507061077
234.07725904727
-149.973584461254
-118.109072434477
169.843979936776
-141.285228115885
-282.078073754440
210.796189336102
10.9723900607986
-499.163238869252
145.246742533634
234.172921002821
351.769377472867
184.731233787623
-2.93743636485452
-67.7902233422127
199.563002957049
-342.321519062701
408.703822394032

\begin{tabular}{lllllllll}
\hline
Estimated ARIMA Residuals \tabularnewline
Value \tabularnewline
-39.3764444418625 \tabularnewline
132.947443257739 \tabularnewline
186.895223787161 \tabularnewline
12.8017316801235 \tabularnewline
194.017135797846 \tabularnewline
-69.8592711087664 \tabularnewline
76.4885916108411 \tabularnewline
-224.344959922101 \tabularnewline
586.383874226692 \tabularnewline
147.783643465338 \tabularnewline
-254.656876174128 \tabularnewline
38.9585505908627 \tabularnewline
-125.662600473275 \tabularnewline
212.206662065022 \tabularnewline
262.010830798879 \tabularnewline
-135.012745139785 \tabularnewline
90.1421089193308 \tabularnewline
67.1481118590956 \tabularnewline
297.936249923663 \tabularnewline
-675.579349317255 \tabularnewline
128.858567664670 \tabularnewline
176.885285942561 \tabularnewline
508.229533030432 \tabularnewline
156.062214762549 \tabularnewline
7.64006541697538 \tabularnewline
32.5732837838503 \tabularnewline
31.0040638602402 \tabularnewline
74.6666284473682 \tabularnewline
-63.6029992400842 \tabularnewline
171.149532645773 \tabularnewline
274.324357805758 \tabularnewline
-381.077866487743 \tabularnewline
38.2609054224981 \tabularnewline
-243.919674653725 \tabularnewline
0.813151241198847 \tabularnewline
214.442067573994 \tabularnewline
9.22283895260628 \tabularnewline
88.6807212920155 \tabularnewline
52.6162000592628 \tabularnewline
-280.805364541774 \tabularnewline
-27.7214786103772 \tabularnewline
125.349164954461 \tabularnewline
-77.6271221810047 \tabularnewline
-33.8222362909987 \tabularnewline
192.372747111655 \tabularnewline
263.084538583628 \tabularnewline
40.3619017729427 \tabularnewline
-72.8965272871233 \tabularnewline
-424.790193272927 \tabularnewline
-16.2498248709371 \tabularnewline
63.4406029635647 \tabularnewline
-179.517372491800 \tabularnewline
50.6634535554711 \tabularnewline
-5.82612858507993 \tabularnewline
43.3591093404935 \tabularnewline
-325.317223720374 \tabularnewline
69.4850489021368 \tabularnewline
-295.428787482792 \tabularnewline
79.315356153906 \tabularnewline
34.5369757167729 \tabularnewline
-210.805365740776 \tabularnewline
49.1739594529329 \tabularnewline
-52.6341773836497 \tabularnewline
96.4222664675565 \tabularnewline
272.332035092894 \tabularnewline
-1.99432974982544 \tabularnewline
-108.855008793732 \tabularnewline
-328.097339446697 \tabularnewline
-118.078616830975 \tabularnewline
-773.566383993443 \tabularnewline
-69.8105908029587 \tabularnewline
-310.324507061077 \tabularnewline
234.07725904727 \tabularnewline
-149.973584461254 \tabularnewline
-118.109072434477 \tabularnewline
169.843979936776 \tabularnewline
-141.285228115885 \tabularnewline
-282.078073754440 \tabularnewline
210.796189336102 \tabularnewline
10.9723900607986 \tabularnewline
-499.163238869252 \tabularnewline
145.246742533634 \tabularnewline
234.172921002821 \tabularnewline
351.769377472867 \tabularnewline
184.731233787623 \tabularnewline
-2.93743636485452 \tabularnewline
-67.7902233422127 \tabularnewline
199.563002957049 \tabularnewline
-342.321519062701 \tabularnewline
408.703822394032 \tabularnewline
\hline
\end{tabular}
%Source: https://freestatistics.org/blog/index.php?pk=32889&T=2

[TABLE]
[ROW][C]Estimated ARIMA Residuals[/C][/ROW]
[ROW][C]Value[/C][/ROW]
[ROW][C]-39.3764444418625[/C][/ROW]
[ROW][C]132.947443257739[/C][/ROW]
[ROW][C]186.895223787161[/C][/ROW]
[ROW][C]12.8017316801235[/C][/ROW]
[ROW][C]194.017135797846[/C][/ROW]
[ROW][C]-69.8592711087664[/C][/ROW]
[ROW][C]76.4885916108411[/C][/ROW]
[ROW][C]-224.344959922101[/C][/ROW]
[ROW][C]586.383874226692[/C][/ROW]
[ROW][C]147.783643465338[/C][/ROW]
[ROW][C]-254.656876174128[/C][/ROW]
[ROW][C]38.9585505908627[/C][/ROW]
[ROW][C]-125.662600473275[/C][/ROW]
[ROW][C]212.206662065022[/C][/ROW]
[ROW][C]262.010830798879[/C][/ROW]
[ROW][C]-135.012745139785[/C][/ROW]
[ROW][C]90.1421089193308[/C][/ROW]
[ROW][C]67.1481118590956[/C][/ROW]
[ROW][C]297.936249923663[/C][/ROW]
[ROW][C]-675.579349317255[/C][/ROW]
[ROW][C]128.858567664670[/C][/ROW]
[ROW][C]176.885285942561[/C][/ROW]
[ROW][C]508.229533030432[/C][/ROW]
[ROW][C]156.062214762549[/C][/ROW]
[ROW][C]7.64006541697538[/C][/ROW]
[ROW][C]32.5732837838503[/C][/ROW]
[ROW][C]31.0040638602402[/C][/ROW]
[ROW][C]74.6666284473682[/C][/ROW]
[ROW][C]-63.6029992400842[/C][/ROW]
[ROW][C]171.149532645773[/C][/ROW]
[ROW][C]274.324357805758[/C][/ROW]
[ROW][C]-381.077866487743[/C][/ROW]
[ROW][C]38.2609054224981[/C][/ROW]
[ROW][C]-243.919674653725[/C][/ROW]
[ROW][C]0.813151241198847[/C][/ROW]
[ROW][C]214.442067573994[/C][/ROW]
[ROW][C]9.22283895260628[/C][/ROW]
[ROW][C]88.6807212920155[/C][/ROW]
[ROW][C]52.6162000592628[/C][/ROW]
[ROW][C]-280.805364541774[/C][/ROW]
[ROW][C]-27.7214786103772[/C][/ROW]
[ROW][C]125.349164954461[/C][/ROW]
[ROW][C]-77.6271221810047[/C][/ROW]
[ROW][C]-33.8222362909987[/C][/ROW]
[ROW][C]192.372747111655[/C][/ROW]
[ROW][C]263.084538583628[/C][/ROW]
[ROW][C]40.3619017729427[/C][/ROW]
[ROW][C]-72.8965272871233[/C][/ROW]
[ROW][C]-424.790193272927[/C][/ROW]
[ROW][C]-16.2498248709371[/C][/ROW]
[ROW][C]63.4406029635647[/C][/ROW]
[ROW][C]-179.517372491800[/C][/ROW]
[ROW][C]50.6634535554711[/C][/ROW]
[ROW][C]-5.82612858507993[/C][/ROW]
[ROW][C]43.3591093404935[/C][/ROW]
[ROW][C]-325.317223720374[/C][/ROW]
[ROW][C]69.4850489021368[/C][/ROW]
[ROW][C]-295.428787482792[/C][/ROW]
[ROW][C]79.315356153906[/C][/ROW]
[ROW][C]34.5369757167729[/C][/ROW]
[ROW][C]-210.805365740776[/C][/ROW]
[ROW][C]49.1739594529329[/C][/ROW]
[ROW][C]-52.6341773836497[/C][/ROW]
[ROW][C]96.4222664675565[/C][/ROW]
[ROW][C]272.332035092894[/C][/ROW]
[ROW][C]-1.99432974982544[/C][/ROW]
[ROW][C]-108.855008793732[/C][/ROW]
[ROW][C]-328.097339446697[/C][/ROW]
[ROW][C]-118.078616830975[/C][/ROW]
[ROW][C]-773.566383993443[/C][/ROW]
[ROW][C]-69.8105908029587[/C][/ROW]
[ROW][C]-310.324507061077[/C][/ROW]
[ROW][C]234.07725904727[/C][/ROW]
[ROW][C]-149.973584461254[/C][/ROW]
[ROW][C]-118.109072434477[/C][/ROW]
[ROW][C]169.843979936776[/C][/ROW]
[ROW][C]-141.285228115885[/C][/ROW]
[ROW][C]-282.078073754440[/C][/ROW]
[ROW][C]210.796189336102[/C][/ROW]
[ROW][C]10.9723900607986[/C][/ROW]
[ROW][C]-499.163238869252[/C][/ROW]
[ROW][C]145.246742533634[/C][/ROW]
[ROW][C]234.172921002821[/C][/ROW]
[ROW][C]351.769377472867[/C][/ROW]
[ROW][C]184.731233787623[/C][/ROW]
[ROW][C]-2.93743636485452[/C][/ROW]
[ROW][C]-67.7902233422127[/C][/ROW]
[ROW][C]199.563002957049[/C][/ROW]
[ROW][C]-342.321519062701[/C][/ROW]
[ROW][C]408.703822394032[/C][/ROW]
[/TABLE]
Source: https://freestatistics.org/blog/index.php?pk=32889&T=2

Globally Unique Identifier (entire table): ba.freestatistics.org/blog/index.php?pk=32889&T=2

As an alternative you can also use a QR Code:  

The GUIDs for individual cells are displayed in the table below:

Estimated ARIMA Residuals
Value
-39.3764444418625
132.947443257739
186.895223787161
12.8017316801235
194.017135797846
-69.8592711087664
76.4885916108411
-224.344959922101
586.383874226692
147.783643465338
-254.656876174128
38.9585505908627
-125.662600473275
212.206662065022
262.010830798879
-135.012745139785
90.1421089193308
67.1481118590956
297.936249923663
-675.579349317255
128.858567664670
176.885285942561
508.229533030432
156.062214762549
7.64006541697538
32.5732837838503
31.0040638602402
74.6666284473682
-63.6029992400842
171.149532645773
274.324357805758
-381.077866487743
38.2609054224981
-243.919674653725
0.813151241198847
214.442067573994
9.22283895260628
88.6807212920155
52.6162000592628
-280.805364541774
-27.7214786103772
125.349164954461
-77.6271221810047
-33.8222362909987
192.372747111655
263.084538583628
40.3619017729427
-72.8965272871233
-424.790193272927
-16.2498248709371
63.4406029635647
-179.517372491800
50.6634535554711
-5.82612858507993
43.3591093404935
-325.317223720374
69.4850489021368
-295.428787482792
79.315356153906
34.5369757167729
-210.805365740776
49.1739594529329
-52.6341773836497
96.4222664675565
272.332035092894
-1.99432974982544
-108.855008793732
-328.097339446697
-118.078616830975
-773.566383993443
-69.8105908029587
-310.324507061077
234.07725904727
-149.973584461254
-118.109072434477
169.843979936776
-141.285228115885
-282.078073754440
210.796189336102
10.9723900607986
-499.163238869252
145.246742533634
234.172921002821
351.769377472867
184.731233787623
-2.93743636485452
-67.7902233422127
199.563002957049
-342.321519062701
408.703822394032


Parameters (Session):
par1 = Default ; par2 = 1 ; par3 = 1 ; par4 = 0 ; par5 = 12 ;
Parameters (R input):
par1 = FALSE ; par2 = 1.5 ; par3 = 1 ; par4 = 1 ; par5 = 12 ; par6 = 3 ; par7 = 1 ; par8 = 2 ; par9 = 1 ; par10 = ; par11 = ; par12 = ; par13 = ; par14 = ; par15 = ; par16 = ; par17 = ; par18 = ; par19 = ; par20 = ;
R code (references can be found in the software module):
library(lattice)
if (par1 == 'TRUE') par1 <- TRUE
if (par1 == 'FALSE') par1 <- FALSE
par2 <- as.numeric(par2) #Box-Cox lambda transformation parameter
par3 <- as.numeric(par3) #degree of non-seasonal differencing
par4 <- as.numeric(par4) #degree of seasonal differencing
par5 <- as.numeric(par5) #seasonal period
par6 <- as.numeric(par6) #degree (p) of the non-seasonal AR(p) polynomial
par7 <- as.numeric(par7) #degree (q) of the non-seasonal MA(q) polynomial
par8 <- as.numeric(par8) #degree (P) of the seasonal AR(P) polynomial
par9 <- as.numeric(par9) #degree (Q) of the seasonal MA(Q) polynomial
armaGR <- function(arima.out, names, n){
try1 <- arima.out$coef
try2 <- sqrt(diag(arima.out$var.coef))
try.data.frame <- data.frame(matrix(NA,ncol=4,nrow=length(names)))
dimnames(try.data.frame) <- list(names,c('coef','std','tstat','pv'))
try.data.frame[,1] <- try1
for(i in 1:length(try2)) try.data.frame[which(rownames(try.data.frame)==names(try2)[i]),2] <- try2[i]
try.data.frame[,3] <- try.data.frame[,1] / try.data.frame[,2]
try.data.frame[,4] <- round((1-pt(abs(try.data.frame[,3]),df=n-(length(try2)+1)))*2,5)
vector <- rep(NA,length(names))
vector[is.na(try.data.frame[,4])] <- 0
maxi <- which.max(try.data.frame[,4])
continue <- max(try.data.frame[,4],na.rm=TRUE) > .05
vector[maxi] <- 0
list(summary=try.data.frame,next.vector=vector,continue=continue)
}
arimaSelect <- function(series, order=c(13,0,0), seasonal=list(order=c(2,0,0),period=12), include.mean=F){
nrc <- order[1]+order[3]+seasonal$order[1]+seasonal$order[3]
coeff <- matrix(NA, nrow=nrc*2, ncol=nrc)
pval <- matrix(NA, nrow=nrc*2, ncol=nrc)
mylist <- rep(list(NULL), nrc)
names <- NULL
if(order[1] > 0) names <- paste('ar',1:order[1],sep='')
if(order[3] > 0) names <- c( names , paste('ma',1:order[3],sep='') )
if(seasonal$order[1] > 0) names <- c(names, paste('sar',1:seasonal$order[1],sep=''))
if(seasonal$order[3] > 0) names <- c(names, paste('sma',1:seasonal$order[3],sep=''))
arima.out <- arima(series, order=order, seasonal=seasonal, include.mean=include.mean, method='ML')
mylist[[1]] <- arima.out
last.arma <- armaGR(arima.out, names, length(series))
mystop <- FALSE
i <- 1
coeff[i,] <- last.arma[[1]][,1]
pval [i,] <- last.arma[[1]][,4]
i <- 2
aic <- arima.out$aic
while(!mystop){
mylist[[i]] <- arima.out
arima.out <- arima(series, order=order, seasonal=seasonal, include.mean=include.mean, method='ML', fixed=last.arma$next.vector)
aic <- c(aic, arima.out$aic)
last.arma <- armaGR(arima.out, names, length(series))
mystop <- !last.arma$continue
coeff[i,] <- last.arma[[1]][,1]
pval [i,] <- last.arma[[1]][,4]
i <- i+1
}
list(coeff, pval, mylist, aic=aic)
}
arimaSelectplot <- function(arimaSelect.out,noms,choix){
noms <- names(arimaSelect.out[[3]][[1]]$coef)
coeff <- arimaSelect.out[[1]]
k <- min(which(is.na(coeff[,1])))-1
coeff <- coeff[1:k,]
pval <- arimaSelect.out[[2]][1:k,]
aic <- arimaSelect.out$aic[1:k]
coeff[coeff==0] <- NA
n <- ncol(coeff)
if(missing(choix)) choix <- k
layout(matrix(c(1,1,1,2,
3,3,3,2,
3,3,3,4,
5,6,7,7),nr=4),
widths=c(10,35,45,15),
heights=c(30,30,15,15))
couleurs <- rainbow(75)[1:50]#(50)
ticks <- pretty(coeff)
par(mar=c(1,1,3,1))
plot(aic,k:1-.5,type='o',pch=21,bg='blue',cex=2,axes=F,lty=2,xpd=NA)
points(aic[choix],k-choix+.5,pch=21,cex=4,bg=2,xpd=NA)
title('aic',line=2)
par(mar=c(3,0,0,0))
plot(0,axes=F,xlab='',ylab='',xlim=range(ticks),ylim=c(.1,1))
rect(xleft = min(ticks) + (0:49)/50*(max(ticks)-min(ticks)),
xright = min(ticks) + (1:50)/50*(max(ticks)-min(ticks)),
ytop = rep(1,50),
ybottom= rep(0,50),col=couleurs,border=NA)
axis(1,ticks)
rect(xleft=min(ticks),xright=max(ticks),ytop=1,ybottom=0)
text(mean(coeff,na.rm=T),.5,'coefficients',cex=2,font=2)
par(mar=c(1,1,3,1))
image(1:n,1:k,t(coeff[k:1,]),axes=F,col=couleurs,zlim=range(ticks))
for(i in 1:n) for(j in 1:k) if(!is.na(coeff[j,i])) {
if(pval[j,i]<.01) symb = 'green'
else if( (pval[j,i]<.05) & (pval[j,i]>=.01)) symb = 'orange'
else if( (pval[j,i]<.1) & (pval[j,i]>=.05)) symb = 'red'
else symb = 'black'
polygon(c(i+.5 ,i+.2 ,i+.5 ,i+.5),
c(k-j+0.5,k-j+0.5,k-j+0.8,k-j+0.5),
col=symb)
if(j==choix) {
rect(xleft=i-.5,
xright=i+.5,
ybottom=k-j+1.5,
ytop=k-j+.5,
lwd=4)
text(i,
k-j+1,
round(coeff[j,i],2),
cex=1.2,
font=2)
}
else{
rect(xleft=i-.5,xright=i+.5,ybottom=k-j+1.5,ytop=k-j+.5)
text(i,k-j+1,round(coeff[j,i],2),cex=1.2,font=1)
}
}
axis(3,1:n,noms)
par(mar=c(0.5,0,0,0.5))
plot(0,axes=F,xlab='',ylab='',type='n',xlim=c(0,8),ylim=c(-.2,.8))
cols <- c('green','orange','red','black')
niv <- c('0','0.01','0.05','0.1')
for(i in 0:3){
polygon(c(1+2*i ,1+2*i ,1+2*i-.5 ,1+2*i),
c(.4 ,.7 , .4 , .4),
col=cols[i+1])
text(2*i,0.5,niv[i+1],cex=1.5)
}
text(8,.5,1,cex=1.5)
text(4,0,'p-value',cex=2)
box()
residus <- arimaSelect.out[[3]][[choix]]$res
par(mar=c(1,2,4,1))
acf(residus,main='')
title('acf',line=.5)
par(mar=c(1,2,4,1))
pacf(residus,main='')
title('pacf',line=.5)
par(mar=c(2,2,4,1))
qqnorm(residus,main='')
title('qq-norm',line=.5)
qqline(residus)
residus
}
if (par2 == 0) x <- log(x)
if (par2 != 0) x <- x^par2
(selection <- arimaSelect(x, order=c(par6,par3,par7), seasonal=list(order=c(par8,par4,par9), period=par5)))
bitmap(file='test1.png')
resid <- arimaSelectplot(selection)
dev.off()
resid
bitmap(file='test2.png')
acf(resid,length(resid)/2, main='Residual Autocorrelation Function')
dev.off()
bitmap(file='test3.png')
pacf(resid,length(resid)/2, main='Residual Partial Autocorrelation Function')
dev.off()
bitmap(file='test4.png')
cpgram(resid, main='Residual Cumulative Periodogram')
dev.off()
bitmap(file='test5.png')
hist(resid, main='Residual Histogram', xlab='values of Residuals')
dev.off()
bitmap(file='test6.png')
densityplot(~resid,col='black',main='Residual Density Plot', xlab='values of Residuals')
dev.off()
bitmap(file='test7.png')
qqnorm(resid, main='Residual Normal Q-Q Plot')
qqline(resid)
dev.off()
ncols <- length(selection[[1]][1,])
nrows <- length(selection[[2]][,1])-1
load(file='createtable')
a<-table.start()
a<-table.row.start(a)
a<-table.element(a,'ARIMA Parameter Estimation and Backward Selection', ncols+1,TRUE)
a<-table.row.end(a)
a<-table.row.start(a)
a<-table.element(a,'Iteration', header=TRUE)
for (i in 1:ncols) {
a<-table.element(a,names(selection[[3]][[1]]$coef)[i],header=TRUE)
}
a<-table.row.end(a)
for (j in 1:nrows) {
a<-table.row.start(a)
mydum <- 'Estimates ('
mydum <- paste(mydum,j)
mydum <- paste(mydum,')')
a<-table.element(a,mydum, header=TRUE)
for (i in 1:ncols) {
a<-table.element(a,round(selection[[1]][j,i],4))
}
a<-table.row.end(a)
a<-table.row.start(a)
a<-table.element(a,'(p-val)', header=TRUE)
for (i in 1:ncols) {
mydum <- '('
mydum <- paste(mydum,round(selection[[2]][j,i],4),sep='')
mydum <- paste(mydum,')')
a<-table.element(a,mydum)
}
a<-table.row.end(a)
}
a<-table.end(a)
table.save(a,file='mytable.tab')
a<-table.start()
a<-table.row.start(a)
a<-table.element(a,'Estimated ARIMA Residuals', 1,TRUE)
a<-table.row.end(a)
a<-table.row.start(a)
a<-table.element(a,'Value', 1,TRUE)
a<-table.row.end(a)
for (i in (par4*par5+par3):length(resid)) {
a<-table.row.start(a)
a<-table.element(a,resid[i])
a<-table.row.end(a)
}
a<-table.end(a)
table.save(a,file='mytable1.tab')