Free Statistics

of Irreproducible Research!

Author's title

Author*The author of this computation has been verified*
R Software Modulerwasp_autocorrelation.wasp
Title produced by software(Partial) Autocorrelation Function
Date of computationFri, 12 Dec 2008 07:38:21 -0700
Cite this page as followsStatistical Computations at FreeStatistics.org, Office for Research Development and Education, URL https://freestatistics.org/blog/index.php?v=date/2008/Dec/12/t1229092819drbxa5fy6494pj8.htm/, Retrieved Fri, 17 May 2024 14:42:16 +0000
Statistical Computations at FreeStatistics.org, Office for Research Development and Education, URL https://freestatistics.org/blog/index.php?pk=32795, Retrieved Fri, 17 May 2024 14:42:16 +0000
QR Codes:

Original text written by user:
IsPrivate?No (this computation is public)
User-defined keywords
Estimated Impact164
Family? (F = Feedback message, R = changed R code, M = changed R Module, P = changed Parameters, D = changed Data)
-     [Univariate Data Series] [data set] [2008-12-01 19:54:57] [b98453cac15ba1066b407e146608df68]
F RMP   [(Partial) Autocorrelation Function] [ACF met alle juis...] [2008-12-07 12:01:48] [7a664918911e34206ce9d0436dd7c1c8]
-   PD      [(Partial) Autocorrelation Function] [Paper - Autocorre...] [2008-12-12 14:38:21] [98255691c21504803b38711776845ae0] [Current]
-   P         [(Partial) Autocorrelation Function] [Paper - autocorre...] [2008-12-19 16:40:53] [7a664918911e34206ce9d0436dd7c1c8]
Feedback Forum

Post a new message
Dataseries X:
14929387.5
14717825.3
15826281.2
16301309.6
15033016.9
16998460.6
14066462.7
13328937.3
17319718.2
17586426.8
15887037.4
17935679.1
15869489
15892510.9
17556558.1
16791643
15953688.5
18144913.6
14390881
13885708.7
17332571.5
17152595.8
16003877.1
16841467.1
14783398.1
14667847.5
17714362.2
16282088
15014866.2
17722582.4
13876509.4
15495489.6
17799521.1
17920079.1
17248022.4
18813782.4
16249688.3
17823358.5
20424438.3
17814218.7
19699959.6
19776328.1
15679833.1
17119266.5
20092613
20863688.3
20925203.1
21032593
20664684.3
19711511.4
22553293.4
19498332.9
20722827.8
21321275
17960847.7
17789654.9
20003708.5
21169851.7
20422839.4
19810562.3


Summary of computational transaction
Raw Inputview raw input (R code)
Raw Outputview raw output of R engine
Computing time2 seconds
R Server'Sir Ronald Aylmer Fisher' @ 193.190.124.24

\begin{tabular}{lllllllll}
\hline
Summary of computational transaction \tabularnewline
Raw Input & view raw input (R code)  \tabularnewline
Raw Output & view raw output of R engine  \tabularnewline
Computing time & 2 seconds \tabularnewline
R Server & 'Sir Ronald Aylmer Fisher' @ 193.190.124.24 \tabularnewline
\hline
\end{tabular}
%Source: https://freestatistics.org/blog/index.php?pk=32795&T=0

[TABLE]
[ROW][C]Summary of computational transaction[/C][/ROW]
[ROW][C]Raw Input[/C][C]view raw input (R code) [/C][/ROW]
[ROW][C]Raw Output[/C][C]view raw output of R engine [/C][/ROW]
[ROW][C]Computing time[/C][C]2 seconds[/C][/ROW]
[ROW][C]R Server[/C][C]'Sir Ronald Aylmer Fisher' @ 193.190.124.24[/C][/ROW]
[/TABLE]
Source: https://freestatistics.org/blog/index.php?pk=32795&T=0

Globally Unique Identifier (entire table): ba.freestatistics.org/blog/index.php?pk=32795&T=0

As an alternative you can also use a QR Code:  

The GUIDs for individual cells are displayed in the table below:

Summary of computational transaction
Raw Inputview raw input (R code)
Raw Outputview raw output of R engine
Computing time2 seconds
R Server'Sir Ronald Aylmer Fisher' @ 193.190.124.24


Autocorrelation Function
Time lag kACF(k)T-STATP-value
1-0.496936-3.40680.000678
20.0816810.560.289078
30.1274810.8740.193291
4-0.092395-0.63340.264763
50.0169040.11590.454119
60.1803971.23670.111164
7-0.239314-1.64070.053773
80.1355070.9290.178821
90.1426690.97810.166519
10-0.181022-1.2410.110378
110.1273820.87330.193473
12-0.181965-1.24750.109199
13-0.004583-0.03140.487533
140.1486941.01940.156618
15-0.067737-0.46440.322258
16-0.176247-1.20830.11649
170.1830251.25480.107885
18-0.068306-0.46830.320874
19-0.039137-0.26830.394818
200.0086370.05920.476516
21-0.042707-0.29280.385487
22-0.044869-0.30760.379872
230.0415820.28510.38842
240.0291130.19960.421332
25-0.21037-1.44220.077935
260.1357570.93070.178382
27-0.051393-0.35230.363081
280.008630.05920.476535
290.0107710.07380.470724
30-0.088098-0.6040.274383
310.042510.29140.386002
320.0769290.52740.300198
33-0.105385-0.72250.236788
340.0660350.45270.326419
350.0137740.09440.462586
36-0.017754-0.12170.451821

\begin{tabular}{lllllllll}
\hline
Autocorrelation Function \tabularnewline
Time lag k & ACF(k) & T-STAT & P-value \tabularnewline
1 & -0.496936 & -3.4068 & 0.000678 \tabularnewline
2 & 0.081681 & 0.56 & 0.289078 \tabularnewline
3 & 0.127481 & 0.874 & 0.193291 \tabularnewline
4 & -0.092395 & -0.6334 & 0.264763 \tabularnewline
5 & 0.016904 & 0.1159 & 0.454119 \tabularnewline
6 & 0.180397 & 1.2367 & 0.111164 \tabularnewline
7 & -0.239314 & -1.6407 & 0.053773 \tabularnewline
8 & 0.135507 & 0.929 & 0.178821 \tabularnewline
9 & 0.142669 & 0.9781 & 0.166519 \tabularnewline
10 & -0.181022 & -1.241 & 0.110378 \tabularnewline
11 & 0.127382 & 0.8733 & 0.193473 \tabularnewline
12 & -0.181965 & -1.2475 & 0.109199 \tabularnewline
13 & -0.004583 & -0.0314 & 0.487533 \tabularnewline
14 & 0.148694 & 1.0194 & 0.156618 \tabularnewline
15 & -0.067737 & -0.4644 & 0.322258 \tabularnewline
16 & -0.176247 & -1.2083 & 0.11649 \tabularnewline
17 & 0.183025 & 1.2548 & 0.107885 \tabularnewline
18 & -0.068306 & -0.4683 & 0.320874 \tabularnewline
19 & -0.039137 & -0.2683 & 0.394818 \tabularnewline
20 & 0.008637 & 0.0592 & 0.476516 \tabularnewline
21 & -0.042707 & -0.2928 & 0.385487 \tabularnewline
22 & -0.044869 & -0.3076 & 0.379872 \tabularnewline
23 & 0.041582 & 0.2851 & 0.38842 \tabularnewline
24 & 0.029113 & 0.1996 & 0.421332 \tabularnewline
25 & -0.21037 & -1.4422 & 0.077935 \tabularnewline
26 & 0.135757 & 0.9307 & 0.178382 \tabularnewline
27 & -0.051393 & -0.3523 & 0.363081 \tabularnewline
28 & 0.00863 & 0.0592 & 0.476535 \tabularnewline
29 & 0.010771 & 0.0738 & 0.470724 \tabularnewline
30 & -0.088098 & -0.604 & 0.274383 \tabularnewline
31 & 0.04251 & 0.2914 & 0.386002 \tabularnewline
32 & 0.076929 & 0.5274 & 0.300198 \tabularnewline
33 & -0.105385 & -0.7225 & 0.236788 \tabularnewline
34 & 0.066035 & 0.4527 & 0.326419 \tabularnewline
35 & 0.013774 & 0.0944 & 0.462586 \tabularnewline
36 & -0.017754 & -0.1217 & 0.451821 \tabularnewline
\hline
\end{tabular}
%Source: https://freestatistics.org/blog/index.php?pk=32795&T=1

[TABLE]
[ROW][C]Autocorrelation Function[/C][/ROW]
[ROW][C]Time lag k[/C][C]ACF(k)[/C][C]T-STAT[/C][C]P-value[/C][/ROW]
[ROW][C]1[/C][C]-0.496936[/C][C]-3.4068[/C][C]0.000678[/C][/ROW]
[ROW][C]2[/C][C]0.081681[/C][C]0.56[/C][C]0.289078[/C][/ROW]
[ROW][C]3[/C][C]0.127481[/C][C]0.874[/C][C]0.193291[/C][/ROW]
[ROW][C]4[/C][C]-0.092395[/C][C]-0.6334[/C][C]0.264763[/C][/ROW]
[ROW][C]5[/C][C]0.016904[/C][C]0.1159[/C][C]0.454119[/C][/ROW]
[ROW][C]6[/C][C]0.180397[/C][C]1.2367[/C][C]0.111164[/C][/ROW]
[ROW][C]7[/C][C]-0.239314[/C][C]-1.6407[/C][C]0.053773[/C][/ROW]
[ROW][C]8[/C][C]0.135507[/C][C]0.929[/C][C]0.178821[/C][/ROW]
[ROW][C]9[/C][C]0.142669[/C][C]0.9781[/C][C]0.166519[/C][/ROW]
[ROW][C]10[/C][C]-0.181022[/C][C]-1.241[/C][C]0.110378[/C][/ROW]
[ROW][C]11[/C][C]0.127382[/C][C]0.8733[/C][C]0.193473[/C][/ROW]
[ROW][C]12[/C][C]-0.181965[/C][C]-1.2475[/C][C]0.109199[/C][/ROW]
[ROW][C]13[/C][C]-0.004583[/C][C]-0.0314[/C][C]0.487533[/C][/ROW]
[ROW][C]14[/C][C]0.148694[/C][C]1.0194[/C][C]0.156618[/C][/ROW]
[ROW][C]15[/C][C]-0.067737[/C][C]-0.4644[/C][C]0.322258[/C][/ROW]
[ROW][C]16[/C][C]-0.176247[/C][C]-1.2083[/C][C]0.11649[/C][/ROW]
[ROW][C]17[/C][C]0.183025[/C][C]1.2548[/C][C]0.107885[/C][/ROW]
[ROW][C]18[/C][C]-0.068306[/C][C]-0.4683[/C][C]0.320874[/C][/ROW]
[ROW][C]19[/C][C]-0.039137[/C][C]-0.2683[/C][C]0.394818[/C][/ROW]
[ROW][C]20[/C][C]0.008637[/C][C]0.0592[/C][C]0.476516[/C][/ROW]
[ROW][C]21[/C][C]-0.042707[/C][C]-0.2928[/C][C]0.385487[/C][/ROW]
[ROW][C]22[/C][C]-0.044869[/C][C]-0.3076[/C][C]0.379872[/C][/ROW]
[ROW][C]23[/C][C]0.041582[/C][C]0.2851[/C][C]0.38842[/C][/ROW]
[ROW][C]24[/C][C]0.029113[/C][C]0.1996[/C][C]0.421332[/C][/ROW]
[ROW][C]25[/C][C]-0.21037[/C][C]-1.4422[/C][C]0.077935[/C][/ROW]
[ROW][C]26[/C][C]0.135757[/C][C]0.9307[/C][C]0.178382[/C][/ROW]
[ROW][C]27[/C][C]-0.051393[/C][C]-0.3523[/C][C]0.363081[/C][/ROW]
[ROW][C]28[/C][C]0.00863[/C][C]0.0592[/C][C]0.476535[/C][/ROW]
[ROW][C]29[/C][C]0.010771[/C][C]0.0738[/C][C]0.470724[/C][/ROW]
[ROW][C]30[/C][C]-0.088098[/C][C]-0.604[/C][C]0.274383[/C][/ROW]
[ROW][C]31[/C][C]0.04251[/C][C]0.2914[/C][C]0.386002[/C][/ROW]
[ROW][C]32[/C][C]0.076929[/C][C]0.5274[/C][C]0.300198[/C][/ROW]
[ROW][C]33[/C][C]-0.105385[/C][C]-0.7225[/C][C]0.236788[/C][/ROW]
[ROW][C]34[/C][C]0.066035[/C][C]0.4527[/C][C]0.326419[/C][/ROW]
[ROW][C]35[/C][C]0.013774[/C][C]0.0944[/C][C]0.462586[/C][/ROW]
[ROW][C]36[/C][C]-0.017754[/C][C]-0.1217[/C][C]0.451821[/C][/ROW]
[/TABLE]
Source: https://freestatistics.org/blog/index.php?pk=32795&T=1

Globally Unique Identifier (entire table): ba.freestatistics.org/blog/index.php?pk=32795&T=1

As an alternative you can also use a QR Code:  

The GUIDs for individual cells are displayed in the table below:

Autocorrelation Function
Time lag kACF(k)T-STATP-value
1-0.496936-3.40680.000678
20.0816810.560.289078
30.1274810.8740.193291
4-0.092395-0.63340.264763
50.0169040.11590.454119
60.1803971.23670.111164
7-0.239314-1.64070.053773
80.1355070.9290.178821
90.1426690.97810.166519
10-0.181022-1.2410.110378
110.1273820.87330.193473
12-0.181965-1.24750.109199
13-0.004583-0.03140.487533
140.1486941.01940.156618
15-0.067737-0.46440.322258
16-0.176247-1.20830.11649
170.1830251.25480.107885
18-0.068306-0.46830.320874
19-0.039137-0.26830.394818
200.0086370.05920.476516
21-0.042707-0.29280.385487
22-0.044869-0.30760.379872
230.0415820.28510.38842
240.0291130.19960.421332
25-0.21037-1.44220.077935
260.1357570.93070.178382
27-0.051393-0.35230.363081
280.008630.05920.476535
290.0107710.07380.470724
30-0.088098-0.6040.274383
310.042510.29140.386002
320.0769290.52740.300198
33-0.105385-0.72250.236788
340.0660350.45270.326419
350.0137740.09440.462586
36-0.017754-0.12170.451821


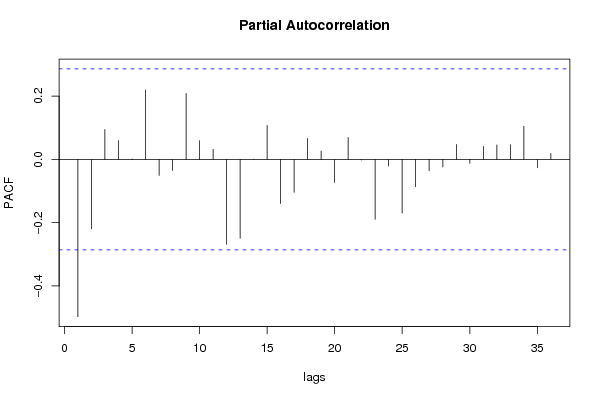
Partial Autocorrelation Function
Time lag kPACF(k)T-STATP-value
1-0.496936-3.40680.000678
2-0.219458-1.50450.069568
30.0947590.64960.259545
40.0598730.41050.341664
50.0012450.00850.496614
60.2195431.50510.069493
7-0.050585-0.34680.365147
8-0.034959-0.23970.405816
90.2085461.42970.079706
100.0588320.40330.344267
110.031870.21850.413996
12-0.268499-1.84070.035989
13-0.249457-1.71020.046912
140.0002920.0020.499206
150.1069640.73330.233506
16-0.139518-0.95650.171861
17-0.103654-0.71060.240417
180.0659060.45180.326735
190.0265980.18230.428047
20-0.072623-0.49790.310446
210.0693320.47530.318383
22-0.001867-0.01280.494921
23-0.189397-1.29840.100236
24-0.020874-0.14310.44341
25-0.169591-1.16270.12542
26-0.086059-0.590.279011
27-0.035753-0.24510.403718
28-0.024153-0.16560.434598
290.047020.32240.374306
30-0.012082-0.08280.467168
310.040620.27850.390933
320.0457090.31340.377696
330.0464920.31870.37567
340.104570.71690.238492
35-0.0266-0.18240.428042
360.0188780.12940.448788

\begin{tabular}{lllllllll}
\hline
Partial Autocorrelation Function \tabularnewline
Time lag k & PACF(k) & T-STAT & P-value \tabularnewline
1 & -0.496936 & -3.4068 & 0.000678 \tabularnewline
2 & -0.219458 & -1.5045 & 0.069568 \tabularnewline
3 & 0.094759 & 0.6496 & 0.259545 \tabularnewline
4 & 0.059873 & 0.4105 & 0.341664 \tabularnewline
5 & 0.001245 & 0.0085 & 0.496614 \tabularnewline
6 & 0.219543 & 1.5051 & 0.069493 \tabularnewline
7 & -0.050585 & -0.3468 & 0.365147 \tabularnewline
8 & -0.034959 & -0.2397 & 0.405816 \tabularnewline
9 & 0.208546 & 1.4297 & 0.079706 \tabularnewline
10 & 0.058832 & 0.4033 & 0.344267 \tabularnewline
11 & 0.03187 & 0.2185 & 0.413996 \tabularnewline
12 & -0.268499 & -1.8407 & 0.035989 \tabularnewline
13 & -0.249457 & -1.7102 & 0.046912 \tabularnewline
14 & 0.000292 & 0.002 & 0.499206 \tabularnewline
15 & 0.106964 & 0.7333 & 0.233506 \tabularnewline
16 & -0.139518 & -0.9565 & 0.171861 \tabularnewline
17 & -0.103654 & -0.7106 & 0.240417 \tabularnewline
18 & 0.065906 & 0.4518 & 0.326735 \tabularnewline
19 & 0.026598 & 0.1823 & 0.428047 \tabularnewline
20 & -0.072623 & -0.4979 & 0.310446 \tabularnewline
21 & 0.069332 & 0.4753 & 0.318383 \tabularnewline
22 & -0.001867 & -0.0128 & 0.494921 \tabularnewline
23 & -0.189397 & -1.2984 & 0.100236 \tabularnewline
24 & -0.020874 & -0.1431 & 0.44341 \tabularnewline
25 & -0.169591 & -1.1627 & 0.12542 \tabularnewline
26 & -0.086059 & -0.59 & 0.279011 \tabularnewline
27 & -0.035753 & -0.2451 & 0.403718 \tabularnewline
28 & -0.024153 & -0.1656 & 0.434598 \tabularnewline
29 & 0.04702 & 0.3224 & 0.374306 \tabularnewline
30 & -0.012082 & -0.0828 & 0.467168 \tabularnewline
31 & 0.04062 & 0.2785 & 0.390933 \tabularnewline
32 & 0.045709 & 0.3134 & 0.377696 \tabularnewline
33 & 0.046492 & 0.3187 & 0.37567 \tabularnewline
34 & 0.10457 & 0.7169 & 0.238492 \tabularnewline
35 & -0.0266 & -0.1824 & 0.428042 \tabularnewline
36 & 0.018878 & 0.1294 & 0.448788 \tabularnewline
\hline
\end{tabular}
%Source: https://freestatistics.org/blog/index.php?pk=32795&T=2

[TABLE]
[ROW][C]Partial Autocorrelation Function[/C][/ROW]
[ROW][C]Time lag k[/C][C]PACF(k)[/C][C]T-STAT[/C][C]P-value[/C][/ROW]
[ROW][C]1[/C][C]-0.496936[/C][C]-3.4068[/C][C]0.000678[/C][/ROW]
[ROW][C]2[/C][C]-0.219458[/C][C]-1.5045[/C][C]0.069568[/C][/ROW]
[ROW][C]3[/C][C]0.094759[/C][C]0.6496[/C][C]0.259545[/C][/ROW]
[ROW][C]4[/C][C]0.059873[/C][C]0.4105[/C][C]0.341664[/C][/ROW]
[ROW][C]5[/C][C]0.001245[/C][C]0.0085[/C][C]0.496614[/C][/ROW]
[ROW][C]6[/C][C]0.219543[/C][C]1.5051[/C][C]0.069493[/C][/ROW]
[ROW][C]7[/C][C]-0.050585[/C][C]-0.3468[/C][C]0.365147[/C][/ROW]
[ROW][C]8[/C][C]-0.034959[/C][C]-0.2397[/C][C]0.405816[/C][/ROW]
[ROW][C]9[/C][C]0.208546[/C][C]1.4297[/C][C]0.079706[/C][/ROW]
[ROW][C]10[/C][C]0.058832[/C][C]0.4033[/C][C]0.344267[/C][/ROW]
[ROW][C]11[/C][C]0.03187[/C][C]0.2185[/C][C]0.413996[/C][/ROW]
[ROW][C]12[/C][C]-0.268499[/C][C]-1.8407[/C][C]0.035989[/C][/ROW]
[ROW][C]13[/C][C]-0.249457[/C][C]-1.7102[/C][C]0.046912[/C][/ROW]
[ROW][C]14[/C][C]0.000292[/C][C]0.002[/C][C]0.499206[/C][/ROW]
[ROW][C]15[/C][C]0.106964[/C][C]0.7333[/C][C]0.233506[/C][/ROW]
[ROW][C]16[/C][C]-0.139518[/C][C]-0.9565[/C][C]0.171861[/C][/ROW]
[ROW][C]17[/C][C]-0.103654[/C][C]-0.7106[/C][C]0.240417[/C][/ROW]
[ROW][C]18[/C][C]0.065906[/C][C]0.4518[/C][C]0.326735[/C][/ROW]
[ROW][C]19[/C][C]0.026598[/C][C]0.1823[/C][C]0.428047[/C][/ROW]
[ROW][C]20[/C][C]-0.072623[/C][C]-0.4979[/C][C]0.310446[/C][/ROW]
[ROW][C]21[/C][C]0.069332[/C][C]0.4753[/C][C]0.318383[/C][/ROW]
[ROW][C]22[/C][C]-0.001867[/C][C]-0.0128[/C][C]0.494921[/C][/ROW]
[ROW][C]23[/C][C]-0.189397[/C][C]-1.2984[/C][C]0.100236[/C][/ROW]
[ROW][C]24[/C][C]-0.020874[/C][C]-0.1431[/C][C]0.44341[/C][/ROW]
[ROW][C]25[/C][C]-0.169591[/C][C]-1.1627[/C][C]0.12542[/C][/ROW]
[ROW][C]26[/C][C]-0.086059[/C][C]-0.59[/C][C]0.279011[/C][/ROW]
[ROW][C]27[/C][C]-0.035753[/C][C]-0.2451[/C][C]0.403718[/C][/ROW]
[ROW][C]28[/C][C]-0.024153[/C][C]-0.1656[/C][C]0.434598[/C][/ROW]
[ROW][C]29[/C][C]0.04702[/C][C]0.3224[/C][C]0.374306[/C][/ROW]
[ROW][C]30[/C][C]-0.012082[/C][C]-0.0828[/C][C]0.467168[/C][/ROW]
[ROW][C]31[/C][C]0.04062[/C][C]0.2785[/C][C]0.390933[/C][/ROW]
[ROW][C]32[/C][C]0.045709[/C][C]0.3134[/C][C]0.377696[/C][/ROW]
[ROW][C]33[/C][C]0.046492[/C][C]0.3187[/C][C]0.37567[/C][/ROW]
[ROW][C]34[/C][C]0.10457[/C][C]0.7169[/C][C]0.238492[/C][/ROW]
[ROW][C]35[/C][C]-0.0266[/C][C]-0.1824[/C][C]0.428042[/C][/ROW]
[ROW][C]36[/C][C]0.018878[/C][C]0.1294[/C][C]0.448788[/C][/ROW]
[/TABLE]
Source: https://freestatistics.org/blog/index.php?pk=32795&T=2

Globally Unique Identifier (entire table): ba.freestatistics.org/blog/index.php?pk=32795&T=2

As an alternative you can also use a QR Code:  

The GUIDs for individual cells are displayed in the table below:

Partial Autocorrelation Function
Time lag kPACF(k)T-STATP-value
1-0.496936-3.40680.000678
2-0.219458-1.50450.069568
30.0947590.64960.259545
40.0598730.41050.341664
50.0012450.00850.496614
60.2195431.50510.069493
7-0.050585-0.34680.365147
8-0.034959-0.23970.405816
90.2085461.42970.079706
100.0588320.40330.344267
110.031870.21850.413996
12-0.268499-1.84070.035989
13-0.249457-1.71020.046912
140.0002920.0020.499206
150.1069640.73330.233506
16-0.139518-0.95650.171861
17-0.103654-0.71060.240417
180.0659060.45180.326735
190.0265980.18230.428047
20-0.072623-0.49790.310446
210.0693320.47530.318383
22-0.001867-0.01280.494921
23-0.189397-1.29840.100236
24-0.020874-0.14310.44341
25-0.169591-1.16270.12542
26-0.086059-0.590.279011
27-0.035753-0.24510.403718
28-0.024153-0.16560.434598
290.047020.32240.374306
30-0.012082-0.08280.467168
310.040620.27850.390933
320.0457090.31340.377696
330.0464920.31870.37567
340.104570.71690.238492
35-0.0266-0.18240.428042
360.0188780.12940.448788


Parameters (Session):
par1 = 36 ; par2 = 0.7 ; par3 = 1 ; par4 = 1 ; par5 = 12 ;
Parameters (R input):
par1 = 36 ; par2 = 0.7 ; par3 = 1 ; par4 = 1 ; par5 = 12 ;
R code (references can be found in the software module):
if (par1 == 'Default') {
par1 = 10*log10(length(x))
} else {
par1 <- as.numeric(par1)
}
par2 <- as.numeric(par2)
par3 <- as.numeric(par3)
par4 <- as.numeric(par4)
par5 <- as.numeric(par5)
if (par2 == 0) {
x <- log(x)
} else {
x <- (x ^ par2 - 1) / par2
}
if (par3 > 0) x <- diff(x,lag=1,difference=par3)
if (par4 > 0) x <- diff(x,lag=par5,difference=par4)
bitmap(file='pic1.png')
racf <- acf(x,par1,main='Autocorrelation',xlab='lags',ylab='ACF')
dev.off()
bitmap(file='pic2.png')
rpacf <- pacf(x,par1,main='Partial Autocorrelation',xlab='lags',ylab='PACF')
dev.off()
(myacf <- c(racf$acf))
(mypacf <- c(rpacf$acf))
lengthx <- length(x)
sqrtn <- sqrt(lengthx)
load(file='createtable')
a<-table.start()
a<-table.row.start(a)
a<-table.element(a,'Autocorrelation Function',4,TRUE)
a<-table.row.end(a)
a<-table.row.start(a)
a<-table.element(a,'Time lag k',header=TRUE)
a<-table.element(a,hyperlink('basics.htm','ACF(k)','click here for more information about the Autocorrelation Function'),header=TRUE)
a<-table.element(a,'T-STAT',header=TRUE)
a<-table.element(a,'P-value',header=TRUE)
a<-table.row.end(a)
for (i in 2:(par1+1)) {
a<-table.row.start(a)
a<-table.element(a,i-1,header=TRUE)
a<-table.element(a,round(myacf[i],6))
mytstat <- myacf[i]*sqrtn
a<-table.element(a,round(mytstat,4))
a<-table.element(a,round(1-pt(abs(mytstat),lengthx),6))
a<-table.row.end(a)
}
a<-table.end(a)
table.save(a,file='mytable.tab')
a<-table.start()
a<-table.row.start(a)
a<-table.element(a,'Partial Autocorrelation Function',4,TRUE)
a<-table.row.end(a)
a<-table.row.start(a)
a<-table.element(a,'Time lag k',header=TRUE)
a<-table.element(a,hyperlink('basics.htm','PACF(k)','click here for more information about the Partial Autocorrelation Function'),header=TRUE)
a<-table.element(a,'T-STAT',header=TRUE)
a<-table.element(a,'P-value',header=TRUE)
a<-table.row.end(a)
for (i in 1:par1) {
a<-table.row.start(a)
a<-table.element(a,i,header=TRUE)
a<-table.element(a,round(mypacf[i],6))
mytstat <- mypacf[i]*sqrtn
a<-table.element(a,round(mytstat,4))
a<-table.element(a,round(1-pt(abs(mytstat),lengthx),6))
a<-table.row.end(a)
}
a<-table.end(a)
table.save(a,file='mytable1.tab')