Free Statistics

of Irreproducible Research!

Author's title

Author*Unverified author*
R Software Modulerwasp_autocorrelation.wasp
Title produced by software(Partial) Autocorrelation Function
Date of computationFri, 12 Dec 2008 07:15:39 -0700
Cite this page as followsStatistical Computations at FreeStatistics.org, Office for Research Development and Education, URL https://freestatistics.org/blog/index.php?v=date/2008/Dec/12/t12290913818qcdvqftjig68qp.htm/, Retrieved Fri, 17 May 2024 14:15:12 +0000
Statistical Computations at FreeStatistics.org, Office for Research Development and Education, URL https://freestatistics.org/blog/index.php?pk=32772, Retrieved Fri, 17 May 2024 14:15:12 +0000
QR Codes:

Original text written by user:
IsPrivate?No (this computation is public)
User-defined keywords
Estimated Impact148
Family? (F = Feedback message, R = changed R code, M = changed R Module, P = changed Parameters, D = changed Data)
-       [(Partial) Autocorrelation Function] [autocor3] [2008-12-12 14:15:39] [cc06a8861fed7dc38682b8f8b87fd97b] [Current]
Feedback Forum

Post a new message
Dataseries X:
60804
57907
54355
52536
49081
48877
64599
75314
71209
65210
59829
57656
57428
55315
52790
51050
48519
48354
65333
73990
72755
67424
59214
57427
56681
55437
53600
51641
49478
50124
71313
76208
74387
69520
64735
63413
62553
60109
57764
55667
53103
55301
76795
80928
79213
72759
67802
66940
66396
67539
67776
68014
68251
68488
68725
68962
69200
69437
68212
65444
63181
61198
59010
56388
53723
55340
75352
79817
78289
71892
66448
64167
61250
59580
56417
54662
53349
55385
73546
77683
74995
67282
60742
57283
57314
54704
51578
49962
46252
47234
64708
68753
62970
57474
52494
51831
51663
49637
46679
45557
41630
44417
60070
63157


Summary of computational transaction
Raw Inputview raw input (R code)
Raw Outputview raw output of R engine
Computing time1 seconds
R Server'George Udny Yule' @ 72.249.76.132

\begin{tabular}{lllllllll}
\hline
Summary of computational transaction \tabularnewline
Raw Input & view raw input (R code)  \tabularnewline
Raw Output & view raw output of R engine  \tabularnewline
Computing time & 1 seconds \tabularnewline
R Server & 'George Udny Yule' @ 72.249.76.132 \tabularnewline
\hline
\end{tabular}
%Source: https://freestatistics.org/blog/index.php?pk=32772&T=0

[TABLE]
[ROW][C]Summary of computational transaction[/C][/ROW]
[ROW][C]Raw Input[/C][C]view raw input (R code) [/C][/ROW]
[ROW][C]Raw Output[/C][C]view raw output of R engine [/C][/ROW]
[ROW][C]Computing time[/C][C]1 seconds[/C][/ROW]
[ROW][C]R Server[/C][C]'George Udny Yule' @ 72.249.76.132[/C][/ROW]
[/TABLE]
Source: https://freestatistics.org/blog/index.php?pk=32772&T=0

Globally Unique Identifier (entire table): ba.freestatistics.org/blog/index.php?pk=32772&T=0

As an alternative you can also use a QR Code:  

The GUIDs for individual cells are displayed in the table below:

Summary of computational transaction
Raw Inputview raw input (R code)
Raw Outputview raw output of R engine
Computing time1 seconds
R Server'George Udny Yule' @ 72.249.76.132


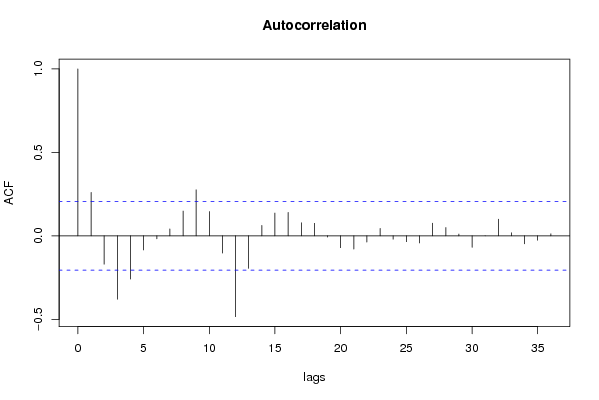
Autocorrelation Function
Time lag kACF(k)T-STATP-value
10.2601652.48180.007454
2-0.169907-1.62080.054259
3-0.379659-3.62170.000241
4-0.259066-2.47130.007661
5-0.08406-0.80190.212354
6-0.017396-0.16590.434284
70.0416890.39770.345896
80.1487751.41920.079625
90.2761132.63390.004959
100.1455411.38840.084206
11-0.103088-0.98340.164009
12-0.483974-4.61686e-06
13-0.194578-1.85620.033334
140.0626590.59770.275753
150.1370071.3070.097259
160.1401671.33710.092261
170.0781710.74570.228883
180.0753320.71860.237107
19-0.007395-0.07050.471958
20-0.070742-0.67480.250745
21-0.079122-0.75480.226167
22-0.037214-0.3550.361705
230.0446140.42560.335704
24-0.019773-0.18860.425406
25-0.034949-0.33340.369801
26-0.042683-0.40720.342419
270.0757710.72280.235825
280.0494910.47210.318989
290.0111620.10650.457718
30-0.068569-0.65410.257347
313e-040.00290.49886
320.1001370.95520.170991
330.0184990.17650.43016
34-0.047891-0.45690.324432
35-0.025998-0.2480.402346
360.0126350.12050.452166

\begin{tabular}{lllllllll}
\hline
Autocorrelation Function \tabularnewline
Time lag k & ACF(k) & T-STAT & P-value \tabularnewline
1 & 0.260165 & 2.4818 & 0.007454 \tabularnewline
2 & -0.169907 & -1.6208 & 0.054259 \tabularnewline
3 & -0.379659 & -3.6217 & 0.000241 \tabularnewline
4 & -0.259066 & -2.4713 & 0.007661 \tabularnewline
5 & -0.08406 & -0.8019 & 0.212354 \tabularnewline
6 & -0.017396 & -0.1659 & 0.434284 \tabularnewline
7 & 0.041689 & 0.3977 & 0.345896 \tabularnewline
8 & 0.148775 & 1.4192 & 0.079625 \tabularnewline
9 & 0.276113 & 2.6339 & 0.004959 \tabularnewline
10 & 0.145541 & 1.3884 & 0.084206 \tabularnewline
11 & -0.103088 & -0.9834 & 0.164009 \tabularnewline
12 & -0.483974 & -4.6168 & 6e-06 \tabularnewline
13 & -0.194578 & -1.8562 & 0.033334 \tabularnewline
14 & 0.062659 & 0.5977 & 0.275753 \tabularnewline
15 & 0.137007 & 1.307 & 0.097259 \tabularnewline
16 & 0.140167 & 1.3371 & 0.092261 \tabularnewline
17 & 0.078171 & 0.7457 & 0.228883 \tabularnewline
18 & 0.075332 & 0.7186 & 0.237107 \tabularnewline
19 & -0.007395 & -0.0705 & 0.471958 \tabularnewline
20 & -0.070742 & -0.6748 & 0.250745 \tabularnewline
21 & -0.079122 & -0.7548 & 0.226167 \tabularnewline
22 & -0.037214 & -0.355 & 0.361705 \tabularnewline
23 & 0.044614 & 0.4256 & 0.335704 \tabularnewline
24 & -0.019773 & -0.1886 & 0.425406 \tabularnewline
25 & -0.034949 & -0.3334 & 0.369801 \tabularnewline
26 & -0.042683 & -0.4072 & 0.342419 \tabularnewline
27 & 0.075771 & 0.7228 & 0.235825 \tabularnewline
28 & 0.049491 & 0.4721 & 0.318989 \tabularnewline
29 & 0.011162 & 0.1065 & 0.457718 \tabularnewline
30 & -0.068569 & -0.6541 & 0.257347 \tabularnewline
31 & 3e-04 & 0.0029 & 0.49886 \tabularnewline
32 & 0.100137 & 0.9552 & 0.170991 \tabularnewline
33 & 0.018499 & 0.1765 & 0.43016 \tabularnewline
34 & -0.047891 & -0.4569 & 0.324432 \tabularnewline
35 & -0.025998 & -0.248 & 0.402346 \tabularnewline
36 & 0.012635 & 0.1205 & 0.452166 \tabularnewline
\hline
\end{tabular}
%Source: https://freestatistics.org/blog/index.php?pk=32772&T=1

[TABLE]
[ROW][C]Autocorrelation Function[/C][/ROW]
[ROW][C]Time lag k[/C][C]ACF(k)[/C][C]T-STAT[/C][C]P-value[/C][/ROW]
[ROW][C]1[/C][C]0.260165[/C][C]2.4818[/C][C]0.007454[/C][/ROW]
[ROW][C]2[/C][C]-0.169907[/C][C]-1.6208[/C][C]0.054259[/C][/ROW]
[ROW][C]3[/C][C]-0.379659[/C][C]-3.6217[/C][C]0.000241[/C][/ROW]
[ROW][C]4[/C][C]-0.259066[/C][C]-2.4713[/C][C]0.007661[/C][/ROW]
[ROW][C]5[/C][C]-0.08406[/C][C]-0.8019[/C][C]0.212354[/C][/ROW]
[ROW][C]6[/C][C]-0.017396[/C][C]-0.1659[/C][C]0.434284[/C][/ROW]
[ROW][C]7[/C][C]0.041689[/C][C]0.3977[/C][C]0.345896[/C][/ROW]
[ROW][C]8[/C][C]0.148775[/C][C]1.4192[/C][C]0.079625[/C][/ROW]
[ROW][C]9[/C][C]0.276113[/C][C]2.6339[/C][C]0.004959[/C][/ROW]
[ROW][C]10[/C][C]0.145541[/C][C]1.3884[/C][C]0.084206[/C][/ROW]
[ROW][C]11[/C][C]-0.103088[/C][C]-0.9834[/C][C]0.164009[/C][/ROW]
[ROW][C]12[/C][C]-0.483974[/C][C]-4.6168[/C][C]6e-06[/C][/ROW]
[ROW][C]13[/C][C]-0.194578[/C][C]-1.8562[/C][C]0.033334[/C][/ROW]
[ROW][C]14[/C][C]0.062659[/C][C]0.5977[/C][C]0.275753[/C][/ROW]
[ROW][C]15[/C][C]0.137007[/C][C]1.307[/C][C]0.097259[/C][/ROW]
[ROW][C]16[/C][C]0.140167[/C][C]1.3371[/C][C]0.092261[/C][/ROW]
[ROW][C]17[/C][C]0.078171[/C][C]0.7457[/C][C]0.228883[/C][/ROW]
[ROW][C]18[/C][C]0.075332[/C][C]0.7186[/C][C]0.237107[/C][/ROW]
[ROW][C]19[/C][C]-0.007395[/C][C]-0.0705[/C][C]0.471958[/C][/ROW]
[ROW][C]20[/C][C]-0.070742[/C][C]-0.6748[/C][C]0.250745[/C][/ROW]
[ROW][C]21[/C][C]-0.079122[/C][C]-0.7548[/C][C]0.226167[/C][/ROW]
[ROW][C]22[/C][C]-0.037214[/C][C]-0.355[/C][C]0.361705[/C][/ROW]
[ROW][C]23[/C][C]0.044614[/C][C]0.4256[/C][C]0.335704[/C][/ROW]
[ROW][C]24[/C][C]-0.019773[/C][C]-0.1886[/C][C]0.425406[/C][/ROW]
[ROW][C]25[/C][C]-0.034949[/C][C]-0.3334[/C][C]0.369801[/C][/ROW]
[ROW][C]26[/C][C]-0.042683[/C][C]-0.4072[/C][C]0.342419[/C][/ROW]
[ROW][C]27[/C][C]0.075771[/C][C]0.7228[/C][C]0.235825[/C][/ROW]
[ROW][C]28[/C][C]0.049491[/C][C]0.4721[/C][C]0.318989[/C][/ROW]
[ROW][C]29[/C][C]0.011162[/C][C]0.1065[/C][C]0.457718[/C][/ROW]
[ROW][C]30[/C][C]-0.068569[/C][C]-0.6541[/C][C]0.257347[/C][/ROW]
[ROW][C]31[/C][C]3e-04[/C][C]0.0029[/C][C]0.49886[/C][/ROW]
[ROW][C]32[/C][C]0.100137[/C][C]0.9552[/C][C]0.170991[/C][/ROW]
[ROW][C]33[/C][C]0.018499[/C][C]0.1765[/C][C]0.43016[/C][/ROW]
[ROW][C]34[/C][C]-0.047891[/C][C]-0.4569[/C][C]0.324432[/C][/ROW]
[ROW][C]35[/C][C]-0.025998[/C][C]-0.248[/C][C]0.402346[/C][/ROW]
[ROW][C]36[/C][C]0.012635[/C][C]0.1205[/C][C]0.452166[/C][/ROW]
[/TABLE]
Source: https://freestatistics.org/blog/index.php?pk=32772&T=1

Globally Unique Identifier (entire table): ba.freestatistics.org/blog/index.php?pk=32772&T=1

As an alternative you can also use a QR Code:  

The GUIDs for individual cells are displayed in the table below:

Autocorrelation Function
Time lag kACF(k)T-STATP-value
10.2601652.48180.007454
2-0.169907-1.62080.054259
3-0.379659-3.62170.000241
4-0.259066-2.47130.007661
5-0.08406-0.80190.212354
6-0.017396-0.16590.434284
70.0416890.39770.345896
80.1487751.41920.079625
90.2761132.63390.004959
100.1455411.38840.084206
11-0.103088-0.98340.164009
12-0.483974-4.61686e-06
13-0.194578-1.85620.033334
140.0626590.59770.275753
150.1370071.3070.097259
160.1401671.33710.092261
170.0781710.74570.228883
180.0753320.71860.237107
19-0.007395-0.07050.471958
20-0.070742-0.67480.250745
21-0.079122-0.75480.226167
22-0.037214-0.3550.361705
230.0446140.42560.335704
24-0.019773-0.18860.425406
25-0.034949-0.33340.369801
26-0.042683-0.40720.342419
270.0757710.72280.235825
280.0494910.47210.318989
290.0111620.10650.457718
30-0.068569-0.65410.257347
313e-040.00290.49886
320.1001370.95520.170991
330.0184990.17650.43016
34-0.047891-0.45690.324432
35-0.025998-0.2480.402346
360.0126350.12050.452166


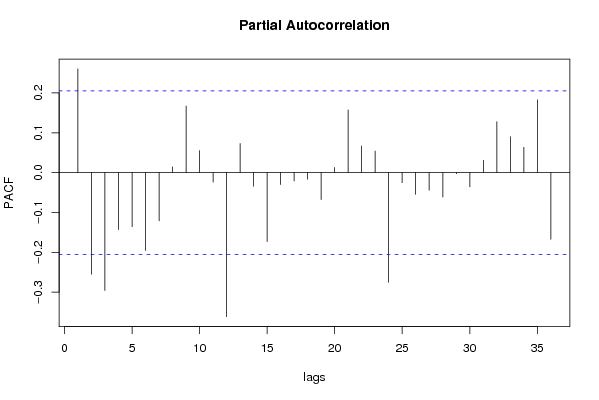
Partial Autocorrelation Function
Time lag kPACF(k)T-STATP-value
10.2601652.48180.007454
2-0.254842-2.4310.008508
3-0.295824-2.8220.00293
4-0.142896-1.36310.088101
5-0.135556-1.29310.099622
6-0.195661-1.86650.032597
7-0.12103-1.15460.125649
80.0142930.13630.445923
90.167141.59440.057156
100.0553860.52830.299272
11-0.023699-0.22610.410825
12-0.361445-3.4480.000429
130.0730550.69690.243821
14-0.034167-0.32590.372612
15-0.172998-1.65030.051165
16-0.029833-0.28460.388304
17-0.020864-0.1990.42134
18-0.016518-0.15760.437573
19-0.067469-0.64360.260722
200.0130030.1240.450777
210.1571931.49950.0686
220.0666010.63530.263401
230.0539890.5150.303893
24-0.275198-2.62520.005079
25-0.025285-0.24120.404971
26-0.054522-0.52010.302125
27-0.04404-0.42010.337695
28-0.06133-0.5850.279981
29-0.002784-0.02660.489436
30-0.035643-0.340.367314
310.0309810.29550.384129
320.1277451.21860.113071
330.0902940.86140.195654
340.0635830.60650.272831
350.1828651.74440.042231
36-0.167143-1.59440.057152

\begin{tabular}{lllllllll}
\hline
Partial Autocorrelation Function \tabularnewline
Time lag k & PACF(k) & T-STAT & P-value \tabularnewline
1 & 0.260165 & 2.4818 & 0.007454 \tabularnewline
2 & -0.254842 & -2.431 & 0.008508 \tabularnewline
3 & -0.295824 & -2.822 & 0.00293 \tabularnewline
4 & -0.142896 & -1.3631 & 0.088101 \tabularnewline
5 & -0.135556 & -1.2931 & 0.099622 \tabularnewline
6 & -0.195661 & -1.8665 & 0.032597 \tabularnewline
7 & -0.12103 & -1.1546 & 0.125649 \tabularnewline
8 & 0.014293 & 0.1363 & 0.445923 \tabularnewline
9 & 0.16714 & 1.5944 & 0.057156 \tabularnewline
10 & 0.055386 & 0.5283 & 0.299272 \tabularnewline
11 & -0.023699 & -0.2261 & 0.410825 \tabularnewline
12 & -0.361445 & -3.448 & 0.000429 \tabularnewline
13 & 0.073055 & 0.6969 & 0.243821 \tabularnewline
14 & -0.034167 & -0.3259 & 0.372612 \tabularnewline
15 & -0.172998 & -1.6503 & 0.051165 \tabularnewline
16 & -0.029833 & -0.2846 & 0.388304 \tabularnewline
17 & -0.020864 & -0.199 & 0.42134 \tabularnewline
18 & -0.016518 & -0.1576 & 0.437573 \tabularnewline
19 & -0.067469 & -0.6436 & 0.260722 \tabularnewline
20 & 0.013003 & 0.124 & 0.450777 \tabularnewline
21 & 0.157193 & 1.4995 & 0.0686 \tabularnewline
22 & 0.066601 & 0.6353 & 0.263401 \tabularnewline
23 & 0.053989 & 0.515 & 0.303893 \tabularnewline
24 & -0.275198 & -2.6252 & 0.005079 \tabularnewline
25 & -0.025285 & -0.2412 & 0.404971 \tabularnewline
26 & -0.054522 & -0.5201 & 0.302125 \tabularnewline
27 & -0.04404 & -0.4201 & 0.337695 \tabularnewline
28 & -0.06133 & -0.585 & 0.279981 \tabularnewline
29 & -0.002784 & -0.0266 & 0.489436 \tabularnewline
30 & -0.035643 & -0.34 & 0.367314 \tabularnewline
31 & 0.030981 & 0.2955 & 0.384129 \tabularnewline
32 & 0.127745 & 1.2186 & 0.113071 \tabularnewline
33 & 0.090294 & 0.8614 & 0.195654 \tabularnewline
34 & 0.063583 & 0.6065 & 0.272831 \tabularnewline
35 & 0.182865 & 1.7444 & 0.042231 \tabularnewline
36 & -0.167143 & -1.5944 & 0.057152 \tabularnewline
\hline
\end{tabular}
%Source: https://freestatistics.org/blog/index.php?pk=32772&T=2

[TABLE]
[ROW][C]Partial Autocorrelation Function[/C][/ROW]
[ROW][C]Time lag k[/C][C]PACF(k)[/C][C]T-STAT[/C][C]P-value[/C][/ROW]
[ROW][C]1[/C][C]0.260165[/C][C]2.4818[/C][C]0.007454[/C][/ROW]
[ROW][C]2[/C][C]-0.254842[/C][C]-2.431[/C][C]0.008508[/C][/ROW]
[ROW][C]3[/C][C]-0.295824[/C][C]-2.822[/C][C]0.00293[/C][/ROW]
[ROW][C]4[/C][C]-0.142896[/C][C]-1.3631[/C][C]0.088101[/C][/ROW]
[ROW][C]5[/C][C]-0.135556[/C][C]-1.2931[/C][C]0.099622[/C][/ROW]
[ROW][C]6[/C][C]-0.195661[/C][C]-1.8665[/C][C]0.032597[/C][/ROW]
[ROW][C]7[/C][C]-0.12103[/C][C]-1.1546[/C][C]0.125649[/C][/ROW]
[ROW][C]8[/C][C]0.014293[/C][C]0.1363[/C][C]0.445923[/C][/ROW]
[ROW][C]9[/C][C]0.16714[/C][C]1.5944[/C][C]0.057156[/C][/ROW]
[ROW][C]10[/C][C]0.055386[/C][C]0.5283[/C][C]0.299272[/C][/ROW]
[ROW][C]11[/C][C]-0.023699[/C][C]-0.2261[/C][C]0.410825[/C][/ROW]
[ROW][C]12[/C][C]-0.361445[/C][C]-3.448[/C][C]0.000429[/C][/ROW]
[ROW][C]13[/C][C]0.073055[/C][C]0.6969[/C][C]0.243821[/C][/ROW]
[ROW][C]14[/C][C]-0.034167[/C][C]-0.3259[/C][C]0.372612[/C][/ROW]
[ROW][C]15[/C][C]-0.172998[/C][C]-1.6503[/C][C]0.051165[/C][/ROW]
[ROW][C]16[/C][C]-0.029833[/C][C]-0.2846[/C][C]0.388304[/C][/ROW]
[ROW][C]17[/C][C]-0.020864[/C][C]-0.199[/C][C]0.42134[/C][/ROW]
[ROW][C]18[/C][C]-0.016518[/C][C]-0.1576[/C][C]0.437573[/C][/ROW]
[ROW][C]19[/C][C]-0.067469[/C][C]-0.6436[/C][C]0.260722[/C][/ROW]
[ROW][C]20[/C][C]0.013003[/C][C]0.124[/C][C]0.450777[/C][/ROW]
[ROW][C]21[/C][C]0.157193[/C][C]1.4995[/C][C]0.0686[/C][/ROW]
[ROW][C]22[/C][C]0.066601[/C][C]0.6353[/C][C]0.263401[/C][/ROW]
[ROW][C]23[/C][C]0.053989[/C][C]0.515[/C][C]0.303893[/C][/ROW]
[ROW][C]24[/C][C]-0.275198[/C][C]-2.6252[/C][C]0.005079[/C][/ROW]
[ROW][C]25[/C][C]-0.025285[/C][C]-0.2412[/C][C]0.404971[/C][/ROW]
[ROW][C]26[/C][C]-0.054522[/C][C]-0.5201[/C][C]0.302125[/C][/ROW]
[ROW][C]27[/C][C]-0.04404[/C][C]-0.4201[/C][C]0.337695[/C][/ROW]
[ROW][C]28[/C][C]-0.06133[/C][C]-0.585[/C][C]0.279981[/C][/ROW]
[ROW][C]29[/C][C]-0.002784[/C][C]-0.0266[/C][C]0.489436[/C][/ROW]
[ROW][C]30[/C][C]-0.035643[/C][C]-0.34[/C][C]0.367314[/C][/ROW]
[ROW][C]31[/C][C]0.030981[/C][C]0.2955[/C][C]0.384129[/C][/ROW]
[ROW][C]32[/C][C]0.127745[/C][C]1.2186[/C][C]0.113071[/C][/ROW]
[ROW][C]33[/C][C]0.090294[/C][C]0.8614[/C][C]0.195654[/C][/ROW]
[ROW][C]34[/C][C]0.063583[/C][C]0.6065[/C][C]0.272831[/C][/ROW]
[ROW][C]35[/C][C]0.182865[/C][C]1.7444[/C][C]0.042231[/C][/ROW]
[ROW][C]36[/C][C]-0.167143[/C][C]-1.5944[/C][C]0.057152[/C][/ROW]
[/TABLE]
Source: https://freestatistics.org/blog/index.php?pk=32772&T=2

Globally Unique Identifier (entire table): ba.freestatistics.org/blog/index.php?pk=32772&T=2

As an alternative you can also use a QR Code:  

The GUIDs for individual cells are displayed in the table below:

Partial Autocorrelation Function
Time lag kPACF(k)T-STATP-value
10.2601652.48180.007454
2-0.254842-2.4310.008508
3-0.295824-2.8220.00293
4-0.142896-1.36310.088101
5-0.135556-1.29310.099622
6-0.195661-1.86650.032597
7-0.12103-1.15460.125649
80.0142930.13630.445923
90.167141.59440.057156
100.0553860.52830.299272
11-0.023699-0.22610.410825
12-0.361445-3.4480.000429
130.0730550.69690.243821
14-0.034167-0.32590.372612
15-0.172998-1.65030.051165
16-0.029833-0.28460.388304
17-0.020864-0.1990.42134
18-0.016518-0.15760.437573
19-0.067469-0.64360.260722
200.0130030.1240.450777
210.1571931.49950.0686
220.0666010.63530.263401
230.0539890.5150.303893
24-0.275198-2.62520.005079
25-0.025285-0.24120.404971
26-0.054522-0.52010.302125
27-0.04404-0.42010.337695
28-0.06133-0.5850.279981
29-0.002784-0.02660.489436
30-0.035643-0.340.367314
310.0309810.29550.384129
320.1277451.21860.113071
330.0902940.86140.195654
340.0635830.60650.272831
350.1828651.74440.042231
36-0.167143-1.59440.057152


Parameters (Session):
par1 = 36 ; par2 = 1 ; par3 = 1 ; par4 = 1 ; par5 = 12 ;
Parameters (R input):
par1 = 36 ; par2 = 1 ; par3 = 1 ; par4 = 1 ; par5 = 12 ;
R code (references can be found in the software module):
if (par1 == 'Default') {
par1 = 10*log10(length(x))
} else {
par1 <- as.numeric(par1)
}
par2 <- as.numeric(par2)
par3 <- as.numeric(par3)
par4 <- as.numeric(par4)
par5 <- as.numeric(par5)
if (par2 == 0) {
x <- log(x)
} else {
x <- (x ^ par2 - 1) / par2
}
if (par3 > 0) x <- diff(x,lag=1,difference=par3)
if (par4 > 0) x <- diff(x,lag=par5,difference=par4)
bitmap(file='pic1.png')
racf <- acf(x,par1,main='Autocorrelation',xlab='lags',ylab='ACF')
dev.off()
bitmap(file='pic2.png')
rpacf <- pacf(x,par1,main='Partial Autocorrelation',xlab='lags',ylab='PACF')
dev.off()
(myacf <- c(racf$acf))
(mypacf <- c(rpacf$acf))
lengthx <- length(x)
sqrtn <- sqrt(lengthx)
load(file='createtable')
a<-table.start()
a<-table.row.start(a)
a<-table.element(a,'Autocorrelation Function',4,TRUE)
a<-table.row.end(a)
a<-table.row.start(a)
a<-table.element(a,'Time lag k',header=TRUE)
a<-table.element(a,hyperlink('basics.htm','ACF(k)','click here for more information about the Autocorrelation Function'),header=TRUE)
a<-table.element(a,'T-STAT',header=TRUE)
a<-table.element(a,'P-value',header=TRUE)
a<-table.row.end(a)
for (i in 2:(par1+1)) {
a<-table.row.start(a)
a<-table.element(a,i-1,header=TRUE)
a<-table.element(a,round(myacf[i],6))
mytstat <- myacf[i]*sqrtn
a<-table.element(a,round(mytstat,4))
a<-table.element(a,round(1-pt(abs(mytstat),lengthx),6))
a<-table.row.end(a)
}
a<-table.end(a)
table.save(a,file='mytable.tab')
a<-table.start()
a<-table.row.start(a)
a<-table.element(a,'Partial Autocorrelation Function',4,TRUE)
a<-table.row.end(a)
a<-table.row.start(a)
a<-table.element(a,'Time lag k',header=TRUE)
a<-table.element(a,hyperlink('basics.htm','PACF(k)','click here for more information about the Partial Autocorrelation Function'),header=TRUE)
a<-table.element(a,'T-STAT',header=TRUE)
a<-table.element(a,'P-value',header=TRUE)
a<-table.row.end(a)
for (i in 1:par1) {
a<-table.row.start(a)
a<-table.element(a,i,header=TRUE)
a<-table.element(a,round(mypacf[i],6))
mytstat <- mypacf[i]*sqrtn
a<-table.element(a,round(mytstat,4))
a<-table.element(a,round(1-pt(abs(mytstat),lengthx),6))
a<-table.row.end(a)
}
a<-table.end(a)
table.save(a,file='mytable1.tab')