Free Statistics

of Irreproducible Research!

Author's title

Author*Unverified author*
R Software Modulerwasp_autocorrelation.wasp
Title produced by software(Partial) Autocorrelation Function
Date of computationFri, 12 Dec 2008 07:09:35 -0700
Cite this page as followsStatistical Computations at FreeStatistics.org, Office for Research Development and Education, URL https://freestatistics.org/blog/index.php?v=date/2008/Dec/12/t12290910844a560jcjdo2br2f.htm/, Retrieved Tue, 21 May 2024 06:43:28 +0000
Statistical Computations at FreeStatistics.org, Office for Research Development and Education, URL https://freestatistics.org/blog/index.php?pk=32762, Retrieved Tue, 21 May 2024 06:43:28 +0000
QR Codes:

Original text written by user:
IsPrivate?No (this computation is public)
User-defined keywordskatrien
Estimated Impact177
Family? (F = Feedback message, R = changed R code, M = changed R Module, P = changed Parameters, D = changed Data)
-       [(Partial) Autocorrelation Function] [autocor] [2008-12-12 14:09:35] [cc06a8861fed7dc38682b8f8b87fd97b] [Current]
Feedback Forum

Post a new message
Dataseries X:
60804
57907
54355
52536
49081
48877
64599
75314
71209
65210
59829
57656
57428
55315
52790
51050
48519
48354
65333
73990
72755
67424
59214
57427
56681
55437
53600
51641
49478
50124
71313
76208
74387
69520
64735
63413
62553
60109
57764
55667
53103
55301
76795
80928
79213
72759
67802
66940
66396
67539
67776
68014
68251
68488
68725
68962
69200
69437
68212
65444
63181
61198
59010
56388
53723
55340
75352
79817
78289
71892
66448
64167
61250
59580
56417
54662
53349
55385
73546
77683
74995
67282
60742
57283
57314
54704
51578
49962
46252
47234
64708
68753
62970
57474
52494
51831
51663
49637
46679
45557
41630
44417
60070
63157


Summary of computational transaction
Raw Inputview raw input (R code)
Raw Outputview raw output of R engine
Computing time3 seconds
R Server'Herman Ole Andreas Wold' @ 193.190.124.10:1001

\begin{tabular}{lllllllll}
\hline
Summary of computational transaction \tabularnewline
Raw Input & view raw input (R code)  \tabularnewline
Raw Output & view raw output of R engine  \tabularnewline
Computing time & 3 seconds \tabularnewline
R Server & 'Herman Ole Andreas Wold' @ 193.190.124.10:1001 \tabularnewline
\hline
\end{tabular}
%Source: https://freestatistics.org/blog/index.php?pk=32762&T=0

[TABLE]
[ROW][C]Summary of computational transaction[/C][/ROW]
[ROW][C]Raw Input[/C][C]view raw input (R code) [/C][/ROW]
[ROW][C]Raw Output[/C][C]view raw output of R engine [/C][/ROW]
[ROW][C]Computing time[/C][C]3 seconds[/C][/ROW]
[ROW][C]R Server[/C][C]'Herman Ole Andreas Wold' @ 193.190.124.10:1001[/C][/ROW]
[/TABLE]
Source: https://freestatistics.org/blog/index.php?pk=32762&T=0

Globally Unique Identifier (entire table): ba.freestatistics.org/blog/index.php?pk=32762&T=0

As an alternative you can also use a QR Code:  

The GUIDs for individual cells are displayed in the table below:

Summary of computational transaction
Raw Inputview raw input (R code)
Raw Outputview raw output of R engine
Computing time3 seconds
R Server'Herman Ole Andreas Wold' @ 193.190.124.10:1001


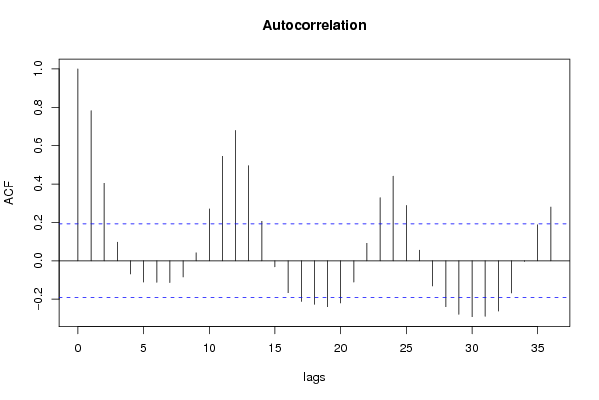
Autocorrelation Function
Time lag kACF(k)T-STATP-value
10.7821487.97640
20.403674.11663.9e-05
30.0971720.9910.162002
4-0.0682-0.69550.244145
5-0.110918-1.13110.130297
6-0.112242-1.14460.127492
7-0.113247-1.15490.125389
8-0.08434-0.86010.195856
90.0419080.42740.334993
100.2701042.75450.00347
110.5445945.55380
120.6795636.93020
130.4958425.05661e-06
140.2060522.10130.019014
15-0.031093-0.31710.375905
16-0.166416-1.69710.046333
17-0.211795-2.15990.016539
18-0.226704-2.31190.011376
19-0.23892-2.43650.008264
20-0.219772-2.24120.013567
21-0.110982-1.13180.13016
220.0910790.92880.177564
230.3290573.35570.000553
240.4413274.50079e-06
250.2886992.94420.001997
260.0555870.56690.286009
27-0.131346-1.33950.091668
28-0.239513-2.44260.008134
29-0.27918-2.84710.002659
30-0.291131-2.9690.001855
31-0.289625-2.95360.001942
32-0.261711-2.66890.004415
33-0.16776-1.71080.045048
34-0.003489-0.03560.485843
350.1877931.91510.029112
360.2801432.85690.002584

\begin{tabular}{lllllllll}
\hline
Autocorrelation Function \tabularnewline
Time lag k & ACF(k) & T-STAT & P-value \tabularnewline
1 & 0.782148 & 7.9764 & 0 \tabularnewline
2 & 0.40367 & 4.1166 & 3.9e-05 \tabularnewline
3 & 0.097172 & 0.991 & 0.162002 \tabularnewline
4 & -0.0682 & -0.6955 & 0.244145 \tabularnewline
5 & -0.110918 & -1.1311 & 0.130297 \tabularnewline
6 & -0.112242 & -1.1446 & 0.127492 \tabularnewline
7 & -0.113247 & -1.1549 & 0.125389 \tabularnewline
8 & -0.08434 & -0.8601 & 0.195856 \tabularnewline
9 & 0.041908 & 0.4274 & 0.334993 \tabularnewline
10 & 0.270104 & 2.7545 & 0.00347 \tabularnewline
11 & 0.544594 & 5.5538 & 0 \tabularnewline
12 & 0.679563 & 6.9302 & 0 \tabularnewline
13 & 0.495842 & 5.0566 & 1e-06 \tabularnewline
14 & 0.206052 & 2.1013 & 0.019014 \tabularnewline
15 & -0.031093 & -0.3171 & 0.375905 \tabularnewline
16 & -0.166416 & -1.6971 & 0.046333 \tabularnewline
17 & -0.211795 & -2.1599 & 0.016539 \tabularnewline
18 & -0.226704 & -2.3119 & 0.011376 \tabularnewline
19 & -0.23892 & -2.4365 & 0.008264 \tabularnewline
20 & -0.219772 & -2.2412 & 0.013567 \tabularnewline
21 & -0.110982 & -1.1318 & 0.13016 \tabularnewline
22 & 0.091079 & 0.9288 & 0.177564 \tabularnewline
23 & 0.329057 & 3.3557 & 0.000553 \tabularnewline
24 & 0.441327 & 4.5007 & 9e-06 \tabularnewline
25 & 0.288699 & 2.9442 & 0.001997 \tabularnewline
26 & 0.055587 & 0.5669 & 0.286009 \tabularnewline
27 & -0.131346 & -1.3395 & 0.091668 \tabularnewline
28 & -0.239513 & -2.4426 & 0.008134 \tabularnewline
29 & -0.27918 & -2.8471 & 0.002659 \tabularnewline
30 & -0.291131 & -2.969 & 0.001855 \tabularnewline
31 & -0.289625 & -2.9536 & 0.001942 \tabularnewline
32 & -0.261711 & -2.6689 & 0.004415 \tabularnewline
33 & -0.16776 & -1.7108 & 0.045048 \tabularnewline
34 & -0.003489 & -0.0356 & 0.485843 \tabularnewline
35 & 0.187793 & 1.9151 & 0.029112 \tabularnewline
36 & 0.280143 & 2.8569 & 0.002584 \tabularnewline
\hline
\end{tabular}
%Source: https://freestatistics.org/blog/index.php?pk=32762&T=1

[TABLE]
[ROW][C]Autocorrelation Function[/C][/ROW]
[ROW][C]Time lag k[/C][C]ACF(k)[/C][C]T-STAT[/C][C]P-value[/C][/ROW]
[ROW][C]1[/C][C]0.782148[/C][C]7.9764[/C][C]0[/C][/ROW]
[ROW][C]2[/C][C]0.40367[/C][C]4.1166[/C][C]3.9e-05[/C][/ROW]
[ROW][C]3[/C][C]0.097172[/C][C]0.991[/C][C]0.162002[/C][/ROW]
[ROW][C]4[/C][C]-0.0682[/C][C]-0.6955[/C][C]0.244145[/C][/ROW]
[ROW][C]5[/C][C]-0.110918[/C][C]-1.1311[/C][C]0.130297[/C][/ROW]
[ROW][C]6[/C][C]-0.112242[/C][C]-1.1446[/C][C]0.127492[/C][/ROW]
[ROW][C]7[/C][C]-0.113247[/C][C]-1.1549[/C][C]0.125389[/C][/ROW]
[ROW][C]8[/C][C]-0.08434[/C][C]-0.8601[/C][C]0.195856[/C][/ROW]
[ROW][C]9[/C][C]0.041908[/C][C]0.4274[/C][C]0.334993[/C][/ROW]
[ROW][C]10[/C][C]0.270104[/C][C]2.7545[/C][C]0.00347[/C][/ROW]
[ROW][C]11[/C][C]0.544594[/C][C]5.5538[/C][C]0[/C][/ROW]
[ROW][C]12[/C][C]0.679563[/C][C]6.9302[/C][C]0[/C][/ROW]
[ROW][C]13[/C][C]0.495842[/C][C]5.0566[/C][C]1e-06[/C][/ROW]
[ROW][C]14[/C][C]0.206052[/C][C]2.1013[/C][C]0.019014[/C][/ROW]
[ROW][C]15[/C][C]-0.031093[/C][C]-0.3171[/C][C]0.375905[/C][/ROW]
[ROW][C]16[/C][C]-0.166416[/C][C]-1.6971[/C][C]0.046333[/C][/ROW]
[ROW][C]17[/C][C]-0.211795[/C][C]-2.1599[/C][C]0.016539[/C][/ROW]
[ROW][C]18[/C][C]-0.226704[/C][C]-2.3119[/C][C]0.011376[/C][/ROW]
[ROW][C]19[/C][C]-0.23892[/C][C]-2.4365[/C][C]0.008264[/C][/ROW]
[ROW][C]20[/C][C]-0.219772[/C][C]-2.2412[/C][C]0.013567[/C][/ROW]
[ROW][C]21[/C][C]-0.110982[/C][C]-1.1318[/C][C]0.13016[/C][/ROW]
[ROW][C]22[/C][C]0.091079[/C][C]0.9288[/C][C]0.177564[/C][/ROW]
[ROW][C]23[/C][C]0.329057[/C][C]3.3557[/C][C]0.000553[/C][/ROW]
[ROW][C]24[/C][C]0.441327[/C][C]4.5007[/C][C]9e-06[/C][/ROW]
[ROW][C]25[/C][C]0.288699[/C][C]2.9442[/C][C]0.001997[/C][/ROW]
[ROW][C]26[/C][C]0.055587[/C][C]0.5669[/C][C]0.286009[/C][/ROW]
[ROW][C]27[/C][C]-0.131346[/C][C]-1.3395[/C][C]0.091668[/C][/ROW]
[ROW][C]28[/C][C]-0.239513[/C][C]-2.4426[/C][C]0.008134[/C][/ROW]
[ROW][C]29[/C][C]-0.27918[/C][C]-2.8471[/C][C]0.002659[/C][/ROW]
[ROW][C]30[/C][C]-0.291131[/C][C]-2.969[/C][C]0.001855[/C][/ROW]
[ROW][C]31[/C][C]-0.289625[/C][C]-2.9536[/C][C]0.001942[/C][/ROW]
[ROW][C]32[/C][C]-0.261711[/C][C]-2.6689[/C][C]0.004415[/C][/ROW]
[ROW][C]33[/C][C]-0.16776[/C][C]-1.7108[/C][C]0.045048[/C][/ROW]
[ROW][C]34[/C][C]-0.003489[/C][C]-0.0356[/C][C]0.485843[/C][/ROW]
[ROW][C]35[/C][C]0.187793[/C][C]1.9151[/C][C]0.029112[/C][/ROW]
[ROW][C]36[/C][C]0.280143[/C][C]2.8569[/C][C]0.002584[/C][/ROW]
[/TABLE]
Source: https://freestatistics.org/blog/index.php?pk=32762&T=1

Globally Unique Identifier (entire table): ba.freestatistics.org/blog/index.php?pk=32762&T=1

As an alternative you can also use a QR Code:  

The GUIDs for individual cells are displayed in the table below:

Autocorrelation Function
Time lag kACF(k)T-STATP-value
10.7821487.97640
20.403674.11663.9e-05
30.0971720.9910.162002
4-0.0682-0.69550.244145
5-0.110918-1.13110.130297
6-0.112242-1.14460.127492
7-0.113247-1.15490.125389
8-0.08434-0.86010.195856
90.0419080.42740.334993
100.2701042.75450.00347
110.5445945.55380
120.6795636.93020
130.4958425.05661e-06
140.2060522.10130.019014
15-0.031093-0.31710.375905
16-0.166416-1.69710.046333
17-0.211795-2.15990.016539
18-0.226704-2.31190.011376
19-0.23892-2.43650.008264
20-0.219772-2.24120.013567
21-0.110982-1.13180.13016
220.0910790.92880.177564
230.3290573.35570.000553
240.4413274.50079e-06
250.2886992.94420.001997
260.0555870.56690.286009
27-0.131346-1.33950.091668
28-0.239513-2.44260.008134
29-0.27918-2.84710.002659
30-0.291131-2.9690.001855
31-0.289625-2.95360.001942
32-0.261711-2.66890.004415
33-0.16776-1.71080.045048
34-0.003489-0.03560.485843
350.1877931.91510.029112
360.2801432.85690.002584


Partial Autocorrelation Function
Time lag kPACF(k)T-STATP-value
10.7821487.97640
2-0.535967-5.46580
30.1135721.15820.124715
4-0.030213-0.30810.379306
50.0187030.19070.424553
6-0.103039-1.05080.147893
7-0.013751-0.14020.444374
80.0888010.90560.183621
90.2581782.63290.004878
100.2701162.75460.003469
110.3762553.83710.000107
12-0.031801-0.32430.373179
13-0.470008-4.79323e-06
140.3050973.11140.001202
15-0.175519-1.78990.038186
16-0.069661-0.71040.239521
17-0.074172-0.75640.225558
18-0.063728-0.64990.258596
19-0.061373-0.62590.266381
20-0.053336-0.54390.293828
21-0.004767-0.04860.480661
220.0553220.56420.286926
23-0.010208-0.10410.458643
240.0031330.0320.487285
25-0.13442-1.37080.086691
260.0797020.81280.209093
27-0.022761-0.23210.408452
28-0.05721-0.58340.280435
29-0.012328-0.12570.450098
300.016260.16580.434311
310.0299990.30590.380134
32-0.062441-0.63680.262834
33-0.04874-0.4970.310102
34-0.007513-0.07660.469539
35-0.019271-0.19650.422292
360.0215460.21970.413256

\begin{tabular}{lllllllll}
\hline
Partial Autocorrelation Function \tabularnewline
Time lag k & PACF(k) & T-STAT & P-value \tabularnewline
1 & 0.782148 & 7.9764 & 0 \tabularnewline
2 & -0.535967 & -5.4658 & 0 \tabularnewline
3 & 0.113572 & 1.1582 & 0.124715 \tabularnewline
4 & -0.030213 & -0.3081 & 0.379306 \tabularnewline
5 & 0.018703 & 0.1907 & 0.424553 \tabularnewline
6 & -0.103039 & -1.0508 & 0.147893 \tabularnewline
7 & -0.013751 & -0.1402 & 0.444374 \tabularnewline
8 & 0.088801 & 0.9056 & 0.183621 \tabularnewline
9 & 0.258178 & 2.6329 & 0.004878 \tabularnewline
10 & 0.270116 & 2.7546 & 0.003469 \tabularnewline
11 & 0.376255 & 3.8371 & 0.000107 \tabularnewline
12 & -0.031801 & -0.3243 & 0.373179 \tabularnewline
13 & -0.470008 & -4.7932 & 3e-06 \tabularnewline
14 & 0.305097 & 3.1114 & 0.001202 \tabularnewline
15 & -0.175519 & -1.7899 & 0.038186 \tabularnewline
16 & -0.069661 & -0.7104 & 0.239521 \tabularnewline
17 & -0.074172 & -0.7564 & 0.225558 \tabularnewline
18 & -0.063728 & -0.6499 & 0.258596 \tabularnewline
19 & -0.061373 & -0.6259 & 0.266381 \tabularnewline
20 & -0.053336 & -0.5439 & 0.293828 \tabularnewline
21 & -0.004767 & -0.0486 & 0.480661 \tabularnewline
22 & 0.055322 & 0.5642 & 0.286926 \tabularnewline
23 & -0.010208 & -0.1041 & 0.458643 \tabularnewline
24 & 0.003133 & 0.032 & 0.487285 \tabularnewline
25 & -0.13442 & -1.3708 & 0.086691 \tabularnewline
26 & 0.079702 & 0.8128 & 0.209093 \tabularnewline
27 & -0.022761 & -0.2321 & 0.408452 \tabularnewline
28 & -0.05721 & -0.5834 & 0.280435 \tabularnewline
29 & -0.012328 & -0.1257 & 0.450098 \tabularnewline
30 & 0.01626 & 0.1658 & 0.434311 \tabularnewline
31 & 0.029999 & 0.3059 & 0.380134 \tabularnewline
32 & -0.062441 & -0.6368 & 0.262834 \tabularnewline
33 & -0.04874 & -0.497 & 0.310102 \tabularnewline
34 & -0.007513 & -0.0766 & 0.469539 \tabularnewline
35 & -0.019271 & -0.1965 & 0.422292 \tabularnewline
36 & 0.021546 & 0.2197 & 0.413256 \tabularnewline
\hline
\end{tabular}
%Source: https://freestatistics.org/blog/index.php?pk=32762&T=2

[TABLE]
[ROW][C]Partial Autocorrelation Function[/C][/ROW]
[ROW][C]Time lag k[/C][C]PACF(k)[/C][C]T-STAT[/C][C]P-value[/C][/ROW]
[ROW][C]1[/C][C]0.782148[/C][C]7.9764[/C][C]0[/C][/ROW]
[ROW][C]2[/C][C]-0.535967[/C][C]-5.4658[/C][C]0[/C][/ROW]
[ROW][C]3[/C][C]0.113572[/C][C]1.1582[/C][C]0.124715[/C][/ROW]
[ROW][C]4[/C][C]-0.030213[/C][C]-0.3081[/C][C]0.379306[/C][/ROW]
[ROW][C]5[/C][C]0.018703[/C][C]0.1907[/C][C]0.424553[/C][/ROW]
[ROW][C]6[/C][C]-0.103039[/C][C]-1.0508[/C][C]0.147893[/C][/ROW]
[ROW][C]7[/C][C]-0.013751[/C][C]-0.1402[/C][C]0.444374[/C][/ROW]
[ROW][C]8[/C][C]0.088801[/C][C]0.9056[/C][C]0.183621[/C][/ROW]
[ROW][C]9[/C][C]0.258178[/C][C]2.6329[/C][C]0.004878[/C][/ROW]
[ROW][C]10[/C][C]0.270116[/C][C]2.7546[/C][C]0.003469[/C][/ROW]
[ROW][C]11[/C][C]0.376255[/C][C]3.8371[/C][C]0.000107[/C][/ROW]
[ROW][C]12[/C][C]-0.031801[/C][C]-0.3243[/C][C]0.373179[/C][/ROW]
[ROW][C]13[/C][C]-0.470008[/C][C]-4.7932[/C][C]3e-06[/C][/ROW]
[ROW][C]14[/C][C]0.305097[/C][C]3.1114[/C][C]0.001202[/C][/ROW]
[ROW][C]15[/C][C]-0.175519[/C][C]-1.7899[/C][C]0.038186[/C][/ROW]
[ROW][C]16[/C][C]-0.069661[/C][C]-0.7104[/C][C]0.239521[/C][/ROW]
[ROW][C]17[/C][C]-0.074172[/C][C]-0.7564[/C][C]0.225558[/C][/ROW]
[ROW][C]18[/C][C]-0.063728[/C][C]-0.6499[/C][C]0.258596[/C][/ROW]
[ROW][C]19[/C][C]-0.061373[/C][C]-0.6259[/C][C]0.266381[/C][/ROW]
[ROW][C]20[/C][C]-0.053336[/C][C]-0.5439[/C][C]0.293828[/C][/ROW]
[ROW][C]21[/C][C]-0.004767[/C][C]-0.0486[/C][C]0.480661[/C][/ROW]
[ROW][C]22[/C][C]0.055322[/C][C]0.5642[/C][C]0.286926[/C][/ROW]
[ROW][C]23[/C][C]-0.010208[/C][C]-0.1041[/C][C]0.458643[/C][/ROW]
[ROW][C]24[/C][C]0.003133[/C][C]0.032[/C][C]0.487285[/C][/ROW]
[ROW][C]25[/C][C]-0.13442[/C][C]-1.3708[/C][C]0.086691[/C][/ROW]
[ROW][C]26[/C][C]0.079702[/C][C]0.8128[/C][C]0.209093[/C][/ROW]
[ROW][C]27[/C][C]-0.022761[/C][C]-0.2321[/C][C]0.408452[/C][/ROW]
[ROW][C]28[/C][C]-0.05721[/C][C]-0.5834[/C][C]0.280435[/C][/ROW]
[ROW][C]29[/C][C]-0.012328[/C][C]-0.1257[/C][C]0.450098[/C][/ROW]
[ROW][C]30[/C][C]0.01626[/C][C]0.1658[/C][C]0.434311[/C][/ROW]
[ROW][C]31[/C][C]0.029999[/C][C]0.3059[/C][C]0.380134[/C][/ROW]
[ROW][C]32[/C][C]-0.062441[/C][C]-0.6368[/C][C]0.262834[/C][/ROW]
[ROW][C]33[/C][C]-0.04874[/C][C]-0.497[/C][C]0.310102[/C][/ROW]
[ROW][C]34[/C][C]-0.007513[/C][C]-0.0766[/C][C]0.469539[/C][/ROW]
[ROW][C]35[/C][C]-0.019271[/C][C]-0.1965[/C][C]0.422292[/C][/ROW]
[ROW][C]36[/C][C]0.021546[/C][C]0.2197[/C][C]0.413256[/C][/ROW]
[/TABLE]
Source: https://freestatistics.org/blog/index.php?pk=32762&T=2

Globally Unique Identifier (entire table): ba.freestatistics.org/blog/index.php?pk=32762&T=2

As an alternative you can also use a QR Code:  

The GUIDs for individual cells are displayed in the table below:

Partial Autocorrelation Function
Time lag kPACF(k)T-STATP-value
10.7821487.97640
2-0.535967-5.46580
30.1135721.15820.124715
4-0.030213-0.30810.379306
50.0187030.19070.424553
6-0.103039-1.05080.147893
7-0.013751-0.14020.444374
80.0888010.90560.183621
90.2581782.63290.004878
100.2701162.75460.003469
110.3762553.83710.000107
12-0.031801-0.32430.373179
13-0.470008-4.79323e-06
140.3050973.11140.001202
15-0.175519-1.78990.038186
16-0.069661-0.71040.239521
17-0.074172-0.75640.225558
18-0.063728-0.64990.258596
19-0.061373-0.62590.266381
20-0.053336-0.54390.293828
21-0.004767-0.04860.480661
220.0553220.56420.286926
23-0.010208-0.10410.458643
240.0031330.0320.487285
25-0.13442-1.37080.086691
260.0797020.81280.209093
27-0.022761-0.23210.408452
28-0.05721-0.58340.280435
29-0.012328-0.12570.450098
300.016260.16580.434311
310.0299990.30590.380134
32-0.062441-0.63680.262834
33-0.04874-0.4970.310102
34-0.007513-0.07660.469539
35-0.019271-0.19650.422292
360.0215460.21970.413256


Parameters (Session):
par1 = 36 ; par2 = 1 ; par3 = 0 ; par4 = 0 ; par5 = 12 ;
Parameters (R input):
par1 = 36 ; par2 = 1 ; par3 = 0 ; par4 = 0 ; par5 = 12 ;
R code (references can be found in the software module):
if (par1 == 'Default') {
par1 = 10*log10(length(x))
} else {
par1 <- as.numeric(par1)
}
par2 <- as.numeric(par2)
par3 <- as.numeric(par3)
par4 <- as.numeric(par4)
par5 <- as.numeric(par5)
if (par2 == 0) {
x <- log(x)
} else {
x <- (x ^ par2 - 1) / par2
}
if (par3 > 0) x <- diff(x,lag=1,difference=par3)
if (par4 > 0) x <- diff(x,lag=par5,difference=par4)
bitmap(file='pic1.png')
racf <- acf(x,par1,main='Autocorrelation',xlab='lags',ylab='ACF')
dev.off()
bitmap(file='pic2.png')
rpacf <- pacf(x,par1,main='Partial Autocorrelation',xlab='lags',ylab='PACF')
dev.off()
(myacf <- c(racf$acf))
(mypacf <- c(rpacf$acf))
lengthx <- length(x)
sqrtn <- sqrt(lengthx)
load(file='createtable')
a<-table.start()
a<-table.row.start(a)
a<-table.element(a,'Autocorrelation Function',4,TRUE)
a<-table.row.end(a)
a<-table.row.start(a)
a<-table.element(a,'Time lag k',header=TRUE)
a<-table.element(a,hyperlink('basics.htm','ACF(k)','click here for more information about the Autocorrelation Function'),header=TRUE)
a<-table.element(a,'T-STAT',header=TRUE)
a<-table.element(a,'P-value',header=TRUE)
a<-table.row.end(a)
for (i in 2:(par1+1)) {
a<-table.row.start(a)
a<-table.element(a,i-1,header=TRUE)
a<-table.element(a,round(myacf[i],6))
mytstat <- myacf[i]*sqrtn
a<-table.element(a,round(mytstat,4))
a<-table.element(a,round(1-pt(abs(mytstat),lengthx),6))
a<-table.row.end(a)
}
a<-table.end(a)
table.save(a,file='mytable.tab')
a<-table.start()
a<-table.row.start(a)
a<-table.element(a,'Partial Autocorrelation Function',4,TRUE)
a<-table.row.end(a)
a<-table.row.start(a)
a<-table.element(a,'Time lag k',header=TRUE)
a<-table.element(a,hyperlink('basics.htm','PACF(k)','click here for more information about the Partial Autocorrelation Function'),header=TRUE)
a<-table.element(a,'T-STAT',header=TRUE)
a<-table.element(a,'P-value',header=TRUE)
a<-table.row.end(a)
for (i in 1:par1) {
a<-table.row.start(a)
a<-table.element(a,i,header=TRUE)
a<-table.element(a,round(mypacf[i],6))
mytstat <- mypacf[i]*sqrtn
a<-table.element(a,round(mytstat,4))
a<-table.element(a,round(1-pt(abs(mytstat),lengthx),6))
a<-table.row.end(a)
}
a<-table.end(a)
table.save(a,file='mytable1.tab')