Free Statistics

of Irreproducible Research!

Author's title

Author*The author of this computation has been verified*
R Software Modulerwasp_arimabackwardselection.wasp
Title produced by softwareARIMA Backward Selection
Date of computationFri, 12 Dec 2008 07:08:26 -0700
Cite this page as followsStatistical Computations at FreeStatistics.org, Office for Research Development and Education, URL https://freestatistics.org/blog/index.php?v=date/2008/Dec/12/t1229091027vsht8qo4aj1hmrj.htm/, Retrieved Tue, 21 May 2024 07:06:36 +0000
Statistical Computations at FreeStatistics.org, Office for Research Development and Education, URL https://freestatistics.org/blog/index.php?pk=32760, Retrieved Tue, 21 May 2024 07:06:36 +0000
QR Codes:

Original text written by user:
IsPrivate?No (this computation is public)
User-defined keywords
Estimated Impact169
Family? (F = Feedback message, R = changed R code, M = changed R Module, P = changed Parameters, D = changed Data)
-       [ARIMA Backward Selection] [ARIMA Backward Se...] [2008-12-12 14:08:26] [8758b22b4a10c08c31202f233362e983] [Current]
-         [ARIMA Backward Selection] [2] [2008-12-22 16:36:22] [76963dc1903f0f612b6153510a3818cf]
Feedback Forum

Post a new message
Dataseries X:
492865
480961
461935
456608
441977
439148
488180
520564
501492
485025
464196
460170
467037
460070
447988
442867
436087
431328
484015
509673
512927
502831
470984
471067
476049
474605
470439
461251
454724
455626
516847
525192
522975
518585
509239
512238
519164
517009
509933
509127
500857
506971
569323
579714
577992
565464
547344
554788
562325
560854
555332
543599
536662
542722
593530
610763
612613
611324
594167
595454
590865
589379
584428
573100
567456
569028
620735
628884
628232
612117
595404
597141
593408
590072
579799


Summary of computational transaction
Raw Inputview raw input (R code)
Raw Outputview raw output of R engine
Computing time7 seconds
R Server'Gwilym Jenkins' @ 72.249.127.135

\begin{tabular}{lllllllll}
\hline
Summary of computational transaction \tabularnewline
Raw Input & view raw input (R code)  \tabularnewline
Raw Output & view raw output of R engine  \tabularnewline
Computing time & 7 seconds \tabularnewline
R Server & 'Gwilym Jenkins' @ 72.249.127.135 \tabularnewline
\hline
\end{tabular}
%Source: https://freestatistics.org/blog/index.php?pk=32760&T=0

[TABLE]
[ROW][C]Summary of computational transaction[/C][/ROW]
[ROW][C]Raw Input[/C][C]view raw input (R code) [/C][/ROW]
[ROW][C]Raw Output[/C][C]view raw output of R engine [/C][/ROW]
[ROW][C]Computing time[/C][C]7 seconds[/C][/ROW]
[ROW][C]R Server[/C][C]'Gwilym Jenkins' @ 72.249.127.135[/C][/ROW]
[/TABLE]
Source: https://freestatistics.org/blog/index.php?pk=32760&T=0

Globally Unique Identifier (entire table): ba.freestatistics.org/blog/index.php?pk=32760&T=0

As an alternative you can also use a QR Code:  

The GUIDs for individual cells are displayed in the table below:

Summary of computational transaction
Raw Inputview raw input (R code)
Raw Outputview raw output of R engine
Computing time7 seconds
R Server'Gwilym Jenkins' @ 72.249.127.135


ARIMA Parameter Estimation and Backward Selection
Iterationar1ar2ar3ma1sar1sar2sma1
Estimates ( 1 )-0.1953-0.0321-0.04360.207-0.1937-0.1504-0.2189
(p-val)(0.87 )(0.8296 )(0.7903 )(0.8621 )(0.8943 )(0.7896 )(0.8832 )
Estimates ( 2 )-0.1888-0.0388-0.05640.19490-0.0744-0.4131
(p-val)(0.8535 )(0.7789 )(0.6809 )(0.8481 )(NA )(0.6996 )(0.0213 )
Estimates ( 3 )0-0.041-0.04390.00840-0.0786-0.4128
(p-val)(NA )(0.7612 )(0.747 )(0.9474 )(NA )(0.6809 )(0.0222 )
Estimates ( 4 )0-0.0412-0.043100-0.0786-0.4139
(p-val)(NA )(0.7599 )(0.7504 )(NA )(NA )(0.6805 )(0.0214 )
Estimates ( 5 )00-0.042200-0.0625-0.4197
(p-val)(NA )(NA )(0.756 )(NA )(NA )(0.7343 )(0.0174 )
Estimates ( 6 )00000-0.0679-0.4357
(p-val)(NA )(NA )(NA )(NA )(NA )(0.7114 )(0.0093 )
Estimates ( 7 )000000-0.4397
(p-val)(NA )(NA )(NA )(NA )(NA )(NA )(0.0096 )
Estimates ( 8 )NANANANANANANA
(p-val)(NA )(NA )(NA )(NA )(NA )(NA )(NA )
Estimates ( 9 )NANANANANANANA
(p-val)(NA )(NA )(NA )(NA )(NA )(NA )(NA )
Estimates ( 10 )NANANANANANANA
(p-val)(NA )(NA )(NA )(NA )(NA )(NA )(NA )
Estimates ( 11 )NANANANANANANA
(p-val)(NA )(NA )(NA )(NA )(NA )(NA )(NA )
Estimates ( 12 )NANANANANANANA
(p-val)(NA )(NA )(NA )(NA )(NA )(NA )(NA )
Estimates ( 13 )NANANANANANANA
(p-val)(NA )(NA )(NA )(NA )(NA )(NA )(NA )

\begin{tabular}{lllllllll}
\hline
ARIMA Parameter Estimation and Backward Selection \tabularnewline
Iteration & ar1 & ar2 & ar3 & ma1 & sar1 & sar2 & sma1 \tabularnewline
Estimates ( 1 ) & -0.1953 & -0.0321 & -0.0436 & 0.207 & -0.1937 & -0.1504 & -0.2189 \tabularnewline
(p-val) & (0.87 ) & (0.8296 ) & (0.7903 ) & (0.8621 ) & (0.8943 ) & (0.7896 ) & (0.8832 ) \tabularnewline
Estimates ( 2 ) & -0.1888 & -0.0388 & -0.0564 & 0.1949 & 0 & -0.0744 & -0.4131 \tabularnewline
(p-val) & (0.8535 ) & (0.7789 ) & (0.6809 ) & (0.8481 ) & (NA ) & (0.6996 ) & (0.0213 ) \tabularnewline
Estimates ( 3 ) & 0 & -0.041 & -0.0439 & 0.0084 & 0 & -0.0786 & -0.4128 \tabularnewline
(p-val) & (NA ) & (0.7612 ) & (0.747 ) & (0.9474 ) & (NA ) & (0.6809 ) & (0.0222 ) \tabularnewline
Estimates ( 4 ) & 0 & -0.0412 & -0.0431 & 0 & 0 & -0.0786 & -0.4139 \tabularnewline
(p-val) & (NA ) & (0.7599 ) & (0.7504 ) & (NA ) & (NA ) & (0.6805 ) & (0.0214 ) \tabularnewline
Estimates ( 5 ) & 0 & 0 & -0.0422 & 0 & 0 & -0.0625 & -0.4197 \tabularnewline
(p-val) & (NA ) & (NA ) & (0.756 ) & (NA ) & (NA ) & (0.7343 ) & (0.0174 ) \tabularnewline
Estimates ( 6 ) & 0 & 0 & 0 & 0 & 0 & -0.0679 & -0.4357 \tabularnewline
(p-val) & (NA ) & (NA ) & (NA ) & (NA ) & (NA ) & (0.7114 ) & (0.0093 ) \tabularnewline
Estimates ( 7 ) & 0 & 0 & 0 & 0 & 0 & 0 & -0.4397 \tabularnewline
(p-val) & (NA ) & (NA ) & (NA ) & (NA ) & (NA ) & (NA ) & (0.0096 ) \tabularnewline
Estimates ( 8 ) & NA & NA & NA & NA & NA & NA & NA \tabularnewline
(p-val) & (NA ) & (NA ) & (NA ) & (NA ) & (NA ) & (NA ) & (NA ) \tabularnewline
Estimates ( 9 ) & NA & NA & NA & NA & NA & NA & NA \tabularnewline
(p-val) & (NA ) & (NA ) & (NA ) & (NA ) & (NA ) & (NA ) & (NA ) \tabularnewline
Estimates ( 10 ) & NA & NA & NA & NA & NA & NA & NA \tabularnewline
(p-val) & (NA ) & (NA ) & (NA ) & (NA ) & (NA ) & (NA ) & (NA ) \tabularnewline
Estimates ( 11 ) & NA & NA & NA & NA & NA & NA & NA \tabularnewline
(p-val) & (NA ) & (NA ) & (NA ) & (NA ) & (NA ) & (NA ) & (NA ) \tabularnewline
Estimates ( 12 ) & NA & NA & NA & NA & NA & NA & NA \tabularnewline
(p-val) & (NA ) & (NA ) & (NA ) & (NA ) & (NA ) & (NA ) & (NA ) \tabularnewline
Estimates ( 13 ) & NA & NA & NA & NA & NA & NA & NA \tabularnewline
(p-val) & (NA ) & (NA ) & (NA ) & (NA ) & (NA ) & (NA ) & (NA ) \tabularnewline
\hline
\end{tabular}
%Source: https://freestatistics.org/blog/index.php?pk=32760&T=1

[TABLE]
[ROW][C]ARIMA Parameter Estimation and Backward Selection[/C][/ROW]
[ROW][C]Iteration[/C][C]ar1[/C][C]ar2[/C][C]ar3[/C][C]ma1[/C][C]sar1[/C][C]sar2[/C][C]sma1[/C][/ROW]
[ROW][C]Estimates ( 1 )[/C][C]-0.1953[/C][C]-0.0321[/C][C]-0.0436[/C][C]0.207[/C][C]-0.1937[/C][C]-0.1504[/C][C]-0.2189[/C][/ROW]
[ROW][C](p-val)[/C][C](0.87 )[/C][C](0.8296 )[/C][C](0.7903 )[/C][C](0.8621 )[/C][C](0.8943 )[/C][C](0.7896 )[/C][C](0.8832 )[/C][/ROW]
[ROW][C]Estimates ( 2 )[/C][C]-0.1888[/C][C]-0.0388[/C][C]-0.0564[/C][C]0.1949[/C][C]0[/C][C]-0.0744[/C][C]-0.4131[/C][/ROW]
[ROW][C](p-val)[/C][C](0.8535 )[/C][C](0.7789 )[/C][C](0.6809 )[/C][C](0.8481 )[/C][C](NA )[/C][C](0.6996 )[/C][C](0.0213 )[/C][/ROW]
[ROW][C]Estimates ( 3 )[/C][C]0[/C][C]-0.041[/C][C]-0.0439[/C][C]0.0084[/C][C]0[/C][C]-0.0786[/C][C]-0.4128[/C][/ROW]
[ROW][C](p-val)[/C][C](NA )[/C][C](0.7612 )[/C][C](0.747 )[/C][C](0.9474 )[/C][C](NA )[/C][C](0.6809 )[/C][C](0.0222 )[/C][/ROW]
[ROW][C]Estimates ( 4 )[/C][C]0[/C][C]-0.0412[/C][C]-0.0431[/C][C]0[/C][C]0[/C][C]-0.0786[/C][C]-0.4139[/C][/ROW]
[ROW][C](p-val)[/C][C](NA )[/C][C](0.7599 )[/C][C](0.7504 )[/C][C](NA )[/C][C](NA )[/C][C](0.6805 )[/C][C](0.0214 )[/C][/ROW]
[ROW][C]Estimates ( 5 )[/C][C]0[/C][C]0[/C][C]-0.0422[/C][C]0[/C][C]0[/C][C]-0.0625[/C][C]-0.4197[/C][/ROW]
[ROW][C](p-val)[/C][C](NA )[/C][C](NA )[/C][C](0.756 )[/C][C](NA )[/C][C](NA )[/C][C](0.7343 )[/C][C](0.0174 )[/C][/ROW]
[ROW][C]Estimates ( 6 )[/C][C]0[/C][C]0[/C][C]0[/C][C]0[/C][C]0[/C][C]-0.0679[/C][C]-0.4357[/C][/ROW]
[ROW][C](p-val)[/C][C](NA )[/C][C](NA )[/C][C](NA )[/C][C](NA )[/C][C](NA )[/C][C](0.7114 )[/C][C](0.0093 )[/C][/ROW]
[ROW][C]Estimates ( 7 )[/C][C]0[/C][C]0[/C][C]0[/C][C]0[/C][C]0[/C][C]0[/C][C]-0.4397[/C][/ROW]
[ROW][C](p-val)[/C][C](NA )[/C][C](NA )[/C][C](NA )[/C][C](NA )[/C][C](NA )[/C][C](NA )[/C][C](0.0096 )[/C][/ROW]
[ROW][C]Estimates ( 8 )[/C][C]NA[/C][C]NA[/C][C]NA[/C][C]NA[/C][C]NA[/C][C]NA[/C][C]NA[/C][/ROW]
[ROW][C](p-val)[/C][C](NA )[/C][C](NA )[/C][C](NA )[/C][C](NA )[/C][C](NA )[/C][C](NA )[/C][C](NA )[/C][/ROW]
[ROW][C]Estimates ( 9 )[/C][C]NA[/C][C]NA[/C][C]NA[/C][C]NA[/C][C]NA[/C][C]NA[/C][C]NA[/C][/ROW]
[ROW][C](p-val)[/C][C](NA )[/C][C](NA )[/C][C](NA )[/C][C](NA )[/C][C](NA )[/C][C](NA )[/C][C](NA )[/C][/ROW]
[ROW][C]Estimates ( 10 )[/C][C]NA[/C][C]NA[/C][C]NA[/C][C]NA[/C][C]NA[/C][C]NA[/C][C]NA[/C][/ROW]
[ROW][C](p-val)[/C][C](NA )[/C][C](NA )[/C][C](NA )[/C][C](NA )[/C][C](NA )[/C][C](NA )[/C][C](NA )[/C][/ROW]
[ROW][C]Estimates ( 11 )[/C][C]NA[/C][C]NA[/C][C]NA[/C][C]NA[/C][C]NA[/C][C]NA[/C][C]NA[/C][/ROW]
[ROW][C](p-val)[/C][C](NA )[/C][C](NA )[/C][C](NA )[/C][C](NA )[/C][C](NA )[/C][C](NA )[/C][C](NA )[/C][/ROW]
[ROW][C]Estimates ( 12 )[/C][C]NA[/C][C]NA[/C][C]NA[/C][C]NA[/C][C]NA[/C][C]NA[/C][C]NA[/C][/ROW]
[ROW][C](p-val)[/C][C](NA )[/C][C](NA )[/C][C](NA )[/C][C](NA )[/C][C](NA )[/C][C](NA )[/C][C](NA )[/C][/ROW]
[ROW][C]Estimates ( 13 )[/C][C]NA[/C][C]NA[/C][C]NA[/C][C]NA[/C][C]NA[/C][C]NA[/C][C]NA[/C][/ROW]
[ROW][C](p-val)[/C][C](NA )[/C][C](NA )[/C][C](NA )[/C][C](NA )[/C][C](NA )[/C][C](NA )[/C][C](NA )[/C][/ROW]
[/TABLE]
Source: https://freestatistics.org/blog/index.php?pk=32760&T=1

Globally Unique Identifier (entire table): ba.freestatistics.org/blog/index.php?pk=32760&T=1

As an alternative you can also use a QR Code:  

The GUIDs for individual cells are displayed in the table below:

ARIMA Parameter Estimation and Backward Selection
Iterationar1ar2ar3ma1sar1sar2sma1
Estimates ( 1 )-0.1953-0.0321-0.04360.207-0.1937-0.1504-0.2189
(p-val)(0.87 )(0.8296 )(0.7903 )(0.8621 )(0.8943 )(0.7896 )(0.8832 )
Estimates ( 2 )-0.1888-0.0388-0.05640.19490-0.0744-0.4131
(p-val)(0.8535 )(0.7789 )(0.6809 )(0.8481 )(NA )(0.6996 )(0.0213 )
Estimates ( 3 )0-0.041-0.04390.00840-0.0786-0.4128
(p-val)(NA )(0.7612 )(0.747 )(0.9474 )(NA )(0.6809 )(0.0222 )
Estimates ( 4 )0-0.0412-0.043100-0.0786-0.4139
(p-val)(NA )(0.7599 )(0.7504 )(NA )(NA )(0.6805 )(0.0214 )
Estimates ( 5 )00-0.042200-0.0625-0.4197
(p-val)(NA )(NA )(0.756 )(NA )(NA )(0.7343 )(0.0174 )
Estimates ( 6 )00000-0.0679-0.4357
(p-val)(NA )(NA )(NA )(NA )(NA )(0.7114 )(0.0093 )
Estimates ( 7 )000000-0.4397
(p-val)(NA )(NA )(NA )(NA )(NA )(NA )(0.0096 )
Estimates ( 8 )NANANANANANANA
(p-val)(NA )(NA )(NA )(NA )(NA )(NA )(NA )
Estimates ( 9 )NANANANANANANA
(p-val)(NA )(NA )(NA )(NA )(NA )(NA )(NA )
Estimates ( 10 )NANANANANANANA
(p-val)(NA )(NA )(NA )(NA )(NA )(NA )(NA )
Estimates ( 11 )NANANANANANANA
(p-val)(NA )(NA )(NA )(NA )(NA )(NA )(NA )
Estimates ( 12 )NANANANANANANA
(p-val)(NA )(NA )(NA )(NA )(NA )(NA )(NA )
Estimates ( 13 )NANANANANANANA
(p-val)(NA )(NA )(NA )(NA )(NA )(NA )(NA )


Estimated ARIMA Residuals
Value
-1756.60603431623
4515.24257981331
6350.75775164574
187.666266373852
7179.98712875071
-1766.37610234956
3341.77086395576
-6153.40309989072
20418.8106311631
5825.39192932496
-10079.6490689338
3756.07220069734
-1726.74276705756
7013.7344249082
10008.7549074184
-3889.52080761589
2853.07205634534
4867.00019774531
9517.40335747617
-19081.5299021034
2090.0603310961
7667.21034461655
18234.8767747905
4200.8805378441
1264.16225643596
2584.89959610864
1795.96414444323
6713.2586759758
-0.068849116567279
7108.52860528245
5387.15861928528
-6468.09529935968
2883.30701409132
-4432.34594190418
-1782.78067623104
6472.57767594632
1013.79338972172
2177.70411877888
2867.61234643884
-8285.22375024405
1348.88046158327
3408.92192179288
-8620.73016455793
2859.19760246751
4446.04269699712
9696.01667172343
1717.13129387004
-3150.03448087691
-11543.5208311122
884.431635223911
1621.20821218846
-2631.41869478376
1761.40254824356
-2649.64322339627
-2776.02346244686
-7699.09734862941
-533.042227208214
-11156.4531531466
595.25187852622
-619.038755038201
-4126.31396334412
-1418.22133143939
-4510.06912073083

\begin{tabular}{lllllllll}
\hline
Estimated ARIMA Residuals \tabularnewline
Value \tabularnewline
-1756.60603431623 \tabularnewline
4515.24257981331 \tabularnewline
6350.75775164574 \tabularnewline
187.666266373852 \tabularnewline
7179.98712875071 \tabularnewline
-1766.37610234956 \tabularnewline
3341.77086395576 \tabularnewline
-6153.40309989072 \tabularnewline
20418.8106311631 \tabularnewline
5825.39192932496 \tabularnewline
-10079.6490689338 \tabularnewline
3756.07220069734 \tabularnewline
-1726.74276705756 \tabularnewline
7013.7344249082 \tabularnewline
10008.7549074184 \tabularnewline
-3889.52080761589 \tabularnewline
2853.07205634534 \tabularnewline
4867.00019774531 \tabularnewline
9517.40335747617 \tabularnewline
-19081.5299021034 \tabularnewline
2090.0603310961 \tabularnewline
7667.21034461655 \tabularnewline
18234.8767747905 \tabularnewline
4200.8805378441 \tabularnewline
1264.16225643596 \tabularnewline
2584.89959610864 \tabularnewline
1795.96414444323 \tabularnewline
6713.2586759758 \tabularnewline
-0.068849116567279 \tabularnewline
7108.52860528245 \tabularnewline
5387.15861928528 \tabularnewline
-6468.09529935968 \tabularnewline
2883.30701409132 \tabularnewline
-4432.34594190418 \tabularnewline
-1782.78067623104 \tabularnewline
6472.57767594632 \tabularnewline
1013.79338972172 \tabularnewline
2177.70411877888 \tabularnewline
2867.61234643884 \tabularnewline
-8285.22375024405 \tabularnewline
1348.88046158327 \tabularnewline
3408.92192179288 \tabularnewline
-8620.73016455793 \tabularnewline
2859.19760246751 \tabularnewline
4446.04269699712 \tabularnewline
9696.01667172343 \tabularnewline
1717.13129387004 \tabularnewline
-3150.03448087691 \tabularnewline
-11543.5208311122 \tabularnewline
884.431635223911 \tabularnewline
1621.20821218846 \tabularnewline
-2631.41869478376 \tabularnewline
1761.40254824356 \tabularnewline
-2649.64322339627 \tabularnewline
-2776.02346244686 \tabularnewline
-7699.09734862941 \tabularnewline
-533.042227208214 \tabularnewline
-11156.4531531466 \tabularnewline
595.25187852622 \tabularnewline
-619.038755038201 \tabularnewline
-4126.31396334412 \tabularnewline
-1418.22133143939 \tabularnewline
-4510.06912073083 \tabularnewline
\hline
\end{tabular}
%Source: https://freestatistics.org/blog/index.php?pk=32760&T=2

[TABLE]
[ROW][C]Estimated ARIMA Residuals[/C][/ROW]
[ROW][C]Value[/C][/ROW]
[ROW][C]-1756.60603431623[/C][/ROW]
[ROW][C]4515.24257981331[/C][/ROW]
[ROW][C]6350.75775164574[/C][/ROW]
[ROW][C]187.666266373852[/C][/ROW]
[ROW][C]7179.98712875071[/C][/ROW]
[ROW][C]-1766.37610234956[/C][/ROW]
[ROW][C]3341.77086395576[/C][/ROW]
[ROW][C]-6153.40309989072[/C][/ROW]
[ROW][C]20418.8106311631[/C][/ROW]
[ROW][C]5825.39192932496[/C][/ROW]
[ROW][C]-10079.6490689338[/C][/ROW]
[ROW][C]3756.07220069734[/C][/ROW]
[ROW][C]-1726.74276705756[/C][/ROW]
[ROW][C]7013.7344249082[/C][/ROW]
[ROW][C]10008.7549074184[/C][/ROW]
[ROW][C]-3889.52080761589[/C][/ROW]
[ROW][C]2853.07205634534[/C][/ROW]
[ROW][C]4867.00019774531[/C][/ROW]
[ROW][C]9517.40335747617[/C][/ROW]
[ROW][C]-19081.5299021034[/C][/ROW]
[ROW][C]2090.0603310961[/C][/ROW]
[ROW][C]7667.21034461655[/C][/ROW]
[ROW][C]18234.8767747905[/C][/ROW]
[ROW][C]4200.8805378441[/C][/ROW]
[ROW][C]1264.16225643596[/C][/ROW]
[ROW][C]2584.89959610864[/C][/ROW]
[ROW][C]1795.96414444323[/C][/ROW]
[ROW][C]6713.2586759758[/C][/ROW]
[ROW][C]-0.068849116567279[/C][/ROW]
[ROW][C]7108.52860528245[/C][/ROW]
[ROW][C]5387.15861928528[/C][/ROW]
[ROW][C]-6468.09529935968[/C][/ROW]
[ROW][C]2883.30701409132[/C][/ROW]
[ROW][C]-4432.34594190418[/C][/ROW]
[ROW][C]-1782.78067623104[/C][/ROW]
[ROW][C]6472.57767594632[/C][/ROW]
[ROW][C]1013.79338972172[/C][/ROW]
[ROW][C]2177.70411877888[/C][/ROW]
[ROW][C]2867.61234643884[/C][/ROW]
[ROW][C]-8285.22375024405[/C][/ROW]
[ROW][C]1348.88046158327[/C][/ROW]
[ROW][C]3408.92192179288[/C][/ROW]
[ROW][C]-8620.73016455793[/C][/ROW]
[ROW][C]2859.19760246751[/C][/ROW]
[ROW][C]4446.04269699712[/C][/ROW]
[ROW][C]9696.01667172343[/C][/ROW]
[ROW][C]1717.13129387004[/C][/ROW]
[ROW][C]-3150.03448087691[/C][/ROW]
[ROW][C]-11543.5208311122[/C][/ROW]
[ROW][C]884.431635223911[/C][/ROW]
[ROW][C]1621.20821218846[/C][/ROW]
[ROW][C]-2631.41869478376[/C][/ROW]
[ROW][C]1761.40254824356[/C][/ROW]
[ROW][C]-2649.64322339627[/C][/ROW]
[ROW][C]-2776.02346244686[/C][/ROW]
[ROW][C]-7699.09734862941[/C][/ROW]
[ROW][C]-533.042227208214[/C][/ROW]
[ROW][C]-11156.4531531466[/C][/ROW]
[ROW][C]595.25187852622[/C][/ROW]
[ROW][C]-619.038755038201[/C][/ROW]
[ROW][C]-4126.31396334412[/C][/ROW]
[ROW][C]-1418.22133143939[/C][/ROW]
[ROW][C]-4510.06912073083[/C][/ROW]
[/TABLE]
Source: https://freestatistics.org/blog/index.php?pk=32760&T=2

Globally Unique Identifier (entire table): ba.freestatistics.org/blog/index.php?pk=32760&T=2

As an alternative you can also use a QR Code:  

The GUIDs for individual cells are displayed in the table below:

Estimated ARIMA Residuals
Value
-1756.60603431623
4515.24257981331
6350.75775164574
187.666266373852
7179.98712875071
-1766.37610234956
3341.77086395576
-6153.40309989072
20418.8106311631
5825.39192932496
-10079.6490689338
3756.07220069734
-1726.74276705756
7013.7344249082
10008.7549074184
-3889.52080761589
2853.07205634534
4867.00019774531
9517.40335747617
-19081.5299021034
2090.0603310961
7667.21034461655
18234.8767747905
4200.8805378441
1264.16225643596
2584.89959610864
1795.96414444323
6713.2586759758
-0.068849116567279
7108.52860528245
5387.15861928528
-6468.09529935968
2883.30701409132
-4432.34594190418
-1782.78067623104
6472.57767594632
1013.79338972172
2177.70411877888
2867.61234643884
-8285.22375024405
1348.88046158327
3408.92192179288
-8620.73016455793
2859.19760246751
4446.04269699712
9696.01667172343
1717.13129387004
-3150.03448087691
-11543.5208311122
884.431635223911
1621.20821218846
-2631.41869478376
1761.40254824356
-2649.64322339627
-2776.02346244686
-7699.09734862941
-533.042227208214
-11156.4531531466
595.25187852622
-619.038755038201
-4126.31396334412
-1418.22133143939
-4510.06912073083


Parameters (Session):
par1 = FALSE ; par2 = 1 ; par3 = 1 ; par4 = 1 ; par5 = 12 ; par6 = 3 ; par7 = 1 ; par8 = 2 ; par9 = 1 ;
Parameters (R input):
par1 = FALSE ; par2 = 1 ; par3 = 1 ; par4 = 1 ; par5 = 12 ; par6 = 3 ; par7 = 1 ; par8 = 2 ; par9 = 1 ;
R code (references can be found in the software module):
library(lattice)
if (par1 == 'TRUE') par1 <- TRUE
if (par1 == 'FALSE') par1 <- FALSE
par2 <- as.numeric(par2) #Box-Cox lambda transformation parameter
par3 <- as.numeric(par3) #degree of non-seasonal differencing
par4 <- as.numeric(par4) #degree of seasonal differencing
par5 <- as.numeric(par5) #seasonal period
par6 <- as.numeric(par6) #degree (p) of the non-seasonal AR(p) polynomial
par7 <- as.numeric(par7) #degree (q) of the non-seasonal MA(q) polynomial
par8 <- as.numeric(par8) #degree (P) of the seasonal AR(P) polynomial
par9 <- as.numeric(par9) #degree (Q) of the seasonal MA(Q) polynomial
armaGR <- function(arima.out, names, n){
try1 <- arima.out$coef
try2 <- sqrt(diag(arima.out$var.coef))
try.data.frame <- data.frame(matrix(NA,ncol=4,nrow=length(names)))
dimnames(try.data.frame) <- list(names,c('coef','std','tstat','pv'))
try.data.frame[,1] <- try1
for(i in 1:length(try2)) try.data.frame[which(rownames(try.data.frame)==names(try2)[i]),2] <- try2[i]
try.data.frame[,3] <- try.data.frame[,1] / try.data.frame[,2]
try.data.frame[,4] <- round((1-pt(abs(try.data.frame[,3]),df=n-(length(try2)+1)))*2,5)
vector <- rep(NA,length(names))
vector[is.na(try.data.frame[,4])] <- 0
maxi <- which.max(try.data.frame[,4])
continue <- max(try.data.frame[,4],na.rm=TRUE) > .05
vector[maxi] <- 0
list(summary=try.data.frame,next.vector=vector,continue=continue)
}
arimaSelect <- function(series, order=c(13,0,0), seasonal=list(order=c(2,0,0),period=12), include.mean=F){
nrc <- order[1]+order[3]+seasonal$order[1]+seasonal$order[3]
coeff <- matrix(NA, nrow=nrc*2, ncol=nrc)
pval <- matrix(NA, nrow=nrc*2, ncol=nrc)
mylist <- rep(list(NULL), nrc)
names <- NULL
if(order[1] > 0) names <- paste('ar',1:order[1],sep='')
if(order[3] > 0) names <- c( names , paste('ma',1:order[3],sep='') )
if(seasonal$order[1] > 0) names <- c(names, paste('sar',1:seasonal$order[1],sep=''))
if(seasonal$order[3] > 0) names <- c(names, paste('sma',1:seasonal$order[3],sep=''))
arima.out <- arima(series, order=order, seasonal=seasonal, include.mean=include.mean, method='ML')
mylist[[1]] <- arima.out
last.arma <- armaGR(arima.out, names, length(series))
mystop <- FALSE
i <- 1
coeff[i,] <- last.arma[[1]][,1]
pval [i,] <- last.arma[[1]][,4]
i <- 2
aic <- arima.out$aic
while(!mystop){
mylist[[i]] <- arima.out
arima.out <- arima(series, order=order, seasonal=seasonal, include.mean=include.mean, method='ML', fixed=last.arma$next.vector)
aic <- c(aic, arima.out$aic)
last.arma <- armaGR(arima.out, names, length(series))
mystop <- !last.arma$continue
coeff[i,] <- last.arma[[1]][,1]
pval [i,] <- last.arma[[1]][,4]
i <- i+1
}
list(coeff, pval, mylist, aic=aic)
}
arimaSelectplot <- function(arimaSelect.out,noms,choix){
noms <- names(arimaSelect.out[[3]][[1]]$coef)
coeff <- arimaSelect.out[[1]]
k <- min(which(is.na(coeff[,1])))-1
coeff <- coeff[1:k,]
pval <- arimaSelect.out[[2]][1:k,]
aic <- arimaSelect.out$aic[1:k]
coeff[coeff==0] <- NA
n <- ncol(coeff)
if(missing(choix)) choix <- k
layout(matrix(c(1,1,1,2,
3,3,3,2,
3,3,3,4,
5,6,7,7),nr=4),
widths=c(10,35,45,15),
heights=c(30,30,15,15))
couleurs <- rainbow(75)[1:50]#(50)
ticks <- pretty(coeff)
par(mar=c(1,1,3,1))
plot(aic,k:1-.5,type='o',pch=21,bg='blue',cex=2,axes=F,lty=2,xpd=NA)
points(aic[choix],k-choix+.5,pch=21,cex=4,bg=2,xpd=NA)
title('aic',line=2)
par(mar=c(3,0,0,0))
plot(0,axes=F,xlab='',ylab='',xlim=range(ticks),ylim=c(.1,1))
rect(xleft = min(ticks) + (0:49)/50*(max(ticks)-min(ticks)),
xright = min(ticks) + (1:50)/50*(max(ticks)-min(ticks)),
ytop = rep(1,50),
ybottom= rep(0,50),col=couleurs,border=NA)
axis(1,ticks)
rect(xleft=min(ticks),xright=max(ticks),ytop=1,ybottom=0)
text(mean(coeff,na.rm=T),.5,'coefficients',cex=2,font=2)
par(mar=c(1,1,3,1))
image(1:n,1:k,t(coeff[k:1,]),axes=F,col=couleurs,zlim=range(ticks))
for(i in 1:n) for(j in 1:k) if(!is.na(coeff[j,i])) {
if(pval[j,i]<.01) symb = 'green'
else if( (pval[j,i]<.05) & (pval[j,i]>=.01)) symb = 'orange'
else if( (pval[j,i]<.1) & (pval[j,i]>=.05)) symb = 'red'
else symb = 'black'
polygon(c(i+.5 ,i+.2 ,i+.5 ,i+.5),
c(k-j+0.5,k-j+0.5,k-j+0.8,k-j+0.5),
col=symb)
if(j==choix) {
rect(xleft=i-.5,
xright=i+.5,
ybottom=k-j+1.5,
ytop=k-j+.5,
lwd=4)
text(i,
k-j+1,
round(coeff[j,i],2),
cex=1.2,
font=2)
}
else{
rect(xleft=i-.5,xright=i+.5,ybottom=k-j+1.5,ytop=k-j+.5)
text(i,k-j+1,round(coeff[j,i],2),cex=1.2,font=1)
}
}
axis(3,1:n,noms)
par(mar=c(0.5,0,0,0.5))
plot(0,axes=F,xlab='',ylab='',type='n',xlim=c(0,8),ylim=c(-.2,.8))
cols <- c('green','orange','red','black')
niv <- c('0','0.01','0.05','0.1')
for(i in 0:3){
polygon(c(1+2*i ,1+2*i ,1+2*i-.5 ,1+2*i),
c(.4 ,.7 , .4 , .4),
col=cols[i+1])
text(2*i,0.5,niv[i+1],cex=1.5)
}
text(8,.5,1,cex=1.5)
text(4,0,'p-value',cex=2)
box()
residus <- arimaSelect.out[[3]][[choix]]$res
par(mar=c(1,2,4,1))
acf(residus,main='')
title('acf',line=.5)
par(mar=c(1,2,4,1))
pacf(residus,main='')
title('pacf',line=.5)
par(mar=c(2,2,4,1))
qqnorm(residus,main='')
title('qq-norm',line=.5)
qqline(residus)
residus
}
if (par2 == 0) x <- log(x)
if (par2 != 0) x <- x^par2
(selection <- arimaSelect(x, order=c(par6,par3,par7), seasonal=list(order=c(par8,par4,par9), period=par5)))
bitmap(file='test1.png')
resid <- arimaSelectplot(selection)
dev.off()
resid
bitmap(file='test2.png')
acf(resid,length(resid)/2, main='Residual Autocorrelation Function')
dev.off()
bitmap(file='test3.png')
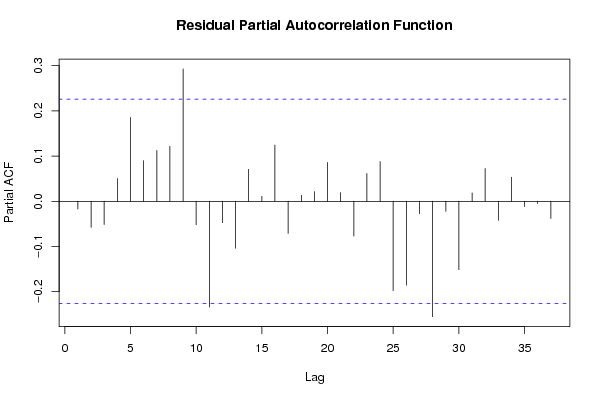
pacf(resid,length(resid)/2, main='Residual Partial Autocorrelation Function')
dev.off()
bitmap(file='test4.png')
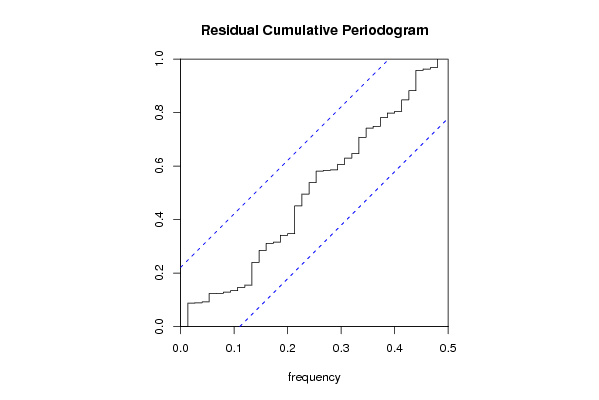
cpgram(resid, main='Residual Cumulative Periodogram')
dev.off()
bitmap(file='test5.png')
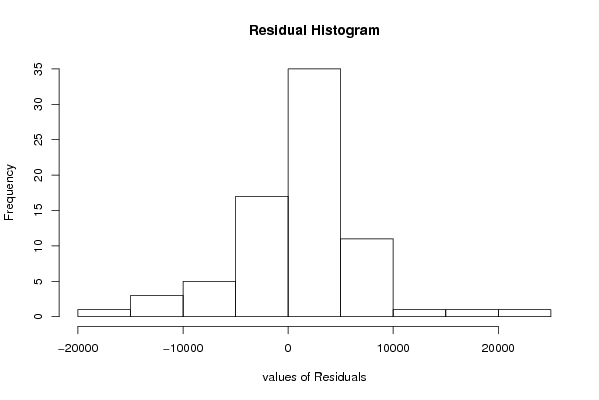
hist(resid, main='Residual Histogram', xlab='values of Residuals')
dev.off()
bitmap(file='test6.png')
densityplot(~resid,col='black',main='Residual Density Plot', xlab='values of Residuals')
dev.off()
bitmap(file='test7.png')
qqnorm(resid, main='Residual Normal Q-Q Plot')
qqline(resid)
dev.off()
ncols <- length(selection[[1]][1,])
nrows <- length(selection[[2]][,1])-1
load(file='createtable')
a<-table.start()
a<-table.row.start(a)
a<-table.element(a,'ARIMA Parameter Estimation and Backward Selection', ncols+1,TRUE)
a<-table.row.end(a)
a<-table.row.start(a)
a<-table.element(a,'Iteration', header=TRUE)
for (i in 1:ncols) {
a<-table.element(a,names(selection[[3]][[1]]$coef)[i],header=TRUE)
}
a<-table.row.end(a)
for (j in 1:nrows) {
a<-table.row.start(a)
mydum <- 'Estimates ('
mydum <- paste(mydum,j)
mydum <- paste(mydum,')')
a<-table.element(a,mydum, header=TRUE)
for (i in 1:ncols) {
a<-table.element(a,round(selection[[1]][j,i],4))
}
a<-table.row.end(a)
a<-table.row.start(a)
a<-table.element(a,'(p-val)', header=TRUE)
for (i in 1:ncols) {
mydum <- '('
mydum <- paste(mydum,round(selection[[2]][j,i],4),sep='')
mydum <- paste(mydum,')')
a<-table.element(a,mydum)
}
a<-table.row.end(a)
}
a<-table.end(a)
table.save(a,file='mytable.tab')
a<-table.start()
a<-table.row.start(a)
a<-table.element(a,'Estimated ARIMA Residuals', 1,TRUE)
a<-table.row.end(a)
a<-table.row.start(a)
a<-table.element(a,'Value', 1,TRUE)
a<-table.row.end(a)
for (i in (par4*par5+par3):length(resid)) {
a<-table.row.start(a)
a<-table.element(a,resid[i])
a<-table.row.end(a)
}
a<-table.end(a)
table.save(a,file='mytable1.tab')