Free Statistics

of Irreproducible Research!

Author's title

Author*Unverified author*
R Software Modulerwasp_correlation.wasp
Title produced by softwarePearson Correlation
Date of computationFri, 12 Dec 2008 06:23:51 -0700
Cite this page as followsStatistical Computations at FreeStatistics.org, Office for Research Development and Education, URL https://freestatistics.org/blog/index.php?v=date/2008/Dec/12/t1229088380pjxs58jo3zbkpt4.htm/, Retrieved Fri, 17 May 2024 00:35:38 +0000
Statistical Computations at FreeStatistics.org, Office for Research Development and Education, URL https://freestatistics.org/blog/index.php?pk=32698, Retrieved Fri, 17 May 2024 00:35:38 +0000
QR Codes:

Original text written by user:
IsPrivate?No (this computation is public)
User-defined keywords
Estimated Impact207
Family? (F = Feedback message, R = changed R code, M = changed R Module, P = changed Parameters, D = changed Data)
-     [(Partial) Autocorrelation Function] [(P)ACF Transportm...] [2008-12-04 18:19:15] [65eec331235880e0070acfba94c20cfa]
- RMPD  [Cross Correlation Function] [Cross Correlation...] [2008-12-09 17:38:05] [74be16979710d4c4e7c6647856088456]
- RMP       [Pearson Correlation] [Pearson Correlation] [2008-12-12 13:23:51] [d41d8cd98f00b204e9800998ecf8427e] [Current]
Feedback Forum

Post a new message
Dataseries X:
100.8
105.3
116.1
112.8
114.5
117.2
77.1
80.1
120.3
133.4
109.4
93.2
91.2
99.2
108.2
101.5
106.9
104.4
77.9
60
99.5
95
105.6
102.5
93.3
97.3
127
111.7
96.4
133
72.2
95.8
124.1
127.6
110.7
104.6
112.7
115.3
139.4
119
97.4
154
81.5
88.8
127.7
105.1
114.9
106.4
104.5
121.6
141.4
99
126.7
134.1
81.3
88.6
132.7
132.9
134.4
103.7
119.7
115
132.9
108.5
113.9
142
97.7
92.2
128.8
134.9
128.2
114.8
117.9
Dataseries Y:
92
95.9
108.8
103.4
102.1
110.1
83.2
82.7
106.8
113.7
102.5
96.6
92.1
95.6
102.3
98.6
98.2
104.5
84
73.8
103.9
106
97.2
102.6
89
93.8
116.7
106.8
98.5
118.7
90
91.9
113.3
113.1
104.1
108.7
96.7
101
116.9
105.8
99
129.4
83
88.9
115.9
104.2
113.4
112.2
100.8
107.3
126.6
102.9
117.9
128.8
87.5
93.8
122.7
126.2
124.6
116.7
115.2
111.1
129.9
113.3
118.5
137.9
103.6
101.7
127.4
137.5
128.3
118.2
117.1


Summary of computational transaction
Raw Inputview raw input (R code)
Raw Outputview raw output of R engine
Computing time2 seconds
R Server'Sir Ronald Aylmer Fisher' @ 193.190.124.24

\begin{tabular}{lllllllll}
\hline
Summary of computational transaction \tabularnewline
Raw Input & view raw input (R code)  \tabularnewline
Raw Output & view raw output of R engine  \tabularnewline
Computing time & 2 seconds \tabularnewline
R Server & 'Sir Ronald Aylmer Fisher' @ 193.190.124.24 \tabularnewline
\hline
\end{tabular}
%Source: https://freestatistics.org/blog/index.php?pk=32698&T=0

[TABLE]
[ROW][C]Summary of computational transaction[/C][/ROW]
[ROW][C]Raw Input[/C][C]view raw input (R code) [/C][/ROW]
[ROW][C]Raw Output[/C][C]view raw output of R engine [/C][/ROW]
[ROW][C]Computing time[/C][C]2 seconds[/C][/ROW]
[ROW][C]R Server[/C][C]'Sir Ronald Aylmer Fisher' @ 193.190.124.24[/C][/ROW]
[/TABLE]
Source: https://freestatistics.org/blog/index.php?pk=32698&T=0

Globally Unique Identifier (entire table): ba.freestatistics.org/blog/index.php?pk=32698&T=0

As an alternative you can also use a QR Code:  

The GUIDs for individual cells are displayed in the table below:

Summary of computational transaction
Raw Inputview raw input (R code)
Raw Outputview raw output of R engine
Computing time2 seconds
R Server'Sir Ronald Aylmer Fisher' @ 193.190.124.24


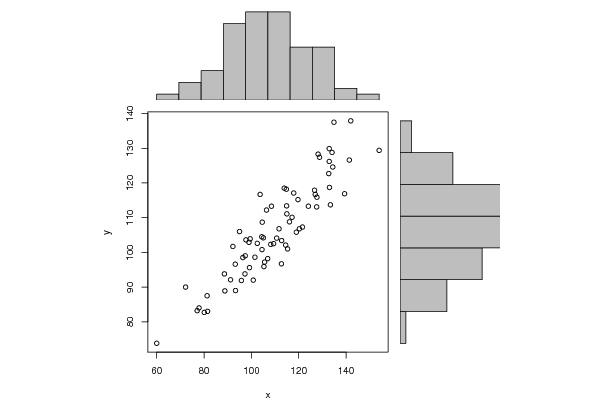
Pearson Product Moment Correlation - Ungrouped Data
StatisticVariable XVariable Y
Mean110.073972602740106.617808219178
Biased Variance337.277267780071187.469956839932
Biased Standard Deviation18.365110067191813.6919668725838
Covariance230.009636605784
Correlation0.902186435026792
Determination0.813940363546352
T-Test17.6237930027955
p-value (2 sided)0
p-value (1 sided)0
Degrees of Freedom71
Number of Observations73

\begin{tabular}{lllllllll}
\hline
Pearson Product Moment Correlation - Ungrouped Data \tabularnewline
Statistic & Variable X & Variable Y \tabularnewline
Mean & 110.073972602740 & 106.617808219178 \tabularnewline
Biased Variance & 337.277267780071 & 187.469956839932 \tabularnewline
Biased Standard Deviation & 18.3651100671918 & 13.6919668725838 \tabularnewline
Covariance & 230.009636605784 \tabularnewline
Correlation & 0.902186435026792 \tabularnewline
Determination & 0.813940363546352 \tabularnewline
T-Test & 17.6237930027955 \tabularnewline
p-value (2 sided) & 0 \tabularnewline
p-value (1 sided) & 0 \tabularnewline
Degrees of Freedom & 71 \tabularnewline
Number of Observations & 73 \tabularnewline
\hline
\end{tabular}
%Source: https://freestatistics.org/blog/index.php?pk=32698&T=1

[TABLE]
[ROW][C]Pearson Product Moment Correlation - Ungrouped Data[/C][/ROW]
[ROW][C]Statistic[/C][C]Variable X[/C][C]Variable Y[/C][/ROW]
[ROW][C]Mean[/C][C]110.073972602740[/C][C]106.617808219178[/C][/ROW]
[ROW][C]Biased Variance[/C][C]337.277267780071[/C][C]187.469956839932[/C][/ROW]
[ROW][C]Biased Standard Deviation[/C][C]18.3651100671918[/C][C]13.6919668725838[/C][/ROW]
[ROW][C]Covariance[/C][C]230.009636605784[/C][/ROW]
[ROW][C]Correlation[/C][C]0.902186435026792[/C][/ROW]
[ROW][C]Determination[/C][C]0.813940363546352[/C][/ROW]
[ROW][C]T-Test[/C][C]17.6237930027955[/C][/ROW]
[ROW][C]p-value (2 sided)[/C][C]0[/C][/ROW]
[ROW][C]p-value (1 sided)[/C][C]0[/C][/ROW]
[ROW][C]Degrees of Freedom[/C][C]71[/C][/ROW]
[ROW][C]Number of Observations[/C][C]73[/C][/ROW]
[/TABLE]
Source: https://freestatistics.org/blog/index.php?pk=32698&T=1

Globally Unique Identifier (entire table): ba.freestatistics.org/blog/index.php?pk=32698&T=1

As an alternative you can also use a QR Code:  

The GUIDs for individual cells are displayed in the table below:

Pearson Product Moment Correlation - Ungrouped Data
StatisticVariable XVariable Y
Mean110.073972602740106.617808219178
Biased Variance337.277267780071187.469956839932
Biased Standard Deviation18.365110067191813.6919668725838
Covariance230.009636605784
Correlation0.902186435026792
Determination0.813940363546352
T-Test17.6237930027955
p-value (2 sided)0
p-value (1 sided)0
Degrees of Freedom71
Number of Observations73


Parameters (Session):
Parameters (R input):
R code (references can be found in the software module):
bitmap(file='test1.png')
histx <- hist(x, plot=FALSE)
histy <- hist(y, plot=FALSE)
maxcounts <- max(c(histx$counts, histx$counts))
xrange <- c(min(x),max(x))
yrange <- c(min(y),max(y))
nf <- layout(matrix(c(2,0,1,3),2,2,byrow=TRUE), c(3,1), c(1,3), TRUE)
par(mar=c(4,4,1,1))
plot(x, y, xlim=xrange, ylim=yrange, xlab=xlab, ylab=ylab)
par(mar=c(0,4,1,1))
barplot(histx$counts, axes=FALSE, ylim=c(0, maxcounts), space=0)
par(mar=c(4,0,1,1))
barplot(histy$counts, axes=FALSE, xlim=c(0, maxcounts), space=0, horiz=TRUE)
dev.off()
lx = length(x)
makebiased = (lx-1)/lx
varx = var(x)*makebiased
vary = var(y)*makebiased
corxy <- cor.test(x,y,method='pearson')
cxy <- as.matrix(corxy$estimate)[1,1]
load(file='createtable')
a<-table.start()
a<-table.row.start(a)
a<-table.element(a,'Pearson Product Moment Correlation - Ungrouped Data',3,TRUE)
a<-table.row.end(a)
a<-table.row.start(a)
a<-table.element(a,'Statistic',1,TRUE)
a<-table.element(a,'Variable X',1,TRUE)
a<-table.element(a,'Variable Y',1,TRUE)
a<-table.row.end(a)
a<-table.row.start(a)
a<-table.element(a,hyperlink('arithmetic_mean.htm','Mean',''),header=TRUE)
a<-table.element(a,mean(x))
a<-table.element(a,mean(y))
a<-table.row.end(a)
a<-table.row.start(a)
a<-table.element(a,hyperlink('biased.htm','Biased Variance',''),header=TRUE)
a<-table.element(a,varx)
a<-table.element(a,vary)
a<-table.row.end(a)
a<-table.row.start(a)
a<-table.element(a,hyperlink('biased1.htm','Biased Standard Deviation',''),header=TRUE)
a<-table.element(a,sqrt(varx))
a<-table.element(a,sqrt(vary))
a<-table.row.end(a)
a<-table.row.start(a)
a<-table.element(a,hyperlink('covariance.htm','Covariance',''),header=TRUE)
a<-table.element(a,cov(x,y),2)
a<-table.row.end(a)
a<-table.row.start(a)
a<-table.element(a,hyperlink('pearson_correlation.htm','Correlation',''),header=TRUE)
a<-table.element(a,cxy,2)
a<-table.row.end(a)
a<-table.row.start(a)
a<-table.element(a,hyperlink('coeff_of_determination.htm','Determination',''),header=TRUE)
a<-table.element(a,cxy*cxy,2)
a<-table.row.end(a)
a<-table.row.start(a)
a<-table.element(a,hyperlink('ttest_statistic.htm','T-Test',''),header=TRUE)
a<-table.element(a,as.matrix(corxy$statistic)[1,1],2)
a<-table.row.end(a)
a<-table.row.start(a)
a<-table.element(a,'p-value (2 sided)',header=TRUE)
a<-table.element(a,(p2 <- as.matrix(corxy$p.value)[1,1]),2)
a<-table.row.end(a)
a<-table.row.start(a)
a<-table.element(a,'p-value (1 sided)',header=TRUE)
a<-table.element(a,p2/2,2)
a<-table.row.end(a)
a<-table.row.start(a)
a<-table.element(a,'Degrees of Freedom',header=TRUE)
a<-table.element(a,lx-2,2)
a<-table.row.end(a)
a<-table.row.start(a)
a<-table.element(a,'Number of Observations',header=TRUE)
a<-table.element(a,lx,2)
a<-table.row.end(a)
a<-table.end(a)
table.save(a,file='mytable.tab')