Free Statistics

of Irreproducible Research!

Author's title

Author*The author of this computation has been verified*
R Software Modulerwasp_autocorrelation.wasp
Title produced by software(Partial) Autocorrelation Function
Date of computationFri, 12 Dec 2008 06:14:31 -0700
Cite this page as followsStatistical Computations at FreeStatistics.org, Office for Research Development and Education, URL https://freestatistics.org/blog/index.php?v=date/2008/Dec/12/t1229087732foqkt4p0urzkmu8.htm/, Retrieved Tue, 21 May 2024 03:43:57 +0000
Statistical Computations at FreeStatistics.org, Office for Research Development and Education, URL https://freestatistics.org/blog/index.php?pk=32681, Retrieved Tue, 21 May 2024 03:43:57 +0000
QR Codes:

Original text written by user:
IsPrivate?No (this computation is public)
User-defined keywords
Estimated Impact197
Family? (F = Feedback message, R = changed R code, M = changed R Module, P = changed Parameters, D = changed Data)
-     [Univariate Data Series] [Uitvoer.Nederland] [2008-12-03 15:11:10] [988ab43f527fc78aae41c84649095267]
-   P   [Univariate Data Series] [Export From Belgi...] [2008-12-03 15:52:29] [988ab43f527fc78aae41c84649095267]
- RMP     [(Partial) Autocorrelation Function] [Partial Autocorre...] [2008-12-03 16:01:07] [988ab43f527fc78aae41c84649095267]
-    D      [(Partial) Autocorrelation Function] [Partial Autocorre...] [2008-12-11 17:24:10] [988ab43f527fc78aae41c84649095267]
-   PD          [(Partial) Autocorrelation Function] [Partial Autocorre...] [2008-12-12 13:14:31] [5d823194959040fa9b19b8c8302177e6] [Current]
Feedback Forum

Post a new message
Dataseries X:
3258.1
3140.1
3627.4
3279.4
3204
3515.6
3146.6
2271.7
3627.9
3553.4
3018.3
3355.4
3242
3311.1
4125.2
3423
3120.3
3863
3240.8
2837.4
3945
3684.1
3659.6
3769.6
3592.7
3754
4507.8
3853.2
3817.2
3958.4
3428.9
3125.7
3977
3983.3
4299.6
4306.9
4259.5
3986
4755.6
3925.6
4206.5
4323.4
3816.1
3410.7
4227.4
4296.9
4351.7
3800
4277
4100.2
4672.5
4189.9
4231.9
4654.9
4298.5
3635.9
4505.1
4891.9
4894.2
4093.2


Summary of computational transaction
Raw Inputview raw input (R code)
Raw Outputview raw output of R engine
Computing time2 seconds
R Server'Sir Ronald Aylmer Fisher' @ 193.190.124.24

\begin{tabular}{lllllllll}
\hline
Summary of computational transaction \tabularnewline
Raw Input & view raw input (R code)  \tabularnewline
Raw Output & view raw output of R engine  \tabularnewline
Computing time & 2 seconds \tabularnewline
R Server & 'Sir Ronald Aylmer Fisher' @ 193.190.124.24 \tabularnewline
\hline
\end{tabular}
%Source: https://freestatistics.org/blog/index.php?pk=32681&T=0

[TABLE]
[ROW][C]Summary of computational transaction[/C][/ROW]
[ROW][C]Raw Input[/C][C]view raw input (R code) [/C][/ROW]
[ROW][C]Raw Output[/C][C]view raw output of R engine [/C][/ROW]
[ROW][C]Computing time[/C][C]2 seconds[/C][/ROW]
[ROW][C]R Server[/C][C]'Sir Ronald Aylmer Fisher' @ 193.190.124.24[/C][/ROW]
[/TABLE]
Source: https://freestatistics.org/blog/index.php?pk=32681&T=0

Globally Unique Identifier (entire table): ba.freestatistics.org/blog/index.php?pk=32681&T=0

As an alternative you can also use a QR Code:  

The GUIDs for individual cells are displayed in the table below:

Summary of computational transaction
Raw Inputview raw input (R code)
Raw Outputview raw output of R engine
Computing time2 seconds
R Server'Sir Ronald Aylmer Fisher' @ 193.190.124.24


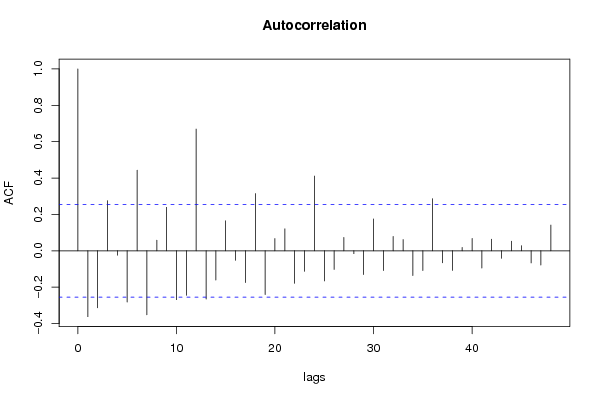
Autocorrelation Function
Time lag kACF(k)T-STATP-value
1-0.362388-2.78360.003606
2-0.313978-2.41170.009504
30.2756362.11720.019234
4-0.024036-0.18460.427078
5-0.28229-2.16830.01709
60.4429413.40230.000603
7-0.352087-2.70440.004464
80.0579470.44510.328939
90.2386921.83340.035892
10-0.268997-2.06620.021604
11-0.245071-1.88240.032356
120.669325.14112e-06
13-0.265128-2.03650.023099
14-0.160707-1.23440.110971
150.1645111.26360.105666
16-0.052183-0.40080.344999
17-0.174888-1.34330.092153
180.3143362.41450.009439
19-0.240609-1.84820.034797
200.0669750.51440.304431
210.1205910.92630.179038
22-0.179084-1.37560.087077
23-0.113002-0.8680.194461
240.4108393.15570.00126
25-0.165653-1.27240.104111
26-0.102684-0.78870.216714
270.0736150.56540.286957
28-0.015906-0.12220.451588
29-0.130964-1.00590.159274
300.174531.34060.092596
31-0.108831-0.83590.20328
320.0790920.60750.272919
330.0614280.47180.319391
34-0.136099-1.04540.150052
35-0.108988-0.83720.202943
360.2862442.19870.015917
37-0.066228-0.50870.306429
38-0.108152-0.83070.204737
390.0178540.13710.445694
400.067690.51990.302527
41-0.094459-0.72560.235489
420.0632980.48620.314312
43-0.041524-0.3190.375444
440.0527260.4050.343473
450.0281620.21630.414744
46-0.066932-0.51410.304545
47-0.078389-0.60210.274702
480.1410831.08370.141458

\begin{tabular}{lllllllll}
\hline
Autocorrelation Function \tabularnewline
Time lag k & ACF(k) & T-STAT & P-value \tabularnewline
1 & -0.362388 & -2.7836 & 0.003606 \tabularnewline
2 & -0.313978 & -2.4117 & 0.009504 \tabularnewline
3 & 0.275636 & 2.1172 & 0.019234 \tabularnewline
4 & -0.024036 & -0.1846 & 0.427078 \tabularnewline
5 & -0.28229 & -2.1683 & 0.01709 \tabularnewline
6 & 0.442941 & 3.4023 & 0.000603 \tabularnewline
7 & -0.352087 & -2.7044 & 0.004464 \tabularnewline
8 & 0.057947 & 0.4451 & 0.328939 \tabularnewline
9 & 0.238692 & 1.8334 & 0.035892 \tabularnewline
10 & -0.268997 & -2.0662 & 0.021604 \tabularnewline
11 & -0.245071 & -1.8824 & 0.032356 \tabularnewline
12 & 0.66932 & 5.1411 & 2e-06 \tabularnewline
13 & -0.265128 & -2.0365 & 0.023099 \tabularnewline
14 & -0.160707 & -1.2344 & 0.110971 \tabularnewline
15 & 0.164511 & 1.2636 & 0.105666 \tabularnewline
16 & -0.052183 & -0.4008 & 0.344999 \tabularnewline
17 & -0.174888 & -1.3433 & 0.092153 \tabularnewline
18 & 0.314336 & 2.4145 & 0.009439 \tabularnewline
19 & -0.240609 & -1.8482 & 0.034797 \tabularnewline
20 & 0.066975 & 0.5144 & 0.304431 \tabularnewline
21 & 0.120591 & 0.9263 & 0.179038 \tabularnewline
22 & -0.179084 & -1.3756 & 0.087077 \tabularnewline
23 & -0.113002 & -0.868 & 0.194461 \tabularnewline
24 & 0.410839 & 3.1557 & 0.00126 \tabularnewline
25 & -0.165653 & -1.2724 & 0.104111 \tabularnewline
26 & -0.102684 & -0.7887 & 0.216714 \tabularnewline
27 & 0.073615 & 0.5654 & 0.286957 \tabularnewline
28 & -0.015906 & -0.1222 & 0.451588 \tabularnewline
29 & -0.130964 & -1.0059 & 0.159274 \tabularnewline
30 & 0.17453 & 1.3406 & 0.092596 \tabularnewline
31 & -0.108831 & -0.8359 & 0.20328 \tabularnewline
32 & 0.079092 & 0.6075 & 0.272919 \tabularnewline
33 & 0.061428 & 0.4718 & 0.319391 \tabularnewline
34 & -0.136099 & -1.0454 & 0.150052 \tabularnewline
35 & -0.108988 & -0.8372 & 0.202943 \tabularnewline
36 & 0.286244 & 2.1987 & 0.015917 \tabularnewline
37 & -0.066228 & -0.5087 & 0.306429 \tabularnewline
38 & -0.108152 & -0.8307 & 0.204737 \tabularnewline
39 & 0.017854 & 0.1371 & 0.445694 \tabularnewline
40 & 0.06769 & 0.5199 & 0.302527 \tabularnewline
41 & -0.094459 & -0.7256 & 0.235489 \tabularnewline
42 & 0.063298 & 0.4862 & 0.314312 \tabularnewline
43 & -0.041524 & -0.319 & 0.375444 \tabularnewline
44 & 0.052726 & 0.405 & 0.343473 \tabularnewline
45 & 0.028162 & 0.2163 & 0.414744 \tabularnewline
46 & -0.066932 & -0.5141 & 0.304545 \tabularnewline
47 & -0.078389 & -0.6021 & 0.274702 \tabularnewline
48 & 0.141083 & 1.0837 & 0.141458 \tabularnewline
\hline
\end{tabular}
%Source: https://freestatistics.org/blog/index.php?pk=32681&T=1

[TABLE]
[ROW][C]Autocorrelation Function[/C][/ROW]
[ROW][C]Time lag k[/C][C]ACF(k)[/C][C]T-STAT[/C][C]P-value[/C][/ROW]
[ROW][C]1[/C][C]-0.362388[/C][C]-2.7836[/C][C]0.003606[/C][/ROW]
[ROW][C]2[/C][C]-0.313978[/C][C]-2.4117[/C][C]0.009504[/C][/ROW]
[ROW][C]3[/C][C]0.275636[/C][C]2.1172[/C][C]0.019234[/C][/ROW]
[ROW][C]4[/C][C]-0.024036[/C][C]-0.1846[/C][C]0.427078[/C][/ROW]
[ROW][C]5[/C][C]-0.28229[/C][C]-2.1683[/C][C]0.01709[/C][/ROW]
[ROW][C]6[/C][C]0.442941[/C][C]3.4023[/C][C]0.000603[/C][/ROW]
[ROW][C]7[/C][C]-0.352087[/C][C]-2.7044[/C][C]0.004464[/C][/ROW]
[ROW][C]8[/C][C]0.057947[/C][C]0.4451[/C][C]0.328939[/C][/ROW]
[ROW][C]9[/C][C]0.238692[/C][C]1.8334[/C][C]0.035892[/C][/ROW]
[ROW][C]10[/C][C]-0.268997[/C][C]-2.0662[/C][C]0.021604[/C][/ROW]
[ROW][C]11[/C][C]-0.245071[/C][C]-1.8824[/C][C]0.032356[/C][/ROW]
[ROW][C]12[/C][C]0.66932[/C][C]5.1411[/C][C]2e-06[/C][/ROW]
[ROW][C]13[/C][C]-0.265128[/C][C]-2.0365[/C][C]0.023099[/C][/ROW]
[ROW][C]14[/C][C]-0.160707[/C][C]-1.2344[/C][C]0.110971[/C][/ROW]
[ROW][C]15[/C][C]0.164511[/C][C]1.2636[/C][C]0.105666[/C][/ROW]
[ROW][C]16[/C][C]-0.052183[/C][C]-0.4008[/C][C]0.344999[/C][/ROW]
[ROW][C]17[/C][C]-0.174888[/C][C]-1.3433[/C][C]0.092153[/C][/ROW]
[ROW][C]18[/C][C]0.314336[/C][C]2.4145[/C][C]0.009439[/C][/ROW]
[ROW][C]19[/C][C]-0.240609[/C][C]-1.8482[/C][C]0.034797[/C][/ROW]
[ROW][C]20[/C][C]0.066975[/C][C]0.5144[/C][C]0.304431[/C][/ROW]
[ROW][C]21[/C][C]0.120591[/C][C]0.9263[/C][C]0.179038[/C][/ROW]
[ROW][C]22[/C][C]-0.179084[/C][C]-1.3756[/C][C]0.087077[/C][/ROW]
[ROW][C]23[/C][C]-0.113002[/C][C]-0.868[/C][C]0.194461[/C][/ROW]
[ROW][C]24[/C][C]0.410839[/C][C]3.1557[/C][C]0.00126[/C][/ROW]
[ROW][C]25[/C][C]-0.165653[/C][C]-1.2724[/C][C]0.104111[/C][/ROW]
[ROW][C]26[/C][C]-0.102684[/C][C]-0.7887[/C][C]0.216714[/C][/ROW]
[ROW][C]27[/C][C]0.073615[/C][C]0.5654[/C][C]0.286957[/C][/ROW]
[ROW][C]28[/C][C]-0.015906[/C][C]-0.1222[/C][C]0.451588[/C][/ROW]
[ROW][C]29[/C][C]-0.130964[/C][C]-1.0059[/C][C]0.159274[/C][/ROW]
[ROW][C]30[/C][C]0.17453[/C][C]1.3406[/C][C]0.092596[/C][/ROW]
[ROW][C]31[/C][C]-0.108831[/C][C]-0.8359[/C][C]0.20328[/C][/ROW]
[ROW][C]32[/C][C]0.079092[/C][C]0.6075[/C][C]0.272919[/C][/ROW]
[ROW][C]33[/C][C]0.061428[/C][C]0.4718[/C][C]0.319391[/C][/ROW]
[ROW][C]34[/C][C]-0.136099[/C][C]-1.0454[/C][C]0.150052[/C][/ROW]
[ROW][C]35[/C][C]-0.108988[/C][C]-0.8372[/C][C]0.202943[/C][/ROW]
[ROW][C]36[/C][C]0.286244[/C][C]2.1987[/C][C]0.015917[/C][/ROW]
[ROW][C]37[/C][C]-0.066228[/C][C]-0.5087[/C][C]0.306429[/C][/ROW]
[ROW][C]38[/C][C]-0.108152[/C][C]-0.8307[/C][C]0.204737[/C][/ROW]
[ROW][C]39[/C][C]0.017854[/C][C]0.1371[/C][C]0.445694[/C][/ROW]
[ROW][C]40[/C][C]0.06769[/C][C]0.5199[/C][C]0.302527[/C][/ROW]
[ROW][C]41[/C][C]-0.094459[/C][C]-0.7256[/C][C]0.235489[/C][/ROW]
[ROW][C]42[/C][C]0.063298[/C][C]0.4862[/C][C]0.314312[/C][/ROW]
[ROW][C]43[/C][C]-0.041524[/C][C]-0.319[/C][C]0.375444[/C][/ROW]
[ROW][C]44[/C][C]0.052726[/C][C]0.405[/C][C]0.343473[/C][/ROW]
[ROW][C]45[/C][C]0.028162[/C][C]0.2163[/C][C]0.414744[/C][/ROW]
[ROW][C]46[/C][C]-0.066932[/C][C]-0.5141[/C][C]0.304545[/C][/ROW]
[ROW][C]47[/C][C]-0.078389[/C][C]-0.6021[/C][C]0.274702[/C][/ROW]
[ROW][C]48[/C][C]0.141083[/C][C]1.0837[/C][C]0.141458[/C][/ROW]
[/TABLE]
Source: https://freestatistics.org/blog/index.php?pk=32681&T=1

Globally Unique Identifier (entire table): ba.freestatistics.org/blog/index.php?pk=32681&T=1

As an alternative you can also use a QR Code:  

The GUIDs for individual cells are displayed in the table below:

Autocorrelation Function
Time lag kACF(k)T-STATP-value
1-0.362388-2.78360.003606
2-0.313978-2.41170.009504
30.2756362.11720.019234
4-0.024036-0.18460.427078
5-0.28229-2.16830.01709
60.4429413.40230.000603
7-0.352087-2.70440.004464
80.0579470.44510.328939
90.2386921.83340.035892
10-0.268997-2.06620.021604
11-0.245071-1.88240.032356
120.669325.14112e-06
13-0.265128-2.03650.023099
14-0.160707-1.23440.110971
150.1645111.26360.105666
16-0.052183-0.40080.344999
17-0.174888-1.34330.092153
180.3143362.41450.009439
19-0.240609-1.84820.034797
200.0669750.51440.304431
210.1205910.92630.179038
22-0.179084-1.37560.087077
23-0.113002-0.8680.194461
240.4108393.15570.00126
25-0.165653-1.27240.104111
26-0.102684-0.78870.216714
270.0736150.56540.286957
28-0.015906-0.12220.451588
29-0.130964-1.00590.159274
300.174531.34060.092596
31-0.108831-0.83590.20328
320.0790920.60750.272919
330.0614280.47180.319391
34-0.136099-1.04540.150052
35-0.108988-0.83720.202943
360.2862442.19870.015917
37-0.066228-0.50870.306429
38-0.108152-0.83070.204737
390.0178540.13710.445694
400.067690.51990.302527
41-0.094459-0.72560.235489
420.0632980.48620.314312
43-0.041524-0.3190.375444
440.0527260.4050.343473
450.0281620.21630.414744
46-0.066932-0.51410.304545
47-0.078389-0.60210.274702
480.1410831.08370.141458


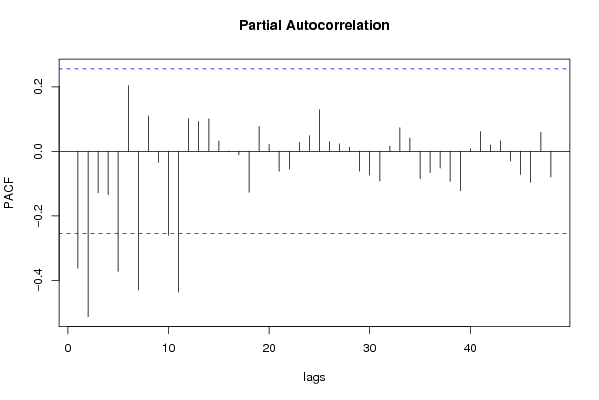
Partial Autocorrelation Function
Time lag kPACF(k)T-STATP-value
1-0.362388-2.78360.003606
2-0.512623-3.93750.00011
3-0.128422-0.98640.163976
4-0.133989-1.02920.153795
5-0.371744-2.85540.002962
60.2031421.56040.062011
7-0.429893-3.30210.000817
80.1091590.83850.202578
9-0.033919-0.26050.397679
10-0.260224-1.99880.025121
11-0.436106-3.34980.000707
120.1011670.77710.22011
130.0925040.71050.240085
140.1005190.77210.221567
150.0314960.24190.404839
160.0005740.00440.498248
17-0.010603-0.08140.467684
18-0.127129-0.97650.166403
190.0764770.58740.279578
200.0212780.16340.435365
21-0.061889-0.47540.318136
22-0.055266-0.42450.33637
230.0280270.21530.415145
240.0480270.36890.35676
250.1284040.98630.16401
260.0301150.23130.408933
270.02310.17740.429887
280.012790.09820.461035
29-0.061624-0.47330.318857
30-0.073582-0.56520.287043
31-0.092301-0.7090.240564
320.0160550.12330.451136
330.0727690.5590.289156
340.0412460.31680.376252
35-0.084596-0.64980.259174
36-0.065667-0.50440.30793
37-0.051723-0.39730.346292
38-0.093118-0.71520.238638
39-0.122573-0.94150.175144
400.0076850.0590.476565
410.0609620.46830.320663
420.0198860.15270.439559
430.0321030.24660.403041
44-0.029887-0.22960.409613
45-0.071341-0.5480.292886
46-0.096144-0.73850.23157
470.058290.44770.327993
48-0.079569-0.61120.271713

\begin{tabular}{lllllllll}
\hline
Partial Autocorrelation Function \tabularnewline
Time lag k & PACF(k) & T-STAT & P-value \tabularnewline
1 & -0.362388 & -2.7836 & 0.003606 \tabularnewline
2 & -0.512623 & -3.9375 & 0.00011 \tabularnewline
3 & -0.128422 & -0.9864 & 0.163976 \tabularnewline
4 & -0.133989 & -1.0292 & 0.153795 \tabularnewline
5 & -0.371744 & -2.8554 & 0.002962 \tabularnewline
6 & 0.203142 & 1.5604 & 0.062011 \tabularnewline
7 & -0.429893 & -3.3021 & 0.000817 \tabularnewline
8 & 0.109159 & 0.8385 & 0.202578 \tabularnewline
9 & -0.033919 & -0.2605 & 0.397679 \tabularnewline
10 & -0.260224 & -1.9988 & 0.025121 \tabularnewline
11 & -0.436106 & -3.3498 & 0.000707 \tabularnewline
12 & 0.101167 & 0.7771 & 0.22011 \tabularnewline
13 & 0.092504 & 0.7105 & 0.240085 \tabularnewline
14 & 0.100519 & 0.7721 & 0.221567 \tabularnewline
15 & 0.031496 & 0.2419 & 0.404839 \tabularnewline
16 & 0.000574 & 0.0044 & 0.498248 \tabularnewline
17 & -0.010603 & -0.0814 & 0.467684 \tabularnewline
18 & -0.127129 & -0.9765 & 0.166403 \tabularnewline
19 & 0.076477 & 0.5874 & 0.279578 \tabularnewline
20 & 0.021278 & 0.1634 & 0.435365 \tabularnewline
21 & -0.061889 & -0.4754 & 0.318136 \tabularnewline
22 & -0.055266 & -0.4245 & 0.33637 \tabularnewline
23 & 0.028027 & 0.2153 & 0.415145 \tabularnewline
24 & 0.048027 & 0.3689 & 0.35676 \tabularnewline
25 & 0.128404 & 0.9863 & 0.16401 \tabularnewline
26 & 0.030115 & 0.2313 & 0.408933 \tabularnewline
27 & 0.0231 & 0.1774 & 0.429887 \tabularnewline
28 & 0.01279 & 0.0982 & 0.461035 \tabularnewline
29 & -0.061624 & -0.4733 & 0.318857 \tabularnewline
30 & -0.073582 & -0.5652 & 0.287043 \tabularnewline
31 & -0.092301 & -0.709 & 0.240564 \tabularnewline
32 & 0.016055 & 0.1233 & 0.451136 \tabularnewline
33 & 0.072769 & 0.559 & 0.289156 \tabularnewline
34 & 0.041246 & 0.3168 & 0.376252 \tabularnewline
35 & -0.084596 & -0.6498 & 0.259174 \tabularnewline
36 & -0.065667 & -0.5044 & 0.30793 \tabularnewline
37 & -0.051723 & -0.3973 & 0.346292 \tabularnewline
38 & -0.093118 & -0.7152 & 0.238638 \tabularnewline
39 & -0.122573 & -0.9415 & 0.175144 \tabularnewline
40 & 0.007685 & 0.059 & 0.476565 \tabularnewline
41 & 0.060962 & 0.4683 & 0.320663 \tabularnewline
42 & 0.019886 & 0.1527 & 0.439559 \tabularnewline
43 & 0.032103 & 0.2466 & 0.403041 \tabularnewline
44 & -0.029887 & -0.2296 & 0.409613 \tabularnewline
45 & -0.071341 & -0.548 & 0.292886 \tabularnewline
46 & -0.096144 & -0.7385 & 0.23157 \tabularnewline
47 & 0.05829 & 0.4477 & 0.327993 \tabularnewline
48 & -0.079569 & -0.6112 & 0.271713 \tabularnewline
\hline
\end{tabular}
%Source: https://freestatistics.org/blog/index.php?pk=32681&T=2

[TABLE]
[ROW][C]Partial Autocorrelation Function[/C][/ROW]
[ROW][C]Time lag k[/C][C]PACF(k)[/C][C]T-STAT[/C][C]P-value[/C][/ROW]
[ROW][C]1[/C][C]-0.362388[/C][C]-2.7836[/C][C]0.003606[/C][/ROW]
[ROW][C]2[/C][C]-0.512623[/C][C]-3.9375[/C][C]0.00011[/C][/ROW]
[ROW][C]3[/C][C]-0.128422[/C][C]-0.9864[/C][C]0.163976[/C][/ROW]
[ROW][C]4[/C][C]-0.133989[/C][C]-1.0292[/C][C]0.153795[/C][/ROW]
[ROW][C]5[/C][C]-0.371744[/C][C]-2.8554[/C][C]0.002962[/C][/ROW]
[ROW][C]6[/C][C]0.203142[/C][C]1.5604[/C][C]0.062011[/C][/ROW]
[ROW][C]7[/C][C]-0.429893[/C][C]-3.3021[/C][C]0.000817[/C][/ROW]
[ROW][C]8[/C][C]0.109159[/C][C]0.8385[/C][C]0.202578[/C][/ROW]
[ROW][C]9[/C][C]-0.033919[/C][C]-0.2605[/C][C]0.397679[/C][/ROW]
[ROW][C]10[/C][C]-0.260224[/C][C]-1.9988[/C][C]0.025121[/C][/ROW]
[ROW][C]11[/C][C]-0.436106[/C][C]-3.3498[/C][C]0.000707[/C][/ROW]
[ROW][C]12[/C][C]0.101167[/C][C]0.7771[/C][C]0.22011[/C][/ROW]
[ROW][C]13[/C][C]0.092504[/C][C]0.7105[/C][C]0.240085[/C][/ROW]
[ROW][C]14[/C][C]0.100519[/C][C]0.7721[/C][C]0.221567[/C][/ROW]
[ROW][C]15[/C][C]0.031496[/C][C]0.2419[/C][C]0.404839[/C][/ROW]
[ROW][C]16[/C][C]0.000574[/C][C]0.0044[/C][C]0.498248[/C][/ROW]
[ROW][C]17[/C][C]-0.010603[/C][C]-0.0814[/C][C]0.467684[/C][/ROW]
[ROW][C]18[/C][C]-0.127129[/C][C]-0.9765[/C][C]0.166403[/C][/ROW]
[ROW][C]19[/C][C]0.076477[/C][C]0.5874[/C][C]0.279578[/C][/ROW]
[ROW][C]20[/C][C]0.021278[/C][C]0.1634[/C][C]0.435365[/C][/ROW]
[ROW][C]21[/C][C]-0.061889[/C][C]-0.4754[/C][C]0.318136[/C][/ROW]
[ROW][C]22[/C][C]-0.055266[/C][C]-0.4245[/C][C]0.33637[/C][/ROW]
[ROW][C]23[/C][C]0.028027[/C][C]0.2153[/C][C]0.415145[/C][/ROW]
[ROW][C]24[/C][C]0.048027[/C][C]0.3689[/C][C]0.35676[/C][/ROW]
[ROW][C]25[/C][C]0.128404[/C][C]0.9863[/C][C]0.16401[/C][/ROW]
[ROW][C]26[/C][C]0.030115[/C][C]0.2313[/C][C]0.408933[/C][/ROW]
[ROW][C]27[/C][C]0.0231[/C][C]0.1774[/C][C]0.429887[/C][/ROW]
[ROW][C]28[/C][C]0.01279[/C][C]0.0982[/C][C]0.461035[/C][/ROW]
[ROW][C]29[/C][C]-0.061624[/C][C]-0.4733[/C][C]0.318857[/C][/ROW]
[ROW][C]30[/C][C]-0.073582[/C][C]-0.5652[/C][C]0.287043[/C][/ROW]
[ROW][C]31[/C][C]-0.092301[/C][C]-0.709[/C][C]0.240564[/C][/ROW]
[ROW][C]32[/C][C]0.016055[/C][C]0.1233[/C][C]0.451136[/C][/ROW]
[ROW][C]33[/C][C]0.072769[/C][C]0.559[/C][C]0.289156[/C][/ROW]
[ROW][C]34[/C][C]0.041246[/C][C]0.3168[/C][C]0.376252[/C][/ROW]
[ROW][C]35[/C][C]-0.084596[/C][C]-0.6498[/C][C]0.259174[/C][/ROW]
[ROW][C]36[/C][C]-0.065667[/C][C]-0.5044[/C][C]0.30793[/C][/ROW]
[ROW][C]37[/C][C]-0.051723[/C][C]-0.3973[/C][C]0.346292[/C][/ROW]
[ROW][C]38[/C][C]-0.093118[/C][C]-0.7152[/C][C]0.238638[/C][/ROW]
[ROW][C]39[/C][C]-0.122573[/C][C]-0.9415[/C][C]0.175144[/C][/ROW]
[ROW][C]40[/C][C]0.007685[/C][C]0.059[/C][C]0.476565[/C][/ROW]
[ROW][C]41[/C][C]0.060962[/C][C]0.4683[/C][C]0.320663[/C][/ROW]
[ROW][C]42[/C][C]0.019886[/C][C]0.1527[/C][C]0.439559[/C][/ROW]
[ROW][C]43[/C][C]0.032103[/C][C]0.2466[/C][C]0.403041[/C][/ROW]
[ROW][C]44[/C][C]-0.029887[/C][C]-0.2296[/C][C]0.409613[/C][/ROW]
[ROW][C]45[/C][C]-0.071341[/C][C]-0.548[/C][C]0.292886[/C][/ROW]
[ROW][C]46[/C][C]-0.096144[/C][C]-0.7385[/C][C]0.23157[/C][/ROW]
[ROW][C]47[/C][C]0.05829[/C][C]0.4477[/C][C]0.327993[/C][/ROW]
[ROW][C]48[/C][C]-0.079569[/C][C]-0.6112[/C][C]0.271713[/C][/ROW]
[/TABLE]
Source: https://freestatistics.org/blog/index.php?pk=32681&T=2

Globally Unique Identifier (entire table): ba.freestatistics.org/blog/index.php?pk=32681&T=2

As an alternative you can also use a QR Code:  

The GUIDs for individual cells are displayed in the table below:

Partial Autocorrelation Function
Time lag kPACF(k)T-STATP-value
1-0.362388-2.78360.003606
2-0.512623-3.93750.00011
3-0.128422-0.98640.163976
4-0.133989-1.02920.153795
5-0.371744-2.85540.002962
60.2031421.56040.062011
7-0.429893-3.30210.000817
80.1091590.83850.202578
9-0.033919-0.26050.397679
10-0.260224-1.99880.025121
11-0.436106-3.34980.000707
120.1011670.77710.22011
130.0925040.71050.240085
140.1005190.77210.221567
150.0314960.24190.404839
160.0005740.00440.498248
17-0.010603-0.08140.467684
18-0.127129-0.97650.166403
190.0764770.58740.279578
200.0212780.16340.435365
21-0.061889-0.47540.318136
22-0.055266-0.42450.33637
230.0280270.21530.415145
240.0480270.36890.35676
250.1284040.98630.16401
260.0301150.23130.408933
270.02310.17740.429887
280.012790.09820.461035
29-0.061624-0.47330.318857
30-0.073582-0.56520.287043
31-0.092301-0.7090.240564
320.0160550.12330.451136
330.0727690.5590.289156
340.0412460.31680.376252
35-0.084596-0.64980.259174
36-0.065667-0.50440.30793
37-0.051723-0.39730.346292
38-0.093118-0.71520.238638
39-0.122573-0.94150.175144
400.0076850.0590.476565
410.0609620.46830.320663
420.0198860.15270.439559
430.0321030.24660.403041
44-0.029887-0.22960.409613
45-0.071341-0.5480.292886
46-0.096144-0.73850.23157
470.058290.44770.327993
48-0.079569-0.61120.271713


Parameters (Session):
par1 = 12 ;
Parameters (R input):
par1 = 48 ; par2 = 1 ; par3 = 1 ; par4 = 0 ; par5 = 12 ;
R code (references can be found in the software module):
if (par1 == 'Default') {
par1 = 10*log10(length(x))
} else {
par1 <- as.numeric(par1)
}
par2 <- as.numeric(par2)
par3 <- as.numeric(par3)
par4 <- as.numeric(par4)
par5 <- as.numeric(par5)
if (par2 == 0) {
x <- log(x)
} else {
x <- (x ^ par2 - 1) / par2
}
if (par3 > 0) x <- diff(x,lag=1,difference=par3)
if (par4 > 0) x <- diff(x,lag=par5,difference=par4)
bitmap(file='pic1.png')
racf <- acf(x,par1,main='Autocorrelation',xlab='lags',ylab='ACF')
dev.off()
bitmap(file='pic2.png')
rpacf <- pacf(x,par1,main='Partial Autocorrelation',xlab='lags',ylab='PACF')
dev.off()
(myacf <- c(racf$acf))
(mypacf <- c(rpacf$acf))
lengthx <- length(x)
sqrtn <- sqrt(lengthx)
load(file='createtable')
a<-table.start()
a<-table.row.start(a)
a<-table.element(a,'Autocorrelation Function',4,TRUE)
a<-table.row.end(a)
a<-table.row.start(a)
a<-table.element(a,'Time lag k',header=TRUE)
a<-table.element(a,hyperlink('basics.htm','ACF(k)','click here for more information about the Autocorrelation Function'),header=TRUE)
a<-table.element(a,'T-STAT',header=TRUE)
a<-table.element(a,'P-value',header=TRUE)
a<-table.row.end(a)
for (i in 2:(par1+1)) {
a<-table.row.start(a)
a<-table.element(a,i-1,header=TRUE)
a<-table.element(a,round(myacf[i],6))
mytstat <- myacf[i]*sqrtn
a<-table.element(a,round(mytstat,4))
a<-table.element(a,round(1-pt(abs(mytstat),lengthx),6))
a<-table.row.end(a)
}
a<-table.end(a)
table.save(a,file='mytable.tab')
a<-table.start()
a<-table.row.start(a)
a<-table.element(a,'Partial Autocorrelation Function',4,TRUE)
a<-table.row.end(a)
a<-table.row.start(a)
a<-table.element(a,'Time lag k',header=TRUE)
a<-table.element(a,hyperlink('basics.htm','PACF(k)','click here for more information about the Partial Autocorrelation Function'),header=TRUE)
a<-table.element(a,'T-STAT',header=TRUE)
a<-table.element(a,'P-value',header=TRUE)
a<-table.row.end(a)
for (i in 1:par1) {
a<-table.row.start(a)
a<-table.element(a,i,header=TRUE)
a<-table.element(a,round(mypacf[i],6))
mytstat <- mypacf[i]*sqrtn
a<-table.element(a,round(mytstat,4))
a<-table.element(a,round(1-pt(abs(mytstat),lengthx),6))
a<-table.row.end(a)
}
a<-table.end(a)
table.save(a,file='mytable1.tab')