Free Statistics

of Irreproducible Research!

Author's title

Author*The author of this computation has been verified*
R Software Modulerwasp_autocorrelation.wasp
Title produced by software(Partial) Autocorrelation Function
Date of computationFri, 12 Dec 2008 06:13:07 -0700
Cite this page as followsStatistical Computations at FreeStatistics.org, Office for Research Development and Education, URL https://freestatistics.org/blog/index.php?v=date/2008/Dec/12/t1229087614zb96uh0qd1dukr6.htm/, Retrieved Fri, 17 May 2024 15:20:04 +0000
Statistical Computations at FreeStatistics.org, Office for Research Development and Education, URL https://freestatistics.org/blog/index.php?pk=32676, Retrieved Fri, 17 May 2024 15:20:04 +0000
QR Codes:

Original text written by user:
IsPrivate?No (this computation is public)
User-defined keywords
Estimated Impact212
Family? (F = Feedback message, R = changed R code, M = changed R Module, P = changed Parameters, D = changed Data)
-     [Univariate Data Series] [Uitvoer.Nederland] [2008-12-03 15:11:10] [988ab43f527fc78aae41c84649095267]
-   P   [Univariate Data Series] [Export From Belgi...] [2008-12-03 15:52:29] [988ab43f527fc78aae41c84649095267]
- RMP     [(Partial) Autocorrelation Function] [Partial Autocorre...] [2008-12-03 16:01:07] [988ab43f527fc78aae41c84649095267]
-    D      [(Partial) Autocorrelation Function] [Partial Autocorre...] [2008-12-11 17:24:10] [988ab43f527fc78aae41c84649095267]
-   PD          [(Partial) Autocorrelation Function] [Partial Autocorre...] [2008-12-12 13:13:07] [5d823194959040fa9b19b8c8302177e6] [Current]
Feedback Forum

Post a new message
Dataseries X:
3258.1
3140.1
3627.4
3279.4
3204
3515.6
3146.6
2271.7
3627.9
3553.4
3018.3
3355.4
3242
3311.1
4125.2
3423
3120.3
3863
3240.8
2837.4
3945
3684.1
3659.6
3769.6
3592.7
3754
4507.8
3853.2
3817.2
3958.4
3428.9
3125.7
3977
3983.3
4299.6
4306.9
4259.5
3986
4755.6
3925.6
4206.5
4323.4
3816.1
3410.7
4227.4
4296.9
4351.7
3800
4277
4100.2
4672.5
4189.9
4231.9
4654.9
4298.5
3635.9
4505.1
4891.9
4894.2
4093.2


Summary of computational transaction
Raw Inputview raw input (R code)
Raw Outputview raw output of R engine
Computing time1 seconds
R Server'Gwilym Jenkins' @ 72.249.127.135

\begin{tabular}{lllllllll}
\hline
Summary of computational transaction \tabularnewline
Raw Input & view raw input (R code)  \tabularnewline
Raw Output & view raw output of R engine  \tabularnewline
Computing time & 1 seconds \tabularnewline
R Server & 'Gwilym Jenkins' @ 72.249.127.135 \tabularnewline
\hline
\end{tabular}
%Source: https://freestatistics.org/blog/index.php?pk=32676&T=0

[TABLE]
[ROW][C]Summary of computational transaction[/C][/ROW]
[ROW][C]Raw Input[/C][C]view raw input (R code) [/C][/ROW]
[ROW][C]Raw Output[/C][C]view raw output of R engine [/C][/ROW]
[ROW][C]Computing time[/C][C]1 seconds[/C][/ROW]
[ROW][C]R Server[/C][C]'Gwilym Jenkins' @ 72.249.127.135[/C][/ROW]
[/TABLE]
Source: https://freestatistics.org/blog/index.php?pk=32676&T=0

Globally Unique Identifier (entire table): ba.freestatistics.org/blog/index.php?pk=32676&T=0

As an alternative you can also use a QR Code:  

The GUIDs for individual cells are displayed in the table below:

Summary of computational transaction
Raw Inputview raw input (R code)
Raw Outputview raw output of R engine
Computing time1 seconds
R Server'Gwilym Jenkins' @ 72.249.127.135


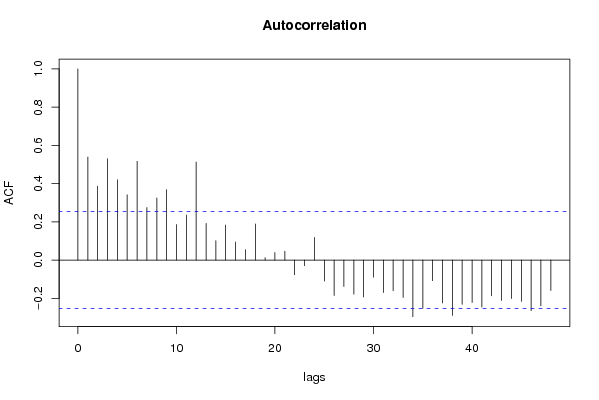
Autocorrelation Function
Time lag kACF(k)T-STATP-value
10.5390494.17554.9e-05
20.3859892.98990.002021
30.5300254.10566.2e-05
40.4198933.25250.00094
50.3418552.6480.005165
60.5167814.0038.7e-05
70.274832.12880.018692
80.3251972.5190.007226
90.3682692.85260.00297
100.1859981.44070.077429
110.2355751.82480.036508
120.5128173.97239.7e-05
130.1917711.48550.07133
140.1016860.78770.216999
150.1833321.42010.080379
160.0942940.73040.233994
170.054320.42080.337717
180.1895221.4680.07366
190.0129290.10010.460281
200.0396650.30720.37986
210.0468240.36270.359053
22-0.076851-0.59530.276947
23-0.029117-0.22550.411163
240.1188770.92080.180416
25-0.109636-0.84920.199562
26-0.184643-1.43020.078917
27-0.137574-1.06560.145427
28-0.178517-1.38280.085927
29-0.193004-1.4950.070077
30-0.089758-0.69530.244789
31-0.169681-1.31430.096866
32-0.160572-1.24380.109208
33-0.195303-1.51280.067789
34-0.295905-2.29210.012713
35-0.252159-1.95320.027731
36-0.107597-0.83340.20395
37-0.224492-1.73890.04359
38-0.289366-2.24140.014355
39-0.231669-1.79450.038885
40-0.221837-1.71830.045446
41-0.245848-1.90430.030832
42-0.18695-1.44810.076397
43-0.211733-1.64010.053111
44-0.201388-1.55990.062016
45-0.216024-1.67330.049736
46-0.264866-2.05160.022288
47-0.238915-1.85060.034574
48-0.159737-1.23730.110394

\begin{tabular}{lllllllll}
\hline
Autocorrelation Function \tabularnewline
Time lag k & ACF(k) & T-STAT & P-value \tabularnewline
1 & 0.539049 & 4.1755 & 4.9e-05 \tabularnewline
2 & 0.385989 & 2.9899 & 0.002021 \tabularnewline
3 & 0.530025 & 4.1056 & 6.2e-05 \tabularnewline
4 & 0.419893 & 3.2525 & 0.00094 \tabularnewline
5 & 0.341855 & 2.648 & 0.005165 \tabularnewline
6 & 0.516781 & 4.003 & 8.7e-05 \tabularnewline
7 & 0.27483 & 2.1288 & 0.018692 \tabularnewline
8 & 0.325197 & 2.519 & 0.007226 \tabularnewline
9 & 0.368269 & 2.8526 & 0.00297 \tabularnewline
10 & 0.185998 & 1.4407 & 0.077429 \tabularnewline
11 & 0.235575 & 1.8248 & 0.036508 \tabularnewline
12 & 0.512817 & 3.9723 & 9.7e-05 \tabularnewline
13 & 0.191771 & 1.4855 & 0.07133 \tabularnewline
14 & 0.101686 & 0.7877 & 0.216999 \tabularnewline
15 & 0.183332 & 1.4201 & 0.080379 \tabularnewline
16 & 0.094294 & 0.7304 & 0.233994 \tabularnewline
17 & 0.05432 & 0.4208 & 0.337717 \tabularnewline
18 & 0.189522 & 1.468 & 0.07366 \tabularnewline
19 & 0.012929 & 0.1001 & 0.460281 \tabularnewline
20 & 0.039665 & 0.3072 & 0.37986 \tabularnewline
21 & 0.046824 & 0.3627 & 0.359053 \tabularnewline
22 & -0.076851 & -0.5953 & 0.276947 \tabularnewline
23 & -0.029117 & -0.2255 & 0.411163 \tabularnewline
24 & 0.118877 & 0.9208 & 0.180416 \tabularnewline
25 & -0.109636 & -0.8492 & 0.199562 \tabularnewline
26 & -0.184643 & -1.4302 & 0.078917 \tabularnewline
27 & -0.137574 & -1.0656 & 0.145427 \tabularnewline
28 & -0.178517 & -1.3828 & 0.085927 \tabularnewline
29 & -0.193004 & -1.495 & 0.070077 \tabularnewline
30 & -0.089758 & -0.6953 & 0.244789 \tabularnewline
31 & -0.169681 & -1.3143 & 0.096866 \tabularnewline
32 & -0.160572 & -1.2438 & 0.109208 \tabularnewline
33 & -0.195303 & -1.5128 & 0.067789 \tabularnewline
34 & -0.295905 & -2.2921 & 0.012713 \tabularnewline
35 & -0.252159 & -1.9532 & 0.027731 \tabularnewline
36 & -0.107597 & -0.8334 & 0.20395 \tabularnewline
37 & -0.224492 & -1.7389 & 0.04359 \tabularnewline
38 & -0.289366 & -2.2414 & 0.014355 \tabularnewline
39 & -0.231669 & -1.7945 & 0.038885 \tabularnewline
40 & -0.221837 & -1.7183 & 0.045446 \tabularnewline
41 & -0.245848 & -1.9043 & 0.030832 \tabularnewline
42 & -0.18695 & -1.4481 & 0.076397 \tabularnewline
43 & -0.211733 & -1.6401 & 0.053111 \tabularnewline
44 & -0.201388 & -1.5599 & 0.062016 \tabularnewline
45 & -0.216024 & -1.6733 & 0.049736 \tabularnewline
46 & -0.264866 & -2.0516 & 0.022288 \tabularnewline
47 & -0.238915 & -1.8506 & 0.034574 \tabularnewline
48 & -0.159737 & -1.2373 & 0.110394 \tabularnewline
\hline
\end{tabular}
%Source: https://freestatistics.org/blog/index.php?pk=32676&T=1

[TABLE]
[ROW][C]Autocorrelation Function[/C][/ROW]
[ROW][C]Time lag k[/C][C]ACF(k)[/C][C]T-STAT[/C][C]P-value[/C][/ROW]
[ROW][C]1[/C][C]0.539049[/C][C]4.1755[/C][C]4.9e-05[/C][/ROW]
[ROW][C]2[/C][C]0.385989[/C][C]2.9899[/C][C]0.002021[/C][/ROW]
[ROW][C]3[/C][C]0.530025[/C][C]4.1056[/C][C]6.2e-05[/C][/ROW]
[ROW][C]4[/C][C]0.419893[/C][C]3.2525[/C][C]0.00094[/C][/ROW]
[ROW][C]5[/C][C]0.341855[/C][C]2.648[/C][C]0.005165[/C][/ROW]
[ROW][C]6[/C][C]0.516781[/C][C]4.003[/C][C]8.7e-05[/C][/ROW]
[ROW][C]7[/C][C]0.27483[/C][C]2.1288[/C][C]0.018692[/C][/ROW]
[ROW][C]8[/C][C]0.325197[/C][C]2.519[/C][C]0.007226[/C][/ROW]
[ROW][C]9[/C][C]0.368269[/C][C]2.8526[/C][C]0.00297[/C][/ROW]
[ROW][C]10[/C][C]0.185998[/C][C]1.4407[/C][C]0.077429[/C][/ROW]
[ROW][C]11[/C][C]0.235575[/C][C]1.8248[/C][C]0.036508[/C][/ROW]
[ROW][C]12[/C][C]0.512817[/C][C]3.9723[/C][C]9.7e-05[/C][/ROW]
[ROW][C]13[/C][C]0.191771[/C][C]1.4855[/C][C]0.07133[/C][/ROW]
[ROW][C]14[/C][C]0.101686[/C][C]0.7877[/C][C]0.216999[/C][/ROW]
[ROW][C]15[/C][C]0.183332[/C][C]1.4201[/C][C]0.080379[/C][/ROW]
[ROW][C]16[/C][C]0.094294[/C][C]0.7304[/C][C]0.233994[/C][/ROW]
[ROW][C]17[/C][C]0.05432[/C][C]0.4208[/C][C]0.337717[/C][/ROW]
[ROW][C]18[/C][C]0.189522[/C][C]1.468[/C][C]0.07366[/C][/ROW]
[ROW][C]19[/C][C]0.012929[/C][C]0.1001[/C][C]0.460281[/C][/ROW]
[ROW][C]20[/C][C]0.039665[/C][C]0.3072[/C][C]0.37986[/C][/ROW]
[ROW][C]21[/C][C]0.046824[/C][C]0.3627[/C][C]0.359053[/C][/ROW]
[ROW][C]22[/C][C]-0.076851[/C][C]-0.5953[/C][C]0.276947[/C][/ROW]
[ROW][C]23[/C][C]-0.029117[/C][C]-0.2255[/C][C]0.411163[/C][/ROW]
[ROW][C]24[/C][C]0.118877[/C][C]0.9208[/C][C]0.180416[/C][/ROW]
[ROW][C]25[/C][C]-0.109636[/C][C]-0.8492[/C][C]0.199562[/C][/ROW]
[ROW][C]26[/C][C]-0.184643[/C][C]-1.4302[/C][C]0.078917[/C][/ROW]
[ROW][C]27[/C][C]-0.137574[/C][C]-1.0656[/C][C]0.145427[/C][/ROW]
[ROW][C]28[/C][C]-0.178517[/C][C]-1.3828[/C][C]0.085927[/C][/ROW]
[ROW][C]29[/C][C]-0.193004[/C][C]-1.495[/C][C]0.070077[/C][/ROW]
[ROW][C]30[/C][C]-0.089758[/C][C]-0.6953[/C][C]0.244789[/C][/ROW]
[ROW][C]31[/C][C]-0.169681[/C][C]-1.3143[/C][C]0.096866[/C][/ROW]
[ROW][C]32[/C][C]-0.160572[/C][C]-1.2438[/C][C]0.109208[/C][/ROW]
[ROW][C]33[/C][C]-0.195303[/C][C]-1.5128[/C][C]0.067789[/C][/ROW]
[ROW][C]34[/C][C]-0.295905[/C][C]-2.2921[/C][C]0.012713[/C][/ROW]
[ROW][C]35[/C][C]-0.252159[/C][C]-1.9532[/C][C]0.027731[/C][/ROW]
[ROW][C]36[/C][C]-0.107597[/C][C]-0.8334[/C][C]0.20395[/C][/ROW]
[ROW][C]37[/C][C]-0.224492[/C][C]-1.7389[/C][C]0.04359[/C][/ROW]
[ROW][C]38[/C][C]-0.289366[/C][C]-2.2414[/C][C]0.014355[/C][/ROW]
[ROW][C]39[/C][C]-0.231669[/C][C]-1.7945[/C][C]0.038885[/C][/ROW]
[ROW][C]40[/C][C]-0.221837[/C][C]-1.7183[/C][C]0.045446[/C][/ROW]
[ROW][C]41[/C][C]-0.245848[/C][C]-1.9043[/C][C]0.030832[/C][/ROW]
[ROW][C]42[/C][C]-0.18695[/C][C]-1.4481[/C][C]0.076397[/C][/ROW]
[ROW][C]43[/C][C]-0.211733[/C][C]-1.6401[/C][C]0.053111[/C][/ROW]
[ROW][C]44[/C][C]-0.201388[/C][C]-1.5599[/C][C]0.062016[/C][/ROW]
[ROW][C]45[/C][C]-0.216024[/C][C]-1.6733[/C][C]0.049736[/C][/ROW]
[ROW][C]46[/C][C]-0.264866[/C][C]-2.0516[/C][C]0.022288[/C][/ROW]
[ROW][C]47[/C][C]-0.238915[/C][C]-1.8506[/C][C]0.034574[/C][/ROW]
[ROW][C]48[/C][C]-0.159737[/C][C]-1.2373[/C][C]0.110394[/C][/ROW]
[/TABLE]
Source: https://freestatistics.org/blog/index.php?pk=32676&T=1

Globally Unique Identifier (entire table): ba.freestatistics.org/blog/index.php?pk=32676&T=1

As an alternative you can also use a QR Code:  

The GUIDs for individual cells are displayed in the table below:

Autocorrelation Function
Time lag kACF(k)T-STATP-value
10.5390494.17554.9e-05
20.3859892.98990.002021
30.5300254.10566.2e-05
40.4198933.25250.00094
50.3418552.6480.005165
60.5167814.0038.7e-05
70.274832.12880.018692
80.3251972.5190.007226
90.3682692.85260.00297
100.1859981.44070.077429
110.2355751.82480.036508
120.5128173.97239.7e-05
130.1917711.48550.07133
140.1016860.78770.216999
150.1833321.42010.080379
160.0942940.73040.233994
170.054320.42080.337717
180.1895221.4680.07366
190.0129290.10010.460281
200.0396650.30720.37986
210.0468240.36270.359053
22-0.076851-0.59530.276947
23-0.029117-0.22550.411163
240.1188770.92080.180416
25-0.109636-0.84920.199562
26-0.184643-1.43020.078917
27-0.137574-1.06560.145427
28-0.178517-1.38280.085927
29-0.193004-1.4950.070077
30-0.089758-0.69530.244789
31-0.169681-1.31430.096866
32-0.160572-1.24380.109208
33-0.195303-1.51280.067789
34-0.295905-2.29210.012713
35-0.252159-1.95320.027731
36-0.107597-0.83340.20395
37-0.224492-1.73890.04359
38-0.289366-2.24140.014355
39-0.231669-1.79450.038885
40-0.221837-1.71830.045446
41-0.245848-1.90430.030832
42-0.18695-1.44810.076397
43-0.211733-1.64010.053111
44-0.201388-1.55990.062016
45-0.216024-1.67330.049736
46-0.264866-2.05160.022288
47-0.238915-1.85060.034574
48-0.159737-1.23730.110394


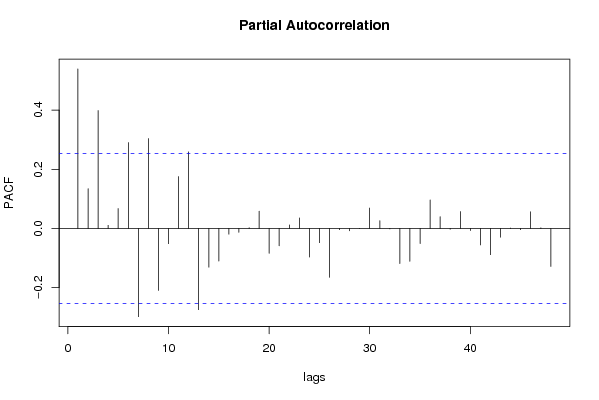
Partial Autocorrelation Function
Time lag kPACF(k)T-STATP-value
10.5390494.17554.9e-05
20.1344961.04180.150842
30.3982853.08510.001538
40.0104370.08080.467917
50.067260.5210.302145
60.2904052.24950.014082
7-0.298164-2.30960.012185
80.3038512.35360.010943
9-0.209728-1.62450.054751
10-0.051481-0.39880.34574
110.1754151.35880.089654
120.2587952.00460.024761
13-0.274836-2.12890.01869
14-0.130804-1.01320.157516
15-0.110151-0.85320.198463
16-0.019648-0.15220.439771
17-0.013064-0.10120.459867
180.0025520.01980.492147
190.0583180.45170.326546
20-0.08419-0.65210.258403
21-0.058627-0.45410.325691
220.0116980.09060.464051
230.035490.27490.392166
24-0.096611-0.74830.228588
25-0.048324-0.37430.354743
26-0.165081-1.27870.102961
27-0.004438-0.03440.486344
28-0.007989-0.06190.475431
290.0002040.00160.499372
300.0689120.53380.29773
310.0263440.20410.4195
32-0.001834-0.01420.494355
33-0.118738-0.91970.180696
34-0.111113-0.86070.196421
35-0.051074-0.39560.346895
360.0961810.7450.229585
370.0398020.30830.37946
38-0.00311-0.02410.490429
390.0572110.44320.329625
40-0.0072-0.05580.477854
41-0.055609-0.43070.334099
42-0.088914-0.68870.246826
43-0.029797-0.23080.409126
440.0013120.01020.495962
45-0.004149-0.03210.487234
460.0560150.43390.332962
470.0021920.0170.493254
48-0.128377-0.99440.16201

\begin{tabular}{lllllllll}
\hline
Partial Autocorrelation Function \tabularnewline
Time lag k & PACF(k) & T-STAT & P-value \tabularnewline
1 & 0.539049 & 4.1755 & 4.9e-05 \tabularnewline
2 & 0.134496 & 1.0418 & 0.150842 \tabularnewline
3 & 0.398285 & 3.0851 & 0.001538 \tabularnewline
4 & 0.010437 & 0.0808 & 0.467917 \tabularnewline
5 & 0.06726 & 0.521 & 0.302145 \tabularnewline
6 & 0.290405 & 2.2495 & 0.014082 \tabularnewline
7 & -0.298164 & -2.3096 & 0.012185 \tabularnewline
8 & 0.303851 & 2.3536 & 0.010943 \tabularnewline
9 & -0.209728 & -1.6245 & 0.054751 \tabularnewline
10 & -0.051481 & -0.3988 & 0.34574 \tabularnewline
11 & 0.175415 & 1.3588 & 0.089654 \tabularnewline
12 & 0.258795 & 2.0046 & 0.024761 \tabularnewline
13 & -0.274836 & -2.1289 & 0.01869 \tabularnewline
14 & -0.130804 & -1.0132 & 0.157516 \tabularnewline
15 & -0.110151 & -0.8532 & 0.198463 \tabularnewline
16 & -0.019648 & -0.1522 & 0.439771 \tabularnewline
17 & -0.013064 & -0.1012 & 0.459867 \tabularnewline
18 & 0.002552 & 0.0198 & 0.492147 \tabularnewline
19 & 0.058318 & 0.4517 & 0.326546 \tabularnewline
20 & -0.08419 & -0.6521 & 0.258403 \tabularnewline
21 & -0.058627 & -0.4541 & 0.325691 \tabularnewline
22 & 0.011698 & 0.0906 & 0.464051 \tabularnewline
23 & 0.03549 & 0.2749 & 0.392166 \tabularnewline
24 & -0.096611 & -0.7483 & 0.228588 \tabularnewline
25 & -0.048324 & -0.3743 & 0.354743 \tabularnewline
26 & -0.165081 & -1.2787 & 0.102961 \tabularnewline
27 & -0.004438 & -0.0344 & 0.486344 \tabularnewline
28 & -0.007989 & -0.0619 & 0.475431 \tabularnewline
29 & 0.000204 & 0.0016 & 0.499372 \tabularnewline
30 & 0.068912 & 0.5338 & 0.29773 \tabularnewline
31 & 0.026344 & 0.2041 & 0.4195 \tabularnewline
32 & -0.001834 & -0.0142 & 0.494355 \tabularnewline
33 & -0.118738 & -0.9197 & 0.180696 \tabularnewline
34 & -0.111113 & -0.8607 & 0.196421 \tabularnewline
35 & -0.051074 & -0.3956 & 0.346895 \tabularnewline
36 & 0.096181 & 0.745 & 0.229585 \tabularnewline
37 & 0.039802 & 0.3083 & 0.37946 \tabularnewline
38 & -0.00311 & -0.0241 & 0.490429 \tabularnewline
39 & 0.057211 & 0.4432 & 0.329625 \tabularnewline
40 & -0.0072 & -0.0558 & 0.477854 \tabularnewline
41 & -0.055609 & -0.4307 & 0.334099 \tabularnewline
42 & -0.088914 & -0.6887 & 0.246826 \tabularnewline
43 & -0.029797 & -0.2308 & 0.409126 \tabularnewline
44 & 0.001312 & 0.0102 & 0.495962 \tabularnewline
45 & -0.004149 & -0.0321 & 0.487234 \tabularnewline
46 & 0.056015 & 0.4339 & 0.332962 \tabularnewline
47 & 0.002192 & 0.017 & 0.493254 \tabularnewline
48 & -0.128377 & -0.9944 & 0.16201 \tabularnewline
\hline
\end{tabular}
%Source: https://freestatistics.org/blog/index.php?pk=32676&T=2

[TABLE]
[ROW][C]Partial Autocorrelation Function[/C][/ROW]
[ROW][C]Time lag k[/C][C]PACF(k)[/C][C]T-STAT[/C][C]P-value[/C][/ROW]
[ROW][C]1[/C][C]0.539049[/C][C]4.1755[/C][C]4.9e-05[/C][/ROW]
[ROW][C]2[/C][C]0.134496[/C][C]1.0418[/C][C]0.150842[/C][/ROW]
[ROW][C]3[/C][C]0.398285[/C][C]3.0851[/C][C]0.001538[/C][/ROW]
[ROW][C]4[/C][C]0.010437[/C][C]0.0808[/C][C]0.467917[/C][/ROW]
[ROW][C]5[/C][C]0.06726[/C][C]0.521[/C][C]0.302145[/C][/ROW]
[ROW][C]6[/C][C]0.290405[/C][C]2.2495[/C][C]0.014082[/C][/ROW]
[ROW][C]7[/C][C]-0.298164[/C][C]-2.3096[/C][C]0.012185[/C][/ROW]
[ROW][C]8[/C][C]0.303851[/C][C]2.3536[/C][C]0.010943[/C][/ROW]
[ROW][C]9[/C][C]-0.209728[/C][C]-1.6245[/C][C]0.054751[/C][/ROW]
[ROW][C]10[/C][C]-0.051481[/C][C]-0.3988[/C][C]0.34574[/C][/ROW]
[ROW][C]11[/C][C]0.175415[/C][C]1.3588[/C][C]0.089654[/C][/ROW]
[ROW][C]12[/C][C]0.258795[/C][C]2.0046[/C][C]0.024761[/C][/ROW]
[ROW][C]13[/C][C]-0.274836[/C][C]-2.1289[/C][C]0.01869[/C][/ROW]
[ROW][C]14[/C][C]-0.130804[/C][C]-1.0132[/C][C]0.157516[/C][/ROW]
[ROW][C]15[/C][C]-0.110151[/C][C]-0.8532[/C][C]0.198463[/C][/ROW]
[ROW][C]16[/C][C]-0.019648[/C][C]-0.1522[/C][C]0.439771[/C][/ROW]
[ROW][C]17[/C][C]-0.013064[/C][C]-0.1012[/C][C]0.459867[/C][/ROW]
[ROW][C]18[/C][C]0.002552[/C][C]0.0198[/C][C]0.492147[/C][/ROW]
[ROW][C]19[/C][C]0.058318[/C][C]0.4517[/C][C]0.326546[/C][/ROW]
[ROW][C]20[/C][C]-0.08419[/C][C]-0.6521[/C][C]0.258403[/C][/ROW]
[ROW][C]21[/C][C]-0.058627[/C][C]-0.4541[/C][C]0.325691[/C][/ROW]
[ROW][C]22[/C][C]0.011698[/C][C]0.0906[/C][C]0.464051[/C][/ROW]
[ROW][C]23[/C][C]0.03549[/C][C]0.2749[/C][C]0.392166[/C][/ROW]
[ROW][C]24[/C][C]-0.096611[/C][C]-0.7483[/C][C]0.228588[/C][/ROW]
[ROW][C]25[/C][C]-0.048324[/C][C]-0.3743[/C][C]0.354743[/C][/ROW]
[ROW][C]26[/C][C]-0.165081[/C][C]-1.2787[/C][C]0.102961[/C][/ROW]
[ROW][C]27[/C][C]-0.004438[/C][C]-0.0344[/C][C]0.486344[/C][/ROW]
[ROW][C]28[/C][C]-0.007989[/C][C]-0.0619[/C][C]0.475431[/C][/ROW]
[ROW][C]29[/C][C]0.000204[/C][C]0.0016[/C][C]0.499372[/C][/ROW]
[ROW][C]30[/C][C]0.068912[/C][C]0.5338[/C][C]0.29773[/C][/ROW]
[ROW][C]31[/C][C]0.026344[/C][C]0.2041[/C][C]0.4195[/C][/ROW]
[ROW][C]32[/C][C]-0.001834[/C][C]-0.0142[/C][C]0.494355[/C][/ROW]
[ROW][C]33[/C][C]-0.118738[/C][C]-0.9197[/C][C]0.180696[/C][/ROW]
[ROW][C]34[/C][C]-0.111113[/C][C]-0.8607[/C][C]0.196421[/C][/ROW]
[ROW][C]35[/C][C]-0.051074[/C][C]-0.3956[/C][C]0.346895[/C][/ROW]
[ROW][C]36[/C][C]0.096181[/C][C]0.745[/C][C]0.229585[/C][/ROW]
[ROW][C]37[/C][C]0.039802[/C][C]0.3083[/C][C]0.37946[/C][/ROW]
[ROW][C]38[/C][C]-0.00311[/C][C]-0.0241[/C][C]0.490429[/C][/ROW]
[ROW][C]39[/C][C]0.057211[/C][C]0.4432[/C][C]0.329625[/C][/ROW]
[ROW][C]40[/C][C]-0.0072[/C][C]-0.0558[/C][C]0.477854[/C][/ROW]
[ROW][C]41[/C][C]-0.055609[/C][C]-0.4307[/C][C]0.334099[/C][/ROW]
[ROW][C]42[/C][C]-0.088914[/C][C]-0.6887[/C][C]0.246826[/C][/ROW]
[ROW][C]43[/C][C]-0.029797[/C][C]-0.2308[/C][C]0.409126[/C][/ROW]
[ROW][C]44[/C][C]0.001312[/C][C]0.0102[/C][C]0.495962[/C][/ROW]
[ROW][C]45[/C][C]-0.004149[/C][C]-0.0321[/C][C]0.487234[/C][/ROW]
[ROW][C]46[/C][C]0.056015[/C][C]0.4339[/C][C]0.332962[/C][/ROW]
[ROW][C]47[/C][C]0.002192[/C][C]0.017[/C][C]0.493254[/C][/ROW]
[ROW][C]48[/C][C]-0.128377[/C][C]-0.9944[/C][C]0.16201[/C][/ROW]
[/TABLE]
Source: https://freestatistics.org/blog/index.php?pk=32676&T=2

Globally Unique Identifier (entire table): ba.freestatistics.org/blog/index.php?pk=32676&T=2

As an alternative you can also use a QR Code:  

The GUIDs for individual cells are displayed in the table below:

Partial Autocorrelation Function
Time lag kPACF(k)T-STATP-value
10.5390494.17554.9e-05
20.1344961.04180.150842
30.3982853.08510.001538
40.0104370.08080.467917
50.067260.5210.302145
60.2904052.24950.014082
7-0.298164-2.30960.012185
80.3038512.35360.010943
9-0.209728-1.62450.054751
10-0.051481-0.39880.34574
110.1754151.35880.089654
120.2587952.00460.024761
13-0.274836-2.12890.01869
14-0.130804-1.01320.157516
15-0.110151-0.85320.198463
16-0.019648-0.15220.439771
17-0.013064-0.10120.459867
180.0025520.01980.492147
190.0583180.45170.326546
20-0.08419-0.65210.258403
21-0.058627-0.45410.325691
220.0116980.09060.464051
230.035490.27490.392166
24-0.096611-0.74830.228588
25-0.048324-0.37430.354743
26-0.165081-1.27870.102961
27-0.004438-0.03440.486344
28-0.007989-0.06190.475431
290.0002040.00160.499372
300.0689120.53380.29773
310.0263440.20410.4195
32-0.001834-0.01420.494355
33-0.118738-0.91970.180696
34-0.111113-0.86070.196421
35-0.051074-0.39560.346895
360.0961810.7450.229585
370.0398020.30830.37946
38-0.00311-0.02410.490429
390.0572110.44320.329625
40-0.0072-0.05580.477854
41-0.055609-0.43070.334099
42-0.088914-0.68870.246826
43-0.029797-0.23080.409126
440.0013120.01020.495962
45-0.004149-0.03210.487234
460.0560150.43390.332962
470.0021920.0170.493254
48-0.128377-0.99440.16201


Parameters (Session):
par1 = 12 ;
Parameters (R input):
par1 = 48 ; par2 = 1 ; par3 = 0 ; par4 = 0 ; par5 = 12 ;
R code (references can be found in the software module):
if (par1 == 'Default') {
par1 = 10*log10(length(x))
} else {
par1 <- as.numeric(par1)
}
par2 <- as.numeric(par2)
par3 <- as.numeric(par3)
par4 <- as.numeric(par4)
par5 <- as.numeric(par5)
if (par2 == 0) {
x <- log(x)
} else {
x <- (x ^ par2 - 1) / par2
}
if (par3 > 0) x <- diff(x,lag=1,difference=par3)
if (par4 > 0) x <- diff(x,lag=par5,difference=par4)
bitmap(file='pic1.png')
racf <- acf(x,par1,main='Autocorrelation',xlab='lags',ylab='ACF')
dev.off()
bitmap(file='pic2.png')
rpacf <- pacf(x,par1,main='Partial Autocorrelation',xlab='lags',ylab='PACF')
dev.off()
(myacf <- c(racf$acf))
(mypacf <- c(rpacf$acf))
lengthx <- length(x)
sqrtn <- sqrt(lengthx)
load(file='createtable')
a<-table.start()
a<-table.row.start(a)
a<-table.element(a,'Autocorrelation Function',4,TRUE)
a<-table.row.end(a)
a<-table.row.start(a)
a<-table.element(a,'Time lag k',header=TRUE)
a<-table.element(a,hyperlink('basics.htm','ACF(k)','click here for more information about the Autocorrelation Function'),header=TRUE)
a<-table.element(a,'T-STAT',header=TRUE)
a<-table.element(a,'P-value',header=TRUE)
a<-table.row.end(a)
for (i in 2:(par1+1)) {
a<-table.row.start(a)
a<-table.element(a,i-1,header=TRUE)
a<-table.element(a,round(myacf[i],6))
mytstat <- myacf[i]*sqrtn
a<-table.element(a,round(mytstat,4))
a<-table.element(a,round(1-pt(abs(mytstat),lengthx),6))
a<-table.row.end(a)
}
a<-table.end(a)
table.save(a,file='mytable.tab')
a<-table.start()
a<-table.row.start(a)
a<-table.element(a,'Partial Autocorrelation Function',4,TRUE)
a<-table.row.end(a)
a<-table.row.start(a)
a<-table.element(a,'Time lag k',header=TRUE)
a<-table.element(a,hyperlink('basics.htm','PACF(k)','click here for more information about the Partial Autocorrelation Function'),header=TRUE)
a<-table.element(a,'T-STAT',header=TRUE)
a<-table.element(a,'P-value',header=TRUE)
a<-table.row.end(a)
for (i in 1:par1) {
a<-table.row.start(a)
a<-table.element(a,i,header=TRUE)
a<-table.element(a,round(mypacf[i],6))
mytstat <- mypacf[i]*sqrtn
a<-table.element(a,round(mytstat,4))
a<-table.element(a,round(1-pt(abs(mytstat),lengthx),6))
a<-table.row.end(a)
}
a<-table.end(a)
table.save(a,file='mytable1.tab')