Free Statistics

of Irreproducible Research!

Author's title

Author*The author of this computation has been verified*
R Software Modulerwasp_autocorrelation.wasp
Title produced by software(Partial) Autocorrelation Function
Date of computationFri, 12 Dec 2008 06:10:17 -0700
Cite this page as followsStatistical Computations at FreeStatistics.org, Office for Research Development and Education, URL https://freestatistics.org/blog/index.php?v=date/2008/Dec/12/t1229087446fb58955wdpm5xpn.htm/, Retrieved Fri, 17 May 2024 13:59:44 +0000
Statistical Computations at FreeStatistics.org, Office for Research Development and Education, URL https://freestatistics.org/blog/index.php?pk=32670, Retrieved Fri, 17 May 2024 13:59:44 +0000
QR Codes:

Original text written by user:
IsPrivate?No (this computation is public)
User-defined keywords
Estimated Impact173
Family? (F = Feedback message, R = changed R code, M = changed R Module, P = changed Parameters, D = changed Data)
-     [Univariate Data Series] [Uitvoer.Nederland] [2008-12-03 15:11:10] [988ab43f527fc78aae41c84649095267]
-   P   [Univariate Data Series] [Export From Belgi...] [2008-12-03 15:52:29] [988ab43f527fc78aae41c84649095267]
- RMP     [(Partial) Autocorrelation Function] [Partial Autocorre...] [2008-12-03 16:01:07] [988ab43f527fc78aae41c84649095267]
-    D      [(Partial) Autocorrelation Function] [Partial Autocorre...] [2008-12-11 17:24:10] [988ab43f527fc78aae41c84649095267]
-   PD          [(Partial) Autocorrelation Function] [Partial Autocorre...] [2008-12-12 13:10:17] [5d823194959040fa9b19b8c8302177e6] [Current]
Feedback Forum

Post a new message
Dataseries X:
156.3
151.5
159.1
166.9
160.5
162.8
178.9
148.5
184.1
197
186.8
139.2
162.7
187.5
235.8
219.4
212.4
220.2
197.5
185.6
232.4
223.8
219.4
191.4
210.4
212.6
274.4
256
227.6
261.7
237
234.9
310.6
274.2
288.1
242.5
271.7
282.2
317.4
280.3
322.6
328.2
280.7
288.8
347.9
360.1
348
275.7
332.6
340.8
390.5
351.2
377.4
413.5
366.9
364.8
388
429.8
423.6
326.4


Summary of computational transaction
Raw Inputview raw input (R code)
Raw Outputview raw output of R engine
Computing time1 seconds
R Server'George Udny Yule' @ 72.249.76.132

\begin{tabular}{lllllllll}
\hline
Summary of computational transaction \tabularnewline
Raw Input & view raw input (R code)  \tabularnewline
Raw Output & view raw output of R engine  \tabularnewline
Computing time & 1 seconds \tabularnewline
R Server & 'George Udny Yule' @ 72.249.76.132 \tabularnewline
\hline
\end{tabular}
%Source: https://freestatistics.org/blog/index.php?pk=32670&T=0

[TABLE]
[ROW][C]Summary of computational transaction[/C][/ROW]
[ROW][C]Raw Input[/C][C]view raw input (R code) [/C][/ROW]
[ROW][C]Raw Output[/C][C]view raw output of R engine [/C][/ROW]
[ROW][C]Computing time[/C][C]1 seconds[/C][/ROW]
[ROW][C]R Server[/C][C]'George Udny Yule' @ 72.249.76.132[/C][/ROW]
[/TABLE]
Source: https://freestatistics.org/blog/index.php?pk=32670&T=0

Globally Unique Identifier (entire table): ba.freestatistics.org/blog/index.php?pk=32670&T=0

As an alternative you can also use a QR Code:  

The GUIDs for individual cells are displayed in the table below:

Summary of computational transaction
Raw Inputview raw input (R code)
Raw Outputview raw output of R engine
Computing time1 seconds
R Server'George Udny Yule' @ 72.249.76.132


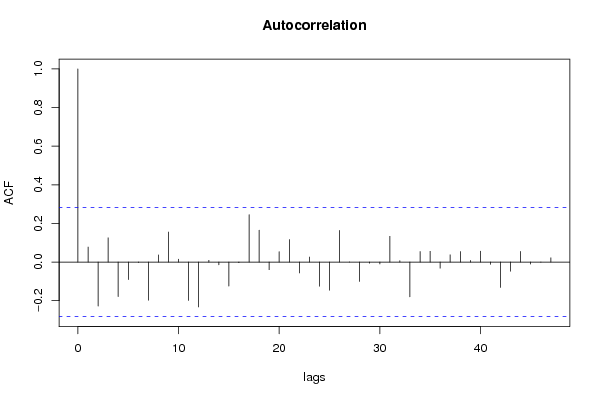
Autocorrelation Function
Time lag kACF(k)T-STATP-value
10.0778130.53910.296153
2-0.228145-1.58060.060265
30.1252010.86740.195015
4-0.17908-1.24070.110372
5-0.090633-0.62790.266516
6-0.001891-0.01310.4948
7-0.197544-1.36860.088744
80.0366380.25380.400353
90.1551261.07470.143932
100.0148830.10310.459153
11-0.199124-1.37960.087056
12-0.232657-1.61190.056771
130.0087560.06070.47594
14-0.01431-0.09910.460719
15-0.124513-0.86270.196309
16-0.003723-0.02580.489765
170.2451241.69830.047966
180.1651891.14450.129053
19-0.039841-0.2760.391857
200.0532850.36920.356812
210.1163870.80640.212008
22-0.056513-0.39150.348569
230.0260270.18030.428831
24-0.125406-0.86880.194629
25-0.14567-1.00920.158962
260.163931.13570.130852
270.0001249e-040.49966
28-0.100463-0.6960.244883
29-0.006079-0.04210.48329
30-0.010211-0.07070.471948
310.1330780.9220.180572
320.0070030.04850.480753
33-0.180323-1.24930.108804
340.0545070.37760.353683
350.0557130.3860.350605
36-0.031865-0.22080.413105
370.0371220.25720.399067
380.0542980.37620.354219
390.0080270.05560.477941
400.055890.38720.350154
41-0.011903-0.08250.467309
42-0.131869-0.91360.182742
43-0.047509-0.32920.371735
440.054590.37820.35347
45-0.010844-0.07510.470212
46-0.000739-0.00510.497968
470.0221450.15340.439352
48NANANA

\begin{tabular}{lllllllll}
\hline
Autocorrelation Function \tabularnewline
Time lag k & ACF(k) & T-STAT & P-value \tabularnewline
1 & 0.077813 & 0.5391 & 0.296153 \tabularnewline
2 & -0.228145 & -1.5806 & 0.060265 \tabularnewline
3 & 0.125201 & 0.8674 & 0.195015 \tabularnewline
4 & -0.17908 & -1.2407 & 0.110372 \tabularnewline
5 & -0.090633 & -0.6279 & 0.266516 \tabularnewline
6 & -0.001891 & -0.0131 & 0.4948 \tabularnewline
7 & -0.197544 & -1.3686 & 0.088744 \tabularnewline
8 & 0.036638 & 0.2538 & 0.400353 \tabularnewline
9 & 0.155126 & 1.0747 & 0.143932 \tabularnewline
10 & 0.014883 & 0.1031 & 0.459153 \tabularnewline
11 & -0.199124 & -1.3796 & 0.087056 \tabularnewline
12 & -0.232657 & -1.6119 & 0.056771 \tabularnewline
13 & 0.008756 & 0.0607 & 0.47594 \tabularnewline
14 & -0.01431 & -0.0991 & 0.460719 \tabularnewline
15 & -0.124513 & -0.8627 & 0.196309 \tabularnewline
16 & -0.003723 & -0.0258 & 0.489765 \tabularnewline
17 & 0.245124 & 1.6983 & 0.047966 \tabularnewline
18 & 0.165189 & 1.1445 & 0.129053 \tabularnewline
19 & -0.039841 & -0.276 & 0.391857 \tabularnewline
20 & 0.053285 & 0.3692 & 0.356812 \tabularnewline
21 & 0.116387 & 0.8064 & 0.212008 \tabularnewline
22 & -0.056513 & -0.3915 & 0.348569 \tabularnewline
23 & 0.026027 & 0.1803 & 0.428831 \tabularnewline
24 & -0.125406 & -0.8688 & 0.194629 \tabularnewline
25 & -0.14567 & -1.0092 & 0.158962 \tabularnewline
26 & 0.16393 & 1.1357 & 0.130852 \tabularnewline
27 & 0.000124 & 9e-04 & 0.49966 \tabularnewline
28 & -0.100463 & -0.696 & 0.244883 \tabularnewline
29 & -0.006079 & -0.0421 & 0.48329 \tabularnewline
30 & -0.010211 & -0.0707 & 0.471948 \tabularnewline
31 & 0.133078 & 0.922 & 0.180572 \tabularnewline
32 & 0.007003 & 0.0485 & 0.480753 \tabularnewline
33 & -0.180323 & -1.2493 & 0.108804 \tabularnewline
34 & 0.054507 & 0.3776 & 0.353683 \tabularnewline
35 & 0.055713 & 0.386 & 0.350605 \tabularnewline
36 & -0.031865 & -0.2208 & 0.413105 \tabularnewline
37 & 0.037122 & 0.2572 & 0.399067 \tabularnewline
38 & 0.054298 & 0.3762 & 0.354219 \tabularnewline
39 & 0.008027 & 0.0556 & 0.477941 \tabularnewline
40 & 0.05589 & 0.3872 & 0.350154 \tabularnewline
41 & -0.011903 & -0.0825 & 0.467309 \tabularnewline
42 & -0.131869 & -0.9136 & 0.182742 \tabularnewline
43 & -0.047509 & -0.3292 & 0.371735 \tabularnewline
44 & 0.05459 & 0.3782 & 0.35347 \tabularnewline
45 & -0.010844 & -0.0751 & 0.470212 \tabularnewline
46 & -0.000739 & -0.0051 & 0.497968 \tabularnewline
47 & 0.022145 & 0.1534 & 0.439352 \tabularnewline
48 & NA & NA & NA \tabularnewline
\hline
\end{tabular}
%Source: https://freestatistics.org/blog/index.php?pk=32670&T=1

[TABLE]
[ROW][C]Autocorrelation Function[/C][/ROW]
[ROW][C]Time lag k[/C][C]ACF(k)[/C][C]T-STAT[/C][C]P-value[/C][/ROW]
[ROW][C]1[/C][C]0.077813[/C][C]0.5391[/C][C]0.296153[/C][/ROW]
[ROW][C]2[/C][C]-0.228145[/C][C]-1.5806[/C][C]0.060265[/C][/ROW]
[ROW][C]3[/C][C]0.125201[/C][C]0.8674[/C][C]0.195015[/C][/ROW]
[ROW][C]4[/C][C]-0.17908[/C][C]-1.2407[/C][C]0.110372[/C][/ROW]
[ROW][C]5[/C][C]-0.090633[/C][C]-0.6279[/C][C]0.266516[/C][/ROW]
[ROW][C]6[/C][C]-0.001891[/C][C]-0.0131[/C][C]0.4948[/C][/ROW]
[ROW][C]7[/C][C]-0.197544[/C][C]-1.3686[/C][C]0.088744[/C][/ROW]
[ROW][C]8[/C][C]0.036638[/C][C]0.2538[/C][C]0.400353[/C][/ROW]
[ROW][C]9[/C][C]0.155126[/C][C]1.0747[/C][C]0.143932[/C][/ROW]
[ROW][C]10[/C][C]0.014883[/C][C]0.1031[/C][C]0.459153[/C][/ROW]
[ROW][C]11[/C][C]-0.199124[/C][C]-1.3796[/C][C]0.087056[/C][/ROW]
[ROW][C]12[/C][C]-0.232657[/C][C]-1.6119[/C][C]0.056771[/C][/ROW]
[ROW][C]13[/C][C]0.008756[/C][C]0.0607[/C][C]0.47594[/C][/ROW]
[ROW][C]14[/C][C]-0.01431[/C][C]-0.0991[/C][C]0.460719[/C][/ROW]
[ROW][C]15[/C][C]-0.124513[/C][C]-0.8627[/C][C]0.196309[/C][/ROW]
[ROW][C]16[/C][C]-0.003723[/C][C]-0.0258[/C][C]0.489765[/C][/ROW]
[ROW][C]17[/C][C]0.245124[/C][C]1.6983[/C][C]0.047966[/C][/ROW]
[ROW][C]18[/C][C]0.165189[/C][C]1.1445[/C][C]0.129053[/C][/ROW]
[ROW][C]19[/C][C]-0.039841[/C][C]-0.276[/C][C]0.391857[/C][/ROW]
[ROW][C]20[/C][C]0.053285[/C][C]0.3692[/C][C]0.356812[/C][/ROW]
[ROW][C]21[/C][C]0.116387[/C][C]0.8064[/C][C]0.212008[/C][/ROW]
[ROW][C]22[/C][C]-0.056513[/C][C]-0.3915[/C][C]0.348569[/C][/ROW]
[ROW][C]23[/C][C]0.026027[/C][C]0.1803[/C][C]0.428831[/C][/ROW]
[ROW][C]24[/C][C]-0.125406[/C][C]-0.8688[/C][C]0.194629[/C][/ROW]
[ROW][C]25[/C][C]-0.14567[/C][C]-1.0092[/C][C]0.158962[/C][/ROW]
[ROW][C]26[/C][C]0.16393[/C][C]1.1357[/C][C]0.130852[/C][/ROW]
[ROW][C]27[/C][C]0.000124[/C][C]9e-04[/C][C]0.49966[/C][/ROW]
[ROW][C]28[/C][C]-0.100463[/C][C]-0.696[/C][C]0.244883[/C][/ROW]
[ROW][C]29[/C][C]-0.006079[/C][C]-0.0421[/C][C]0.48329[/C][/ROW]
[ROW][C]30[/C][C]-0.010211[/C][C]-0.0707[/C][C]0.471948[/C][/ROW]
[ROW][C]31[/C][C]0.133078[/C][C]0.922[/C][C]0.180572[/C][/ROW]
[ROW][C]32[/C][C]0.007003[/C][C]0.0485[/C][C]0.480753[/C][/ROW]
[ROW][C]33[/C][C]-0.180323[/C][C]-1.2493[/C][C]0.108804[/C][/ROW]
[ROW][C]34[/C][C]0.054507[/C][C]0.3776[/C][C]0.353683[/C][/ROW]
[ROW][C]35[/C][C]0.055713[/C][C]0.386[/C][C]0.350605[/C][/ROW]
[ROW][C]36[/C][C]-0.031865[/C][C]-0.2208[/C][C]0.413105[/C][/ROW]
[ROW][C]37[/C][C]0.037122[/C][C]0.2572[/C][C]0.399067[/C][/ROW]
[ROW][C]38[/C][C]0.054298[/C][C]0.3762[/C][C]0.354219[/C][/ROW]
[ROW][C]39[/C][C]0.008027[/C][C]0.0556[/C][C]0.477941[/C][/ROW]
[ROW][C]40[/C][C]0.05589[/C][C]0.3872[/C][C]0.350154[/C][/ROW]
[ROW][C]41[/C][C]-0.011903[/C][C]-0.0825[/C][C]0.467309[/C][/ROW]
[ROW][C]42[/C][C]-0.131869[/C][C]-0.9136[/C][C]0.182742[/C][/ROW]
[ROW][C]43[/C][C]-0.047509[/C][C]-0.3292[/C][C]0.371735[/C][/ROW]
[ROW][C]44[/C][C]0.05459[/C][C]0.3782[/C][C]0.35347[/C][/ROW]
[ROW][C]45[/C][C]-0.010844[/C][C]-0.0751[/C][C]0.470212[/C][/ROW]
[ROW][C]46[/C][C]-0.000739[/C][C]-0.0051[/C][C]0.497968[/C][/ROW]
[ROW][C]47[/C][C]0.022145[/C][C]0.1534[/C][C]0.439352[/C][/ROW]
[ROW][C]48[/C][C]NA[/C][C]NA[/C][C]NA[/C][/ROW]
[/TABLE]
Source: https://freestatistics.org/blog/index.php?pk=32670&T=1

Globally Unique Identifier (entire table): ba.freestatistics.org/blog/index.php?pk=32670&T=1

As an alternative you can also use a QR Code:  

The GUIDs for individual cells are displayed in the table below:

Autocorrelation Function
Time lag kACF(k)T-STATP-value
10.0778130.53910.296153
2-0.228145-1.58060.060265
30.1252010.86740.195015
4-0.17908-1.24070.110372
5-0.090633-0.62790.266516
6-0.001891-0.01310.4948
7-0.197544-1.36860.088744
80.0366380.25380.400353
90.1551261.07470.143932
100.0148830.10310.459153
11-0.199124-1.37960.087056
12-0.232657-1.61190.056771
130.0087560.06070.47594
14-0.01431-0.09910.460719
15-0.124513-0.86270.196309
16-0.003723-0.02580.489765
170.2451241.69830.047966
180.1651891.14450.129053
19-0.039841-0.2760.391857
200.0532850.36920.356812
210.1163870.80640.212008
22-0.056513-0.39150.348569
230.0260270.18030.428831
24-0.125406-0.86880.194629
25-0.14567-1.00920.158962
260.163931.13570.130852
270.0001249e-040.49966
28-0.100463-0.6960.244883
29-0.006079-0.04210.48329
30-0.010211-0.07070.471948
310.1330780.9220.180572
320.0070030.04850.480753
33-0.180323-1.24930.108804
340.0545070.37760.353683
350.0557130.3860.350605
36-0.031865-0.22080.413105
370.0371220.25720.399067
380.0542980.37620.354219
390.0080270.05560.477941
400.055890.38720.350154
41-0.011903-0.08250.467309
42-0.131869-0.91360.182742
43-0.047509-0.32920.371735
440.054590.37820.35347
45-0.010844-0.07510.470212
46-0.000739-0.00510.497968
470.0221450.15340.439352
48NANANA


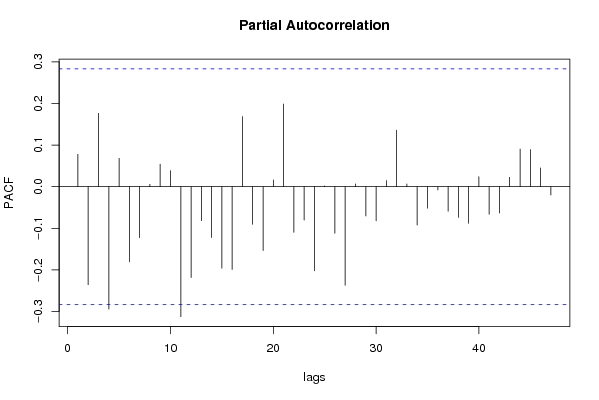
Partial Autocorrelation Function
Time lag kPACF(k)T-STATP-value
10.0778130.53910.296153
2-0.235627-1.63250.054562
30.1762661.22120.113986
4-0.29426-2.03870.023504
50.0681170.47190.319557
6-0.180645-1.25150.1084
7-0.122697-0.85010.199754
80.0055370.03840.48478
90.0541530.37520.35459
100.0383880.2660.395704
11-0.31239-2.16430.017723
12-0.218313-1.51250.06848
13-0.081893-0.56740.286553
14-0.122275-0.84710.20056
15-0.195897-1.35720.09053
16-0.198875-1.37780.08732
170.168341.16630.124629
18-0.090469-0.62680.266884
19-0.153591-1.06410.146301
200.0161030.11160.455816
210.1986251.37610.087587
22-0.109737-0.76030.225402
23-0.080374-0.55690.290108
24-0.202301-1.40160.083736
250.0018170.01260.495003
26-0.112131-0.77690.220524
27-0.236961-1.64170.053593
280.0065640.04550.481959
29-0.070427-0.48790.313909
30-0.082138-0.56910.285982
310.0147150.10190.459612
320.1358460.94120.175665
330.0066020.04570.481855
34-0.092346-0.63980.262676
35-0.051871-0.35940.360445
36-0.007833-0.05430.478474
37-0.058995-0.40870.342277
38-0.074076-0.51320.305078
39-0.088137-0.61060.272162
400.0241140.16710.434009
41-0.06645-0.46040.323662
42-0.063356-0.43890.331335
430.0223430.15480.438816
440.0902790.62550.267311
450.0890540.6170.270082
460.0450470.31210.378161
47-0.020246-0.14030.444517
48NANANA

\begin{tabular}{lllllllll}
\hline
Partial Autocorrelation Function \tabularnewline
Time lag k & PACF(k) & T-STAT & P-value \tabularnewline
1 & 0.077813 & 0.5391 & 0.296153 \tabularnewline
2 & -0.235627 & -1.6325 & 0.054562 \tabularnewline
3 & 0.176266 & 1.2212 & 0.113986 \tabularnewline
4 & -0.29426 & -2.0387 & 0.023504 \tabularnewline
5 & 0.068117 & 0.4719 & 0.319557 \tabularnewline
6 & -0.180645 & -1.2515 & 0.1084 \tabularnewline
7 & -0.122697 & -0.8501 & 0.199754 \tabularnewline
8 & 0.005537 & 0.0384 & 0.48478 \tabularnewline
9 & 0.054153 & 0.3752 & 0.35459 \tabularnewline
10 & 0.038388 & 0.266 & 0.395704 \tabularnewline
11 & -0.31239 & -2.1643 & 0.017723 \tabularnewline
12 & -0.218313 & -1.5125 & 0.06848 \tabularnewline
13 & -0.081893 & -0.5674 & 0.286553 \tabularnewline
14 & -0.122275 & -0.8471 & 0.20056 \tabularnewline
15 & -0.195897 & -1.3572 & 0.09053 \tabularnewline
16 & -0.198875 & -1.3778 & 0.08732 \tabularnewline
17 & 0.16834 & 1.1663 & 0.124629 \tabularnewline
18 & -0.090469 & -0.6268 & 0.266884 \tabularnewline
19 & -0.153591 & -1.0641 & 0.146301 \tabularnewline
20 & 0.016103 & 0.1116 & 0.455816 \tabularnewline
21 & 0.198625 & 1.3761 & 0.087587 \tabularnewline
22 & -0.109737 & -0.7603 & 0.225402 \tabularnewline
23 & -0.080374 & -0.5569 & 0.290108 \tabularnewline
24 & -0.202301 & -1.4016 & 0.083736 \tabularnewline
25 & 0.001817 & 0.0126 & 0.495003 \tabularnewline
26 & -0.112131 & -0.7769 & 0.220524 \tabularnewline
27 & -0.236961 & -1.6417 & 0.053593 \tabularnewline
28 & 0.006564 & 0.0455 & 0.481959 \tabularnewline
29 & -0.070427 & -0.4879 & 0.313909 \tabularnewline
30 & -0.082138 & -0.5691 & 0.285982 \tabularnewline
31 & 0.014715 & 0.1019 & 0.459612 \tabularnewline
32 & 0.135846 & 0.9412 & 0.175665 \tabularnewline
33 & 0.006602 & 0.0457 & 0.481855 \tabularnewline
34 & -0.092346 & -0.6398 & 0.262676 \tabularnewline
35 & -0.051871 & -0.3594 & 0.360445 \tabularnewline
36 & -0.007833 & -0.0543 & 0.478474 \tabularnewline
37 & -0.058995 & -0.4087 & 0.342277 \tabularnewline
38 & -0.074076 & -0.5132 & 0.305078 \tabularnewline
39 & -0.088137 & -0.6106 & 0.272162 \tabularnewline
40 & 0.024114 & 0.1671 & 0.434009 \tabularnewline
41 & -0.06645 & -0.4604 & 0.323662 \tabularnewline
42 & -0.063356 & -0.4389 & 0.331335 \tabularnewline
43 & 0.022343 & 0.1548 & 0.438816 \tabularnewline
44 & 0.090279 & 0.6255 & 0.267311 \tabularnewline
45 & 0.089054 & 0.617 & 0.270082 \tabularnewline
46 & 0.045047 & 0.3121 & 0.378161 \tabularnewline
47 & -0.020246 & -0.1403 & 0.444517 \tabularnewline
48 & NA & NA & NA \tabularnewline
\hline
\end{tabular}
%Source: https://freestatistics.org/blog/index.php?pk=32670&T=2

[TABLE]
[ROW][C]Partial Autocorrelation Function[/C][/ROW]
[ROW][C]Time lag k[/C][C]PACF(k)[/C][C]T-STAT[/C][C]P-value[/C][/ROW]
[ROW][C]1[/C][C]0.077813[/C][C]0.5391[/C][C]0.296153[/C][/ROW]
[ROW][C]2[/C][C]-0.235627[/C][C]-1.6325[/C][C]0.054562[/C][/ROW]
[ROW][C]3[/C][C]0.176266[/C][C]1.2212[/C][C]0.113986[/C][/ROW]
[ROW][C]4[/C][C]-0.29426[/C][C]-2.0387[/C][C]0.023504[/C][/ROW]
[ROW][C]5[/C][C]0.068117[/C][C]0.4719[/C][C]0.319557[/C][/ROW]
[ROW][C]6[/C][C]-0.180645[/C][C]-1.2515[/C][C]0.1084[/C][/ROW]
[ROW][C]7[/C][C]-0.122697[/C][C]-0.8501[/C][C]0.199754[/C][/ROW]
[ROW][C]8[/C][C]0.005537[/C][C]0.0384[/C][C]0.48478[/C][/ROW]
[ROW][C]9[/C][C]0.054153[/C][C]0.3752[/C][C]0.35459[/C][/ROW]
[ROW][C]10[/C][C]0.038388[/C][C]0.266[/C][C]0.395704[/C][/ROW]
[ROW][C]11[/C][C]-0.31239[/C][C]-2.1643[/C][C]0.017723[/C][/ROW]
[ROW][C]12[/C][C]-0.218313[/C][C]-1.5125[/C][C]0.06848[/C][/ROW]
[ROW][C]13[/C][C]-0.081893[/C][C]-0.5674[/C][C]0.286553[/C][/ROW]
[ROW][C]14[/C][C]-0.122275[/C][C]-0.8471[/C][C]0.20056[/C][/ROW]
[ROW][C]15[/C][C]-0.195897[/C][C]-1.3572[/C][C]0.09053[/C][/ROW]
[ROW][C]16[/C][C]-0.198875[/C][C]-1.3778[/C][C]0.08732[/C][/ROW]
[ROW][C]17[/C][C]0.16834[/C][C]1.1663[/C][C]0.124629[/C][/ROW]
[ROW][C]18[/C][C]-0.090469[/C][C]-0.6268[/C][C]0.266884[/C][/ROW]
[ROW][C]19[/C][C]-0.153591[/C][C]-1.0641[/C][C]0.146301[/C][/ROW]
[ROW][C]20[/C][C]0.016103[/C][C]0.1116[/C][C]0.455816[/C][/ROW]
[ROW][C]21[/C][C]0.198625[/C][C]1.3761[/C][C]0.087587[/C][/ROW]
[ROW][C]22[/C][C]-0.109737[/C][C]-0.7603[/C][C]0.225402[/C][/ROW]
[ROW][C]23[/C][C]-0.080374[/C][C]-0.5569[/C][C]0.290108[/C][/ROW]
[ROW][C]24[/C][C]-0.202301[/C][C]-1.4016[/C][C]0.083736[/C][/ROW]
[ROW][C]25[/C][C]0.001817[/C][C]0.0126[/C][C]0.495003[/C][/ROW]
[ROW][C]26[/C][C]-0.112131[/C][C]-0.7769[/C][C]0.220524[/C][/ROW]
[ROW][C]27[/C][C]-0.236961[/C][C]-1.6417[/C][C]0.053593[/C][/ROW]
[ROW][C]28[/C][C]0.006564[/C][C]0.0455[/C][C]0.481959[/C][/ROW]
[ROW][C]29[/C][C]-0.070427[/C][C]-0.4879[/C][C]0.313909[/C][/ROW]
[ROW][C]30[/C][C]-0.082138[/C][C]-0.5691[/C][C]0.285982[/C][/ROW]
[ROW][C]31[/C][C]0.014715[/C][C]0.1019[/C][C]0.459612[/C][/ROW]
[ROW][C]32[/C][C]0.135846[/C][C]0.9412[/C][C]0.175665[/C][/ROW]
[ROW][C]33[/C][C]0.006602[/C][C]0.0457[/C][C]0.481855[/C][/ROW]
[ROW][C]34[/C][C]-0.092346[/C][C]-0.6398[/C][C]0.262676[/C][/ROW]
[ROW][C]35[/C][C]-0.051871[/C][C]-0.3594[/C][C]0.360445[/C][/ROW]
[ROW][C]36[/C][C]-0.007833[/C][C]-0.0543[/C][C]0.478474[/C][/ROW]
[ROW][C]37[/C][C]-0.058995[/C][C]-0.4087[/C][C]0.342277[/C][/ROW]
[ROW][C]38[/C][C]-0.074076[/C][C]-0.5132[/C][C]0.305078[/C][/ROW]
[ROW][C]39[/C][C]-0.088137[/C][C]-0.6106[/C][C]0.272162[/C][/ROW]
[ROW][C]40[/C][C]0.024114[/C][C]0.1671[/C][C]0.434009[/C][/ROW]
[ROW][C]41[/C][C]-0.06645[/C][C]-0.4604[/C][C]0.323662[/C][/ROW]
[ROW][C]42[/C][C]-0.063356[/C][C]-0.4389[/C][C]0.331335[/C][/ROW]
[ROW][C]43[/C][C]0.022343[/C][C]0.1548[/C][C]0.438816[/C][/ROW]
[ROW][C]44[/C][C]0.090279[/C][C]0.6255[/C][C]0.267311[/C][/ROW]
[ROW][C]45[/C][C]0.089054[/C][C]0.617[/C][C]0.270082[/C][/ROW]
[ROW][C]46[/C][C]0.045047[/C][C]0.3121[/C][C]0.378161[/C][/ROW]
[ROW][C]47[/C][C]-0.020246[/C][C]-0.1403[/C][C]0.444517[/C][/ROW]
[ROW][C]48[/C][C]NA[/C][C]NA[/C][C]NA[/C][/ROW]
[/TABLE]
Source: https://freestatistics.org/blog/index.php?pk=32670&T=2

Globally Unique Identifier (entire table): ba.freestatistics.org/blog/index.php?pk=32670&T=2

As an alternative you can also use a QR Code:  

The GUIDs for individual cells are displayed in the table below:

Partial Autocorrelation Function
Time lag kPACF(k)T-STATP-value
10.0778130.53910.296153
2-0.235627-1.63250.054562
30.1762661.22120.113986
4-0.29426-2.03870.023504
50.0681170.47190.319557
6-0.180645-1.25150.1084
7-0.122697-0.85010.199754
80.0055370.03840.48478
90.0541530.37520.35459
100.0383880.2660.395704
11-0.31239-2.16430.017723
12-0.218313-1.51250.06848
13-0.081893-0.56740.286553
14-0.122275-0.84710.20056
15-0.195897-1.35720.09053
16-0.198875-1.37780.08732
170.168341.16630.124629
18-0.090469-0.62680.266884
19-0.153591-1.06410.146301
200.0161030.11160.455816
210.1986251.37610.087587
22-0.109737-0.76030.225402
23-0.080374-0.55690.290108
24-0.202301-1.40160.083736
250.0018170.01260.495003
26-0.112131-0.77690.220524
27-0.236961-1.64170.053593
280.0065640.04550.481959
29-0.070427-0.48790.313909
30-0.082138-0.56910.285982
310.0147150.10190.459612
320.1358460.94120.175665
330.0066020.04570.481855
34-0.092346-0.63980.262676
35-0.051871-0.35940.360445
36-0.007833-0.05430.478474
37-0.058995-0.40870.342277
38-0.074076-0.51320.305078
39-0.088137-0.61060.272162
400.0241140.16710.434009
41-0.06645-0.46040.323662
42-0.063356-0.43890.331335
430.0223430.15480.438816
440.0902790.62550.267311
450.0890540.6170.270082
460.0450470.31210.378161
47-0.020246-0.14030.444517
48NANANA


Parameters (Session):
par1 = 12 ;
Parameters (R input):
par1 = 48 ; par2 = 0.1 ; par3 = 0 ; par4 = 1 ; par5 = 12 ;
R code (references can be found in the software module):
if (par1 == 'Default') {
par1 = 10*log10(length(x))
} else {
par1 <- as.numeric(par1)
}
par2 <- as.numeric(par2)
par3 <- as.numeric(par3)
par4 <- as.numeric(par4)
par5 <- as.numeric(par5)
if (par2 == 0) {
x <- log(x)
} else {
x <- (x ^ par2 - 1) / par2
}
if (par3 > 0) x <- diff(x,lag=1,difference=par3)
if (par4 > 0) x <- diff(x,lag=par5,difference=par4)
bitmap(file='pic1.png')
racf <- acf(x,par1,main='Autocorrelation',xlab='lags',ylab='ACF')
dev.off()
bitmap(file='pic2.png')
rpacf <- pacf(x,par1,main='Partial Autocorrelation',xlab='lags',ylab='PACF')
dev.off()
(myacf <- c(racf$acf))
(mypacf <- c(rpacf$acf))
lengthx <- length(x)
sqrtn <- sqrt(lengthx)
load(file='createtable')
a<-table.start()
a<-table.row.start(a)
a<-table.element(a,'Autocorrelation Function',4,TRUE)
a<-table.row.end(a)
a<-table.row.start(a)
a<-table.element(a,'Time lag k',header=TRUE)
a<-table.element(a,hyperlink('basics.htm','ACF(k)','click here for more information about the Autocorrelation Function'),header=TRUE)
a<-table.element(a,'T-STAT',header=TRUE)
a<-table.element(a,'P-value',header=TRUE)
a<-table.row.end(a)
for (i in 2:(par1+1)) {
a<-table.row.start(a)
a<-table.element(a,i-1,header=TRUE)
a<-table.element(a,round(myacf[i],6))
mytstat <- myacf[i]*sqrtn
a<-table.element(a,round(mytstat,4))
a<-table.element(a,round(1-pt(abs(mytstat),lengthx),6))
a<-table.row.end(a)
}
a<-table.end(a)
table.save(a,file='mytable.tab')
a<-table.start()
a<-table.row.start(a)
a<-table.element(a,'Partial Autocorrelation Function',4,TRUE)
a<-table.row.end(a)
a<-table.row.start(a)
a<-table.element(a,'Time lag k',header=TRUE)
a<-table.element(a,hyperlink('basics.htm','PACF(k)','click here for more information about the Partial Autocorrelation Function'),header=TRUE)
a<-table.element(a,'T-STAT',header=TRUE)
a<-table.element(a,'P-value',header=TRUE)
a<-table.row.end(a)
for (i in 1:par1) {
a<-table.row.start(a)
a<-table.element(a,i,header=TRUE)
a<-table.element(a,round(mypacf[i],6))
mytstat <- mypacf[i]*sqrtn
a<-table.element(a,round(mytstat,4))
a<-table.element(a,round(1-pt(abs(mytstat),lengthx),6))
a<-table.row.end(a)
}
a<-table.end(a)
table.save(a,file='mytable1.tab')