Free Statistics
of Irreproducible Research!
Description of Statistical Computation | |||||||||||||||||||||||||||||||||||||||||
|---|---|---|---|---|---|---|---|---|---|---|---|---|---|---|---|---|---|---|---|---|---|---|---|---|---|---|---|---|---|---|---|---|---|---|---|---|---|---|---|---|---|
| Author's title | |||||||||||||||||||||||||||||||||||||||||
| Author | *The author of this computation has been verified* | ||||||||||||||||||||||||||||||||||||||||
| R Software Module | rwasp_univariatedataseries.wasp | ||||||||||||||||||||||||||||||||||||||||
| Title produced by software | Univariate Data Series | ||||||||||||||||||||||||||||||||||||||||
| Date of computation | Fri, 12 Dec 2008 05:36:14 -0700 | ||||||||||||||||||||||||||||||||||||||||
| Cite this page as follows | Statistical Computations at FreeStatistics.org, Office for Research Development and Education, URL https://freestatistics.org/blog/index.php?v=date/2008/Dec/12/t1229085468zcn7cn0hgfto6wp.htm/, Retrieved Fri, 17 May 2024 14:35:43 +0000 | ||||||||||||||||||||||||||||||||||||||||
| Statistical Computations at FreeStatistics.org, Office for Research Development and Education, URL https://freestatistics.org/blog/index.php?pk=32632, Retrieved Fri, 17 May 2024 14:35:43 +0000 | |||||||||||||||||||||||||||||||||||||||||
| QR Codes: | |||||||||||||||||||||||||||||||||||||||||
|
| |||||||||||||||||||||||||||||||||||||||||
| Original text written by user: | |||||||||||||||||||||||||||||||||||||||||
| IsPrivate? | No (this computation is public) | ||||||||||||||||||||||||||||||||||||||||
| User-defined keywords | |||||||||||||||||||||||||||||||||||||||||
| Estimated Impact | 169 | ||||||||||||||||||||||||||||||||||||||||
Tree of Dependent Computations | |||||||||||||||||||||||||||||||||||||||||
| Family? (F = Feedback message, R = changed R code, M = changed R Module, P = changed Parameters, D = changed Data) | |||||||||||||||||||||||||||||||||||||||||
| - [Univariate Data Series] [Tijdreeks: totale...] [2008-12-12 12:36:14] [e515c0250d6233b5d2604259ab52cebe] [Current] - RMPD [Central Tendency] [Central tendeny: ...] [2008-12-12 13:14:47] [5161246d1ccc1b670cc664d03050f084] | |||||||||||||||||||||||||||||||||||||||||
| Feedback Forum | |||||||||||||||||||||||||||||||||||||||||
Post a new message | |||||||||||||||||||||||||||||||||||||||||
Dataset | |||||||||||||||||||||||||||||||||||||||||
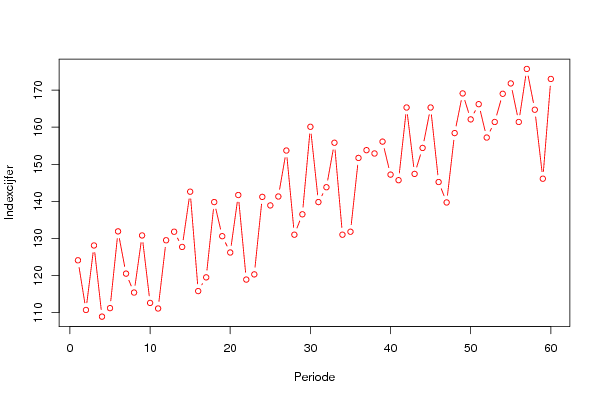
| Dataseries X: | |||||||||||||||||||||||||||||||||||||||||
124,1 110,7 128,1 108,9 111,2 131,9 120,5 115,4 130,8 112,6 111,1 129,5 131,8 127,7 142,6 115,8 119,5 139,8 130,6 126,2 141,7 118,9 120,3 141,2 138,9 141,3 153,7 131 136,5 160,1 139,8 143,8 155,8 131 131,8 151,7 153,8 152,9 156,1 147,2 145,7 165,3 147,4 154,4 165,3 145,2 139,7 158,4 169,1 162,1 166,2 157,2 161,4 169 171,8 161,4 175,7 164,7 146,1 173 | |||||||||||||||||||||||||||||||||||||||||
Tables (Output of Computation) | |||||||||||||||||||||||||||||||||||||||||
| |||||||||||||||||||||||||||||||||||||||||
Figures (Output of Computation) | |||||||||||||||||||||||||||||||||||||||||
Input Parameters & R Code | |||||||||||||||||||||||||||||||||||||||||
| Parameters (Session): | |||||||||||||||||||||||||||||||||||||||||
| par1 = Indexcijfers omzet (totaal) ; par2 = Belgostat ; par3 = Indexcijfers van de totale omzet in België volgens de BTW aangifte. (Indexcijfers van 10/2003 tot 09/2008, indexcijfer 2000 = 100) ; | |||||||||||||||||||||||||||||||||||||||||
| Parameters (R input): | |||||||||||||||||||||||||||||||||||||||||
| par1 = Indexcijfers omzet (totaal) ; par2 = Belgostat ; par3 = Indexcijfers van de totale omzet in België volgens de BTW aangifte. (Indexcijfers van 10/2003 tot 09/2008, indexcijfer 2000 = 100) ; | |||||||||||||||||||||||||||||||||||||||||
| R code (references can be found in the software module): | |||||||||||||||||||||||||||||||||||||||||
bitmap(file='test1.png') | |||||||||||||||||||||||||||||||||||||||||