Free Statistics
of Irreproducible Research!
Description of Statistical Computation | |||||||||||||||||||||
|---|---|---|---|---|---|---|---|---|---|---|---|---|---|---|---|---|---|---|---|---|---|
| Author's title | |||||||||||||||||||||
| Author | *The author of this computation has been verified* | ||||||||||||||||||||
| R Software Module | rwasp_backtobackhist.wasp | ||||||||||||||||||||
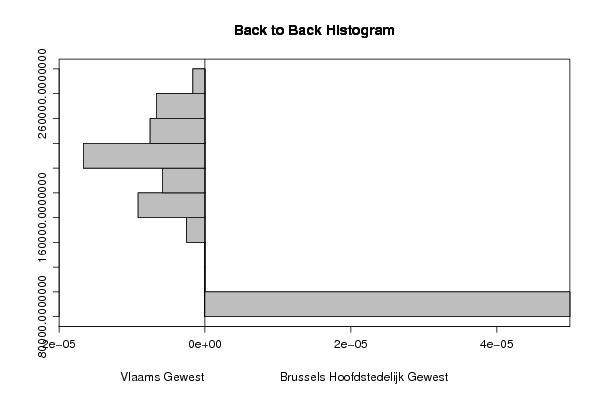
| Title produced by software | Back to Back Histogram | ||||||||||||||||||||
| Date of computation | Fri, 12 Dec 2008 04:36:21 -0700 | ||||||||||||||||||||
| Cite this page as follows | Statistical Computations at FreeStatistics.org, Office for Research Development and Education, URL https://freestatistics.org/blog/index.php?v=date/2008/Dec/12/t1229081828k990ozg8ua8s2i8.htm/, Retrieved Fri, 17 May 2024 13:09:50 +0000 | ||||||||||||||||||||
| Statistical Computations at FreeStatistics.org, Office for Research Development and Education, URL https://freestatistics.org/blog/index.php?pk=32574, Retrieved Fri, 17 May 2024 13:09:50 +0000 | |||||||||||||||||||||
| QR Codes: | |||||||||||||||||||||
|
| |||||||||||||||||||||
| Original text written by user: | |||||||||||||||||||||
| IsPrivate? | No (this computation is public) | ||||||||||||||||||||
| User-defined keywords | |||||||||||||||||||||
| Estimated Impact | 172 | ||||||||||||||||||||
Tree of Dependent Computations | |||||||||||||||||||||
| Family? (F = Feedback message, R = changed R code, M = changed R Module, P = changed Parameters, D = changed Data) | |||||||||||||||||||||
| - [Back to Back Histogram] [Paper: Back-to-Ba...] [2008-12-12 11:22:38] [005293453b571dbccb80b45226e44173] - PD [Back to Back Histogram] [Paper: Back-to-Ba...] [2008-12-12 11:36:21] [b0654df83a8a0e1de3ceb7bf60f0d58f] [Current] - PD [Back to Back Histogram] [Paper: Back-to-Ba...] [2008-12-12 11:50:34] [005293453b571dbccb80b45226e44173] - PD [Back to Back Histogram] [Paper: Back-to-Ba...] [2008-12-12 12:05:04] [005293453b571dbccb80b45226e44173] - PD [Back to Back Histogram] [Paper: Back-to-Ba...] [2008-12-12 12:07:28] [005293453b571dbccb80b45226e44173] - PD [Back to Back Histogram] [Paper: Back-to-Ba...] [2008-12-12 12:10:40] [005293453b571dbccb80b45226e44173] | |||||||||||||||||||||
| Feedback Forum | |||||||||||||||||||||
Post a new message | |||||||||||||||||||||
Dataset | |||||||||||||||||||||
| Dataseries X: | |||||||||||||||||||||
217859 208679 213188 216234 213587 209465 204045 200237 203666 241476 260307 243324 244460 233575 237217 235243 230354 227184 221678 217142 219452 256446 265845 248624 241114 229245 231805 219277 219313 212610 214771 211142 211457 240048 240636 230580 208795 197922 194596 194581 185686 178106 172608 167302 168053 202300 202388 182516 173476 166444 171297 169701 164182 161914 159612 151001 158114 186530 187069 174330 | |||||||||||||||||||||
| Dataseries Y: | |||||||||||||||||||||
88827 85874 85211 87130 88620 89563 89056 88542 89504 89428 86040 96240 94423 93028 92285 91685 94260 93858 92437 92980 92099 92803 88551 98334 98329 96455 97109 97687 98512 98673 96028 98014 95580 97838 97760 99913 97588 93942 93656 93365 92881 93120 91063 90930 91946 94624 95484 95862 95530 94574 94677 93845 91533 91214 90922 89563 89945 91850 92505 92437 | |||||||||||||||||||||
Tables (Output of Computation) | |||||||||||||||||||||
| |||||||||||||||||||||
Figures (Output of Computation) | |||||||||||||||||||||
Input Parameters & R Code | |||||||||||||||||||||
| Parameters (Session): | |||||||||||||||||||||
| par1 = grey ; par2 = grey ; par3 = TRUE ; par4 = Vlaams Gewest ; par5 = Brussels Hoofdstedelijk Gewest ; | |||||||||||||||||||||
| Parameters (R input): | |||||||||||||||||||||
| par1 = grey ; par2 = grey ; par3 = TRUE ; par4 = Vlaams Gewest ; par5 = Brussels Hoofdstedelijk Gewest ; | |||||||||||||||||||||
| R code (references can be found in the software module): | |||||||||||||||||||||
if (par3 == 'TRUE') par3 <- TRUE | |||||||||||||||||||||