Free Statistics

of Irreproducible Research!

Author's title

Author*The author of this computation has been verified*
R Software Modulerwasp_histogram.wasp
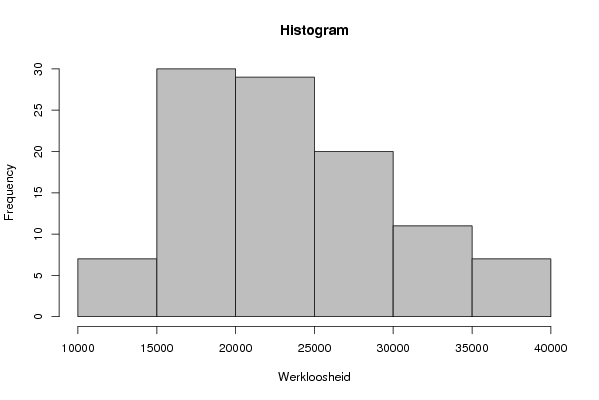
Title produced by softwareHistogram
Date of computationFri, 12 Dec 2008 03:56:14 -0700
Cite this page as followsStatistical Computations at FreeStatistics.org, Office for Research Development and Education, URL https://freestatistics.org/blog/index.php?v=date/2008/Dec/12/t1229079424jwuicha2s8b06wg.htm/, Retrieved Fri, 17 May 2024 18:12:27 +0000
Statistical Computations at FreeStatistics.org, Office for Research Development and Education, URL https://freestatistics.org/blog/index.php?pk=32535, Retrieved Fri, 17 May 2024 18:12:27 +0000
QR Codes:

Original text written by user:
IsPrivate?No (this computation is public)
User-defined keywords
Estimated Impact180
Family? (F = Feedback message, R = changed R code, M = changed R Module, P = changed Parameters, D = changed Data)
-       [Histogram] [Paper histogram2] [2008-12-12 10:56:14] [a1f1fdabaee79c21770ea0f7b7f045f3] [Current]
Feedback Forum

Post a new message
Dataseries X:
21863
20403
18792
17931
16475
16205
25134
31896
26537
22801
20200
19666
19809
18799
17884
17512
16327
16880
26537
31867
29427
25800
22041
21759
21333
20462
19594
18564
17640
18614
32562
35640
31865
28117
25508
25006
24452
22643
21474
20500
19505
21769
36062
38633
34629
30184
27271
26841
26482
25538
23789
22386
21087
22891
36192
38922
34669
30197
27001
25891
24879
23662
22741
21615
20305
21877
35369
37941
33480
29757
26323
25359
22207
21763
19944
19662
18624
19902
31726
32860
28894
22949
19758
18420
18245
16761
15341
14271
13418
15218
26485
27457
21402
17879
15607
15626
15303
14296
13686
12948
11609
14602
23629
24680


Summary of computational transaction
Raw Inputview raw input (R code)
Raw Outputview raw output of R engine
Computing time1 seconds
R Server'George Udny Yule' @ 72.249.76.132

\begin{tabular}{lllllllll}
\hline
Summary of computational transaction \tabularnewline
Raw Input & view raw input (R code)  \tabularnewline
Raw Output & view raw output of R engine  \tabularnewline
Computing time & 1 seconds \tabularnewline
R Server & 'George Udny Yule' @ 72.249.76.132 \tabularnewline
\hline
\end{tabular}
%Source: https://freestatistics.org/blog/index.php?pk=32535&T=0

[TABLE]
[ROW][C]Summary of computational transaction[/C][/ROW]
[ROW][C]Raw Input[/C][C]view raw input (R code) [/C][/ROW]
[ROW][C]Raw Output[/C][C]view raw output of R engine [/C][/ROW]
[ROW][C]Computing time[/C][C]1 seconds[/C][/ROW]
[ROW][C]R Server[/C][C]'George Udny Yule' @ 72.249.76.132[/C][/ROW]
[/TABLE]
Source: https://freestatistics.org/blog/index.php?pk=32535&T=0

Globally Unique Identifier (entire table): ba.freestatistics.org/blog/index.php?pk=32535&T=0

As an alternative you can also use a QR Code:  

The GUIDs for individual cells are displayed in the table below:

Summary of computational transaction
Raw Inputview raw input (R code)
Raw Outputview raw output of R engine
Computing time1 seconds
R Server'George Udny Yule' @ 72.249.76.132


Frequency Table (Histogram)
BinsMidpointAbs. FrequencyRel. FrequencyCumul. Rel. Freq.Density
[10000,15000[1250070.0673080.0673081.3e-05
[15000,20000[17500300.2884620.3557695.8e-05
[20000,25000[22500290.2788460.6346155.6e-05
[25000,30000[27500200.1923080.8269233.8e-05
[30000,35000[32500110.1057690.9326922.1e-05
[35000,40000]3750070.06730811.3e-05

\begin{tabular}{lllllllll}
\hline
Frequency Table (Histogram) \tabularnewline
Bins & Midpoint & Abs. Frequency & Rel. Frequency & Cumul. Rel. Freq. & Density \tabularnewline
[10000,15000[ & 12500 & 7 & 0.067308 & 0.067308 & 1.3e-05 \tabularnewline
[15000,20000[ & 17500 & 30 & 0.288462 & 0.355769 & 5.8e-05 \tabularnewline
[20000,25000[ & 22500 & 29 & 0.278846 & 0.634615 & 5.6e-05 \tabularnewline
[25000,30000[ & 27500 & 20 & 0.192308 & 0.826923 & 3.8e-05 \tabularnewline
[30000,35000[ & 32500 & 11 & 0.105769 & 0.932692 & 2.1e-05 \tabularnewline
[35000,40000] & 37500 & 7 & 0.067308 & 1 & 1.3e-05 \tabularnewline
\hline
\end{tabular}
%Source: https://freestatistics.org/blog/index.php?pk=32535&T=1

[TABLE]
[ROW][C]Frequency Table (Histogram)[/C][/ROW]
[ROW][C]Bins[/C][C]Midpoint[/C][C]Abs. Frequency[/C][C]Rel. Frequency[/C][C]Cumul. Rel. Freq.[/C][C]Density[/C][/ROW]
[ROW][C][10000,15000[[/C][C]12500[/C][C]7[/C][C]0.067308[/C][C]0.067308[/C][C]1.3e-05[/C][/ROW]
[ROW][C][15000,20000[[/C][C]17500[/C][C]30[/C][C]0.288462[/C][C]0.355769[/C][C]5.8e-05[/C][/ROW]
[ROW][C][20000,25000[[/C][C]22500[/C][C]29[/C][C]0.278846[/C][C]0.634615[/C][C]5.6e-05[/C][/ROW]
[ROW][C][25000,30000[[/C][C]27500[/C][C]20[/C][C]0.192308[/C][C]0.826923[/C][C]3.8e-05[/C][/ROW]
[ROW][C][30000,35000[[/C][C]32500[/C][C]11[/C][C]0.105769[/C][C]0.932692[/C][C]2.1e-05[/C][/ROW]
[ROW][C][35000,40000][/C][C]37500[/C][C]7[/C][C]0.067308[/C][C]1[/C][C]1.3e-05[/C][/ROW]
[/TABLE]
Source: https://freestatistics.org/blog/index.php?pk=32535&T=1

Globally Unique Identifier (entire table): ba.freestatistics.org/blog/index.php?pk=32535&T=1

As an alternative you can also use a QR Code:  

The GUIDs for individual cells are displayed in the table below:

Frequency Table (Histogram)
BinsMidpointAbs. FrequencyRel. FrequencyCumul. Rel. Freq.Density
[10000,15000[1250070.0673080.0673081.3e-05
[15000,20000[17500300.2884620.3557695.8e-05
[20000,25000[22500290.2788460.6346155.6e-05
[25000,30000[27500200.1923080.8269233.8e-05
[30000,35000[32500110.1057690.9326922.1e-05
[35000,40000]3750070.06730811.3e-05


Parameters (Session):
par2 = grey ; par3 = FALSE ; par4 = Unknown ;
Parameters (R input):
par1 = ; par2 = grey ; par3 = FALSE ; par4 = Unknown ;
R code (references can be found in the software module):
par1 <- as.numeric(par1)
if (par3 == 'TRUE') par3 <- TRUE
if (par3 == 'FALSE') par3 <- FALSE
if (par4 == 'Unknown') par1 <- as.numeric(par1)
if (par4 == 'Interval/Ratio') par1 <- as.numeric(par1)
if (par4 == '3-point Likert') par1 <- c(1:3 - 0.5, 3.5)
if (par4 == '4-point Likert') par1 <- c(1:4 - 0.5, 4.5)
if (par4 == '5-point Likert') par1 <- c(1:5 - 0.5, 5.5)
if (par4 == '6-point Likert') par1 <- c(1:6 - 0.5, 6.5)
if (par4 == '7-point Likert') par1 <- c(1:7 - 0.5, 7.5)
if (par4 == '8-point Likert') par1 <- c(1:8 - 0.5, 8.5)
if (par4 == '9-point Likert') par1 <- c(1:9 - 0.5, 9.5)
if (par4 == '10-point Likert') par1 <- c(1:10 - 0.5, 10.5)
bitmap(file='test1.png')
if (is.na(par1)) {
myhist<-hist(x,col=par2,main=main,xlab=xlab,right=par3)
} else {
if (par1 < 0) par1 <- 3
if (par1 > 50) par1 <- 50
myhist<-hist(x,breaks=par1,col=par2,main=main,xlab=xlab,right=par3)
}
dev.off()
myhist
n <- length(x)
load(file='createtable')
a<-table.start()
a<-table.row.start(a)
a<-table.element(a,hyperlink('histogram.htm','Frequency Table (Histogram)',''),6,TRUE)
a<-table.row.end(a)
a<-table.row.start(a)
a<-table.element(a,'Bins',header=TRUE)
a<-table.element(a,'Midpoint',header=TRUE)
a<-table.element(a,'Abs. Frequency',header=TRUE)
a<-table.element(a,'Rel. Frequency',header=TRUE)
a<-table.element(a,'Cumul. Rel. Freq.',header=TRUE)
a<-table.element(a,'Density',header=TRUE)
a<-table.row.end(a)
crf <- 0
if (par3 == FALSE) mybracket <- '[' else mybracket <- ']'
mynumrows <- (length(myhist$breaks)-1)
for (i in 1:mynumrows) {
a<-table.row.start(a)
if (i == 1)
dum <- paste('[',myhist$breaks[i],sep='')
else
dum <- paste(mybracket,myhist$breaks[i],sep='')
dum <- paste(dum,myhist$breaks[i+1],sep=',')
if (i==mynumrows)
dum <- paste(dum,']',sep='')
else
dum <- paste(dum,mybracket,sep='')
a<-table.element(a,dum,header=TRUE)
a<-table.element(a,myhist$mids[i])
a<-table.element(a,myhist$counts[i])
rf <- myhist$counts[i]/n
crf <- crf + rf
a<-table.element(a,round(rf,6))
a<-table.element(a,round(crf,6))
a<-table.element(a,round(myhist$density[i],6))
a<-table.row.end(a)
}
a<-table.end(a)
table.save(a,file='mytable.tab')