Free Statistics

of Irreproducible Research!

Author's title

Author*The author of this computation has been verified*
R Software Modulerwasp_arimaforecasting.wasp
Title produced by softwareARIMA Forecasting
Date of computationFri, 12 Dec 2008 03:28:00 -0700
Cite this page as followsStatistical Computations at FreeStatistics.org, Office for Research Development and Education, URL https://freestatistics.org/blog/index.php?v=date/2008/Dec/12/t1229077730wj875r0ggygyuhr.htm/, Retrieved Fri, 17 May 2024 13:45:04 +0000
Statistical Computations at FreeStatistics.org, Office for Research Development and Education, URL https://freestatistics.org/blog/index.php?pk=32516, Retrieved Fri, 17 May 2024 13:45:04 +0000
QR Codes:

Original text written by user:
IsPrivate?No (this computation is public)
User-defined keywords
Estimated Impact229
Family? (F = Feedback message, R = changed R code, M = changed R Module, P = changed Parameters, D = changed Data)
-     [Univariate Data Series] [data set] [2008-12-01 19:54:57] [b98453cac15ba1066b407e146608df68]
F RMP   [ARIMA Backward Selection] [step 5] [2008-12-08 12:55:31] [6bf01ed8d6668535fdab898b5820a5bc]
F   PD    [ARIMA Backward Selection] [step 5] [2008-12-08 19:34:44] [d134696a922d84037f02d49ded84b0bd]
F RMPD        [ARIMA Forecasting] [step 1] [2008-12-12 10:28:00] [db9a5fd0f9c3e1245d8075d8bb09236d] [Current]
Feedback Forum
2008-12-22 23:39:31 [Inge Meelberghs] [reply
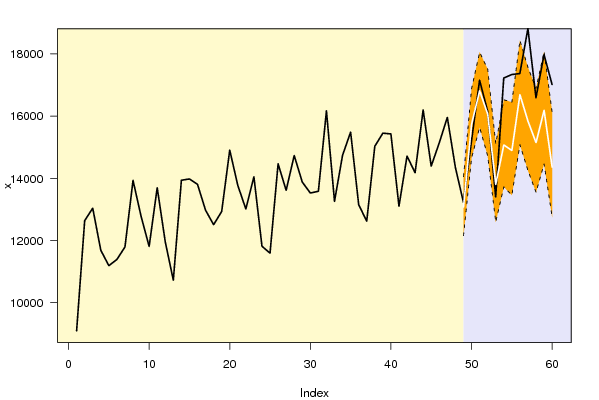
Met de parameters die we in het voorgaande arima backward hebben gevonden gaan we nu een voorspelling doen voor deze tijdreeks en kijken of deze overeenstemt met de werkelijke waarde. In deze voorspelling hebben we voor testing period=12 gekozen, dus we gaan de werkelijke waarden van het laatste jaar vergelijken met de voorspelde waarden. Dit zie je ook in de eerste grafiek. Het gele gedeelte dat we zien is het betrouwbaarheidsinterval, de zwarte lijn is de werkelijke waarde en de witte lijn is de voorspelde. We zien dat de werkelijke en de voorspelde gedurende het volledige laatste jaar niet altijd binnen het betrouwbaarheidsinterval blijven, ook overlappen ze soms elkaar.


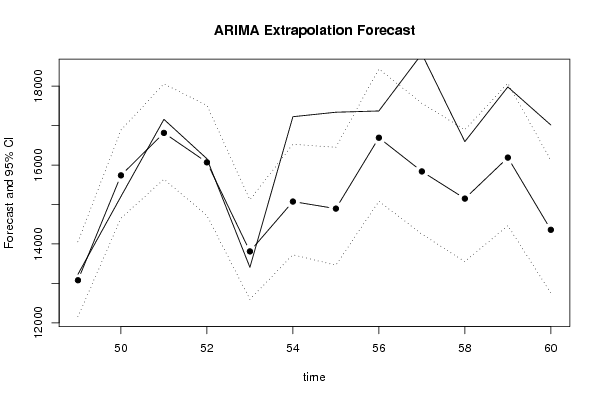
De tweede grafiek geeft hiervan een duidelijker beeld. Nu zien we nog beter dat de werkelijke en de voorspelde waarden niet altijd binnen de betrouwbaarheidsintervallen liggen.De grafiek met de bolletjes in de voorspelde waarde en zwarte lijn de werkelijke. Wanneer de werkelijke boven de voorspelde ligt hebben we te maken met een onderschatting. We zien dat dit zich vooral voordoet op het einde van de grafiek. De twee curven nemen eigenlijk een totaal verschillend verloop aan waardoor we kunnen aannemen dat de voorspelling niet correct is.

Post a new message
Dataseries X:
9097.4
12639.8
13040.1
11687.3
11191.7
11391.9
11793.1
13933.2
12778.1
11810.3
13698.4
11956.6
10723.8
13938.9
13979.8
13807.4
12973.9
12509.8
12934.1
14908.3
13772.1
13012.6
14049.9
11816.5
11593.2
14466.2
13615.9
14733.9
13880.7
13527.5
13584
16170.2
13260.6
14741.9
15486.5
13154.5
12621.2
15031.6
15452.4
15428
13105.9
14716.8
14180
16202.2
14392.4
15140.6
15960.1
14351.3
13230.2
15202.1
17157.3
16159.1
13405.7
17224.7
17338.4
17370.6
18817.8
16593.2
17979.5
17015.2


Summary of computational transaction
Raw Inputview raw input (R code)
Raw Outputview raw output of R engine
Computing time2 seconds
R Server'Gwilym Jenkins' @ 72.249.127.135

\begin{tabular}{lllllllll}
\hline
Summary of computational transaction \tabularnewline
Raw Input & view raw input (R code)  \tabularnewline
Raw Output & view raw output of R engine  \tabularnewline
Computing time & 2 seconds \tabularnewline
R Server & 'Gwilym Jenkins' @ 72.249.127.135 \tabularnewline
\hline
\end{tabular}
%Source: https://freestatistics.org/blog/index.php?pk=32516&T=0

[TABLE]
[ROW][C]Summary of computational transaction[/C][/ROW]
[ROW][C]Raw Input[/C][C]view raw input (R code) [/C][/ROW]
[ROW][C]Raw Output[/C][C]view raw output of R engine [/C][/ROW]
[ROW][C]Computing time[/C][C]2 seconds[/C][/ROW]
[ROW][C]R Server[/C][C]'Gwilym Jenkins' @ 72.249.127.135[/C][/ROW]
[/TABLE]
Source: https://freestatistics.org/blog/index.php?pk=32516&T=0

Globally Unique Identifier (entire table): ba.freestatistics.org/blog/index.php?pk=32516&T=0

As an alternative you can also use a QR Code:  

The GUIDs for individual cells are displayed in the table below:

Summary of computational transaction
Raw Inputview raw input (R code)
Raw Outputview raw output of R engine
Computing time2 seconds
R Server'Gwilym Jenkins' @ 72.249.127.135


Univariate ARIMA Extrapolation Forecast
timeY[t]F[t]95% LB95% UBp-value(H0: Y[t] = F[t])P(F[t]>Y[t-1])P(F[t]>Y[t-s])P(F[t]>Y[48])
3613154.5-------
3712621.2-------
3815031.6-------
3915452.4-------
4015428-------
4113105.9-------
4214716.8-------
4314180-------
4416202.2-------
4514392.4-------
4615140.6-------
4715960.1-------
4814351.3-------
4913230.213078.243312155.744414055.91780.38030.00540.82020.0054
5015202.115737.435514653.359316884.74410.180210.88610.9911
5117157.316813.950815639.854718057.52380.29420.99450.98410.9999
5216159.116067.508214720.671317511.16990.45050.06950.80740.9901
5313405.713809.670912593.303715118.2630.27262e-040.85410.2086
5417224.715073.548413725.393816525.61740.00180.98780.68490.8352
5517338.414894.703113460.367916448.7870.0010.00160.81630.7534
5617370.616691.645615082.452618435.350.22270.23360.70890.9957
5718817.815837.377414248.436417565.01384e-040.0410.94940.9541
5816593.215148.613813551.489316892.89430.052300.50360.8149
5917979.516188.326514464.944118072.19120.03120.33680.59380.972
6017015.214357.629912753.214316119.60430.001600.50280.5028

\begin{tabular}{lllllllll}
\hline
Univariate ARIMA Extrapolation Forecast \tabularnewline
time & Y[t] & F[t] & 95% LB & 95% UB & p-value(H0: Y[t] = F[t]) & P(F[t]>Y[t-1]) & P(F[t]>Y[t-s]) & P(F[t]>Y[48]) \tabularnewline
36 & 13154.5 & - & - & - & - & - & - & - \tabularnewline
37 & 12621.2 & - & - & - & - & - & - & - \tabularnewline
38 & 15031.6 & - & - & - & - & - & - & - \tabularnewline
39 & 15452.4 & - & - & - & - & - & - & - \tabularnewline
40 & 15428 & - & - & - & - & - & - & - \tabularnewline
41 & 13105.9 & - & - & - & - & - & - & - \tabularnewline
42 & 14716.8 & - & - & - & - & - & - & - \tabularnewline
43 & 14180 & - & - & - & - & - & - & - \tabularnewline
44 & 16202.2 & - & - & - & - & - & - & - \tabularnewline
45 & 14392.4 & - & - & - & - & - & - & - \tabularnewline
46 & 15140.6 & - & - & - & - & - & - & - \tabularnewline
47 & 15960.1 & - & - & - & - & - & - & - \tabularnewline
48 & 14351.3 & - & - & - & - & - & - & - \tabularnewline
49 & 13230.2 & 13078.2433 & 12155.7444 & 14055.9178 & 0.3803 & 0.0054 & 0.8202 & 0.0054 \tabularnewline
50 & 15202.1 & 15737.4355 & 14653.3593 & 16884.7441 & 0.1802 & 1 & 0.8861 & 0.9911 \tabularnewline
51 & 17157.3 & 16813.9508 & 15639.8547 & 18057.5238 & 0.2942 & 0.9945 & 0.9841 & 0.9999 \tabularnewline
52 & 16159.1 & 16067.5082 & 14720.6713 & 17511.1699 & 0.4505 & 0.0695 & 0.8074 & 0.9901 \tabularnewline
53 & 13405.7 & 13809.6709 & 12593.3037 & 15118.263 & 0.2726 & 2e-04 & 0.8541 & 0.2086 \tabularnewline
54 & 17224.7 & 15073.5484 & 13725.3938 & 16525.6174 & 0.0018 & 0.9878 & 0.6849 & 0.8352 \tabularnewline
55 & 17338.4 & 14894.7031 & 13460.3679 & 16448.787 & 0.001 & 0.0016 & 0.8163 & 0.7534 \tabularnewline
56 & 17370.6 & 16691.6456 & 15082.4526 & 18435.35 & 0.2227 & 0.2336 & 0.7089 & 0.9957 \tabularnewline
57 & 18817.8 & 15837.3774 & 14248.4364 & 17565.0138 & 4e-04 & 0.041 & 0.9494 & 0.9541 \tabularnewline
58 & 16593.2 & 15148.6138 & 13551.4893 & 16892.8943 & 0.0523 & 0 & 0.5036 & 0.8149 \tabularnewline
59 & 17979.5 & 16188.3265 & 14464.9441 & 18072.1912 & 0.0312 & 0.3368 & 0.5938 & 0.972 \tabularnewline
60 & 17015.2 & 14357.6299 & 12753.2143 & 16119.6043 & 0.0016 & 0 & 0.5028 & 0.5028 \tabularnewline
\hline
\end{tabular}
%Source: https://freestatistics.org/blog/index.php?pk=32516&T=1

[TABLE]
[ROW][C]Univariate ARIMA Extrapolation Forecast[/C][/ROW]
[ROW][C]time[/C][C]Y[t][/C][C]F[t][/C][C]95% LB[/C][C]95% UB[/C][C]p-value(H0: Y[t] = F[t])[/C][C]P(F[t]>Y[t-1])[/C][C]P(F[t]>Y[t-s])[/C][C]P(F[t]>Y[48])[/C][/ROW]
[ROW][C]36[/C][C]13154.5[/C][C]-[/C][C]-[/C][C]-[/C][C]-[/C][C]-[/C][C]-[/C][C]-[/C][/ROW]
[ROW][C]37[/C][C]12621.2[/C][C]-[/C][C]-[/C][C]-[/C][C]-[/C][C]-[/C][C]-[/C][C]-[/C][/ROW]
[ROW][C]38[/C][C]15031.6[/C][C]-[/C][C]-[/C][C]-[/C][C]-[/C][C]-[/C][C]-[/C][C]-[/C][/ROW]
[ROW][C]39[/C][C]15452.4[/C][C]-[/C][C]-[/C][C]-[/C][C]-[/C][C]-[/C][C]-[/C][C]-[/C][/ROW]
[ROW][C]40[/C][C]15428[/C][C]-[/C][C]-[/C][C]-[/C][C]-[/C][C]-[/C][C]-[/C][C]-[/C][/ROW]
[ROW][C]41[/C][C]13105.9[/C][C]-[/C][C]-[/C][C]-[/C][C]-[/C][C]-[/C][C]-[/C][C]-[/C][/ROW]
[ROW][C]42[/C][C]14716.8[/C][C]-[/C][C]-[/C][C]-[/C][C]-[/C][C]-[/C][C]-[/C][C]-[/C][/ROW]
[ROW][C]43[/C][C]14180[/C][C]-[/C][C]-[/C][C]-[/C][C]-[/C][C]-[/C][C]-[/C][C]-[/C][/ROW]
[ROW][C]44[/C][C]16202.2[/C][C]-[/C][C]-[/C][C]-[/C][C]-[/C][C]-[/C][C]-[/C][C]-[/C][/ROW]
[ROW][C]45[/C][C]14392.4[/C][C]-[/C][C]-[/C][C]-[/C][C]-[/C][C]-[/C][C]-[/C][C]-[/C][/ROW]
[ROW][C]46[/C][C]15140.6[/C][C]-[/C][C]-[/C][C]-[/C][C]-[/C][C]-[/C][C]-[/C][C]-[/C][/ROW]
[ROW][C]47[/C][C]15960.1[/C][C]-[/C][C]-[/C][C]-[/C][C]-[/C][C]-[/C][C]-[/C][C]-[/C][/ROW]
[ROW][C]48[/C][C]14351.3[/C][C]-[/C][C]-[/C][C]-[/C][C]-[/C][C]-[/C][C]-[/C][C]-[/C][/ROW]
[ROW][C]49[/C][C]13230.2[/C][C]13078.2433[/C][C]12155.7444[/C][C]14055.9178[/C][C]0.3803[/C][C]0.0054[/C][C]0.8202[/C][C]0.0054[/C][/ROW]
[ROW][C]50[/C][C]15202.1[/C][C]15737.4355[/C][C]14653.3593[/C][C]16884.7441[/C][C]0.1802[/C][C]1[/C][C]0.8861[/C][C]0.9911[/C][/ROW]
[ROW][C]51[/C][C]17157.3[/C][C]16813.9508[/C][C]15639.8547[/C][C]18057.5238[/C][C]0.2942[/C][C]0.9945[/C][C]0.9841[/C][C]0.9999[/C][/ROW]
[ROW][C]52[/C][C]16159.1[/C][C]16067.5082[/C][C]14720.6713[/C][C]17511.1699[/C][C]0.4505[/C][C]0.0695[/C][C]0.8074[/C][C]0.9901[/C][/ROW]
[ROW][C]53[/C][C]13405.7[/C][C]13809.6709[/C][C]12593.3037[/C][C]15118.263[/C][C]0.2726[/C][C]2e-04[/C][C]0.8541[/C][C]0.2086[/C][/ROW]
[ROW][C]54[/C][C]17224.7[/C][C]15073.5484[/C][C]13725.3938[/C][C]16525.6174[/C][C]0.0018[/C][C]0.9878[/C][C]0.6849[/C][C]0.8352[/C][/ROW]
[ROW][C]55[/C][C]17338.4[/C][C]14894.7031[/C][C]13460.3679[/C][C]16448.787[/C][C]0.001[/C][C]0.0016[/C][C]0.8163[/C][C]0.7534[/C][/ROW]
[ROW][C]56[/C][C]17370.6[/C][C]16691.6456[/C][C]15082.4526[/C][C]18435.35[/C][C]0.2227[/C][C]0.2336[/C][C]0.7089[/C][C]0.9957[/C][/ROW]
[ROW][C]57[/C][C]18817.8[/C][C]15837.3774[/C][C]14248.4364[/C][C]17565.0138[/C][C]4e-04[/C][C]0.041[/C][C]0.9494[/C][C]0.9541[/C][/ROW]
[ROW][C]58[/C][C]16593.2[/C][C]15148.6138[/C][C]13551.4893[/C][C]16892.8943[/C][C]0.0523[/C][C]0[/C][C]0.5036[/C][C]0.8149[/C][/ROW]
[ROW][C]59[/C][C]17979.5[/C][C]16188.3265[/C][C]14464.9441[/C][C]18072.1912[/C][C]0.0312[/C][C]0.3368[/C][C]0.5938[/C][C]0.972[/C][/ROW]
[ROW][C]60[/C][C]17015.2[/C][C]14357.6299[/C][C]12753.2143[/C][C]16119.6043[/C][C]0.0016[/C][C]0[/C][C]0.5028[/C][C]0.5028[/C][/ROW]
[/TABLE]
Source: https://freestatistics.org/blog/index.php?pk=32516&T=1

Globally Unique Identifier (entire table): ba.freestatistics.org/blog/index.php?pk=32516&T=1

As an alternative you can also use a QR Code:  

The GUIDs for individual cells are displayed in the table below:

Univariate ARIMA Extrapolation Forecast
timeY[t]F[t]95% LB95% UBp-value(H0: Y[t] = F[t])P(F[t]>Y[t-1])P(F[t]>Y[t-s])P(F[t]>Y[48])
3613154.5-------
3712621.2-------
3815031.6-------
3915452.4-------
4015428-------
4113105.9-------
4214716.8-------
4314180-------
4416202.2-------
4514392.4-------
4615140.6-------
4715960.1-------
4814351.3-------
4913230.213078.243312155.744414055.91780.38030.00540.82020.0054
5015202.115737.435514653.359316884.74410.180210.88610.9911
5117157.316813.950815639.854718057.52380.29420.99450.98410.9999
5216159.116067.508214720.671317511.16990.45050.06950.80740.9901
5313405.713809.670912593.303715118.2630.27262e-040.85410.2086
5417224.715073.548413725.393816525.61740.00180.98780.68490.8352
5517338.414894.703113460.367916448.7870.0010.00160.81630.7534
5617370.616691.645615082.452618435.350.22270.23360.70890.9957
5718817.815837.377414248.436417565.01384e-040.0410.94940.9541
5816593.215148.613813551.489316892.89430.052300.50360.8149
5917979.516188.326514464.944118072.19120.03120.33680.59380.972
6017015.214357.629912753.214316119.60430.001600.50280.5028


Univariate ARIMA Extrapolation Forecast Performance
time% S.E.PEMAPESq.EMSERMSE
490.03810.01160.00123090.83251924.23643.8661
500.0372-0.0340.0028286584.10423882.0087154.538
510.03770.02040.0017117888.65919824.054999.1164
520.04580.00575e-048389.0646699.088726.4403
530.0483-0.02930.0024163192.503913599.3753116.6164
540.04910.14270.01194627453.3973385621.1164620.984
550.05320.16410.01375971654.3779497637.8648705.4345
560.05330.04070.0034460979.144538414.9287195.9973
570.05570.18820.01578882918.7377740243.2281860.3739
580.05870.09540.00792086829.1766173902.4314417.0161
590.05940.11060.00923208302.3749267358.5312517.0672
600.06260.18510.01547062678.883588556.5736767.1744

\begin{tabular}{lllllllll}
\hline
Univariate ARIMA Extrapolation Forecast Performance \tabularnewline
time & % S.E. & PE & MAPE & Sq.E & MSE & RMSE \tabularnewline
49 & 0.0381 & 0.0116 & 0.001 & 23090.8325 & 1924.236 & 43.8661 \tabularnewline
50 & 0.0372 & -0.034 & 0.0028 & 286584.104 & 23882.0087 & 154.538 \tabularnewline
51 & 0.0377 & 0.0204 & 0.0017 & 117888.6591 & 9824.0549 & 99.1164 \tabularnewline
52 & 0.0458 & 0.0057 & 5e-04 & 8389.0646 & 699.0887 & 26.4403 \tabularnewline
53 & 0.0483 & -0.0293 & 0.0024 & 163192.5039 & 13599.3753 & 116.6164 \tabularnewline
54 & 0.0491 & 0.1427 & 0.0119 & 4627453.3973 & 385621.1164 & 620.984 \tabularnewline
55 & 0.0532 & 0.1641 & 0.0137 & 5971654.3779 & 497637.8648 & 705.4345 \tabularnewline
56 & 0.0533 & 0.0407 & 0.0034 & 460979.1445 & 38414.9287 & 195.9973 \tabularnewline
57 & 0.0557 & 0.1882 & 0.0157 & 8882918.7377 & 740243.2281 & 860.3739 \tabularnewline
58 & 0.0587 & 0.0954 & 0.0079 & 2086829.1766 & 173902.4314 & 417.0161 \tabularnewline
59 & 0.0594 & 0.1106 & 0.0092 & 3208302.3749 & 267358.5312 & 517.0672 \tabularnewline
60 & 0.0626 & 0.1851 & 0.0154 & 7062678.883 & 588556.5736 & 767.1744 \tabularnewline
\hline
\end{tabular}
%Source: https://freestatistics.org/blog/index.php?pk=32516&T=2

[TABLE]
[ROW][C]Univariate ARIMA Extrapolation Forecast Performance[/C][/ROW]
[ROW][C]time[/C][C]% S.E.[/C][C]PE[/C][C]MAPE[/C][C]Sq.E[/C][C]MSE[/C][C]RMSE[/C][/ROW]
[ROW][C]49[/C][C]0.0381[/C][C]0.0116[/C][C]0.001[/C][C]23090.8325[/C][C]1924.236[/C][C]43.8661[/C][/ROW]
[ROW][C]50[/C][C]0.0372[/C][C]-0.034[/C][C]0.0028[/C][C]286584.104[/C][C]23882.0087[/C][C]154.538[/C][/ROW]
[ROW][C]51[/C][C]0.0377[/C][C]0.0204[/C][C]0.0017[/C][C]117888.6591[/C][C]9824.0549[/C][C]99.1164[/C][/ROW]
[ROW][C]52[/C][C]0.0458[/C][C]0.0057[/C][C]5e-04[/C][C]8389.0646[/C][C]699.0887[/C][C]26.4403[/C][/ROW]
[ROW][C]53[/C][C]0.0483[/C][C]-0.0293[/C][C]0.0024[/C][C]163192.5039[/C][C]13599.3753[/C][C]116.6164[/C][/ROW]
[ROW][C]54[/C][C]0.0491[/C][C]0.1427[/C][C]0.0119[/C][C]4627453.3973[/C][C]385621.1164[/C][C]620.984[/C][/ROW]
[ROW][C]55[/C][C]0.0532[/C][C]0.1641[/C][C]0.0137[/C][C]5971654.3779[/C][C]497637.8648[/C][C]705.4345[/C][/ROW]
[ROW][C]56[/C][C]0.0533[/C][C]0.0407[/C][C]0.0034[/C][C]460979.1445[/C][C]38414.9287[/C][C]195.9973[/C][/ROW]
[ROW][C]57[/C][C]0.0557[/C][C]0.1882[/C][C]0.0157[/C][C]8882918.7377[/C][C]740243.2281[/C][C]860.3739[/C][/ROW]
[ROW][C]58[/C][C]0.0587[/C][C]0.0954[/C][C]0.0079[/C][C]2086829.1766[/C][C]173902.4314[/C][C]417.0161[/C][/ROW]
[ROW][C]59[/C][C]0.0594[/C][C]0.1106[/C][C]0.0092[/C][C]3208302.3749[/C][C]267358.5312[/C][C]517.0672[/C][/ROW]
[ROW][C]60[/C][C]0.0626[/C][C]0.1851[/C][C]0.0154[/C][C]7062678.883[/C][C]588556.5736[/C][C]767.1744[/C][/ROW]
[/TABLE]
Source: https://freestatistics.org/blog/index.php?pk=32516&T=2

Globally Unique Identifier (entire table): ba.freestatistics.org/blog/index.php?pk=32516&T=2

As an alternative you can also use a QR Code:  

The GUIDs for individual cells are displayed in the table below:

Univariate ARIMA Extrapolation Forecast Performance
time% S.E.PEMAPESq.EMSERMSE
490.03810.01160.00123090.83251924.23643.8661
500.0372-0.0340.0028286584.10423882.0087154.538
510.03770.02040.0017117888.65919824.054999.1164
520.04580.00575e-048389.0646699.088726.4403
530.0483-0.02930.0024163192.503913599.3753116.6164
540.04910.14270.01194627453.3973385621.1164620.984
550.05320.16410.01375971654.3779497637.8648705.4345
560.05330.04070.0034460979.144538414.9287195.9973
570.05570.18820.01578882918.7377740243.2281860.3739
580.05870.09540.00792086829.1766173902.4314417.0161
590.05940.11060.00923208302.3749267358.5312517.0672
600.06260.18510.01547062678.883588556.5736767.1744


Parameters (Session):
par1 = 12 ; par2 = 0.2 ; par3 = 0 ; par4 = 1 ; par5 = 12 ; par6 = 3 ; par7 = 0 ; par8 = 2 ; par9 = 0 ; par10 = FALSE ;
Parameters (R input):
par1 = 12 ; par2 = 0.2 ; par3 = 0 ; par4 = 1 ; par5 = 12 ; par6 = 3 ; par7 = 0 ; par8 = 2 ; par9 = 0 ; par10 = FALSE ;
R code (references can be found in the software module):
par1 <- as.numeric(par1) #cut off periods
par2 <- as.numeric(par2) #lambda
par3 <- as.numeric(par3) #degree of non-seasonal differencing
par4 <- as.numeric(par4) #degree of seasonal differencing
par5 <- as.numeric(par5) #seasonal period
par6 <- as.numeric(par6) #p
par7 <- as.numeric(par7) #q
par8 <- as.numeric(par8) #P
par9 <- as.numeric(par9) #Q
if (par10 == 'TRUE') par10 <- TRUE
if (par10 == 'FALSE') par10 <- FALSE
if (par2 == 0) x <- log(x)
if (par2 != 0) x <- x^par2
lx <- length(x)
first <- lx - 2*par1
nx <- lx - par1
nx1 <- nx + 1
fx <- lx - nx
if (fx < 1) {
fx <- par5
nx1 <- lx + fx - 1
first <- lx - 2*fx
}
first <- 1
if (fx < 3) fx <- round(lx/10,0)
(arima.out <- arima(x[1:nx], order=c(par6,par3,par7), seasonal=list(order=c(par8,par4,par9), period=par5), include.mean=par10, method='ML'))
(forecast <- predict(arima.out,fx))
(lb <- forecast$pred - 1.96 * forecast$se)
(ub <- forecast$pred + 1.96 * forecast$se)
if (par2 == 0) {
x <- exp(x)
forecast$pred <- exp(forecast$pred)
lb <- exp(lb)
ub <- exp(ub)
}
if (par2 != 0) {
x <- x^(1/par2)
forecast$pred <- forecast$pred^(1/par2)
lb <- lb^(1/par2)
ub <- ub^(1/par2)
}
if (par2 < 0) {
olb <- lb
lb <- ub
ub <- olb
}
(actandfor <- c(x[1:nx], forecast$pred))
(perc.se <- (ub-forecast$pred)/1.96/forecast$pred)
bitmap(file='test1.png')
opar <- par(mar=c(4,4,2,2),las=1)
ylim <- c( min(x[first:nx],lb), max(x[first:nx],ub))
plot(x,ylim=ylim,type='n',xlim=c(first,lx))
usr <- par('usr')
rect(usr[1],usr[3],nx+1,usr[4],border=NA,col='lemonchiffon')
rect(nx1,usr[3],usr[2],usr[4],border=NA,col='lavender')
abline(h= (-3:3)*2 , col ='gray', lty =3)
polygon( c(nx1:lx,lx:nx1), c(lb,rev(ub)), col = 'orange', lty=2,border=NA)
lines(nx1:lx, lb , lty=2)
lines(nx1:lx, ub , lty=2)
lines(x, lwd=2)
lines(nx1:lx, forecast$pred , lwd=2 , col ='white')
box()
par(opar)
dev.off()
prob.dec <- array(NA, dim=fx)
prob.sdec <- array(NA, dim=fx)
prob.ldec <- array(NA, dim=fx)
prob.pval <- array(NA, dim=fx)
perf.pe <- array(0, dim=fx)
perf.mape <- array(0, dim=fx)
perf.se <- array(0, dim=fx)
perf.mse <- array(0, dim=fx)
perf.rmse <- array(0, dim=fx)
for (i in 1:fx) {
locSD <- (ub[i] - forecast$pred[i]) / 1.96
perf.pe[i] = (x[nx+i] - forecast$pred[i]) / forecast$pred[i]
perf.mape[i] = perf.mape[i] + abs(perf.pe[i])
perf.se[i] = (x[nx+i] - forecast$pred[i])^2
perf.mse[i] = perf.mse[i] + perf.se[i]
prob.dec[i] = pnorm((x[nx+i-1] - forecast$pred[i]) / locSD)
prob.sdec[i] = pnorm((x[nx+i-par5] - forecast$pred[i]) / locSD)
prob.ldec[i] = pnorm((x[nx] - forecast$pred[i]) / locSD)
prob.pval[i] = pnorm(abs(x[nx+i] - forecast$pred[i]) / locSD)
}
perf.mape = perf.mape / fx
perf.mse = perf.mse / fx
perf.rmse = sqrt(perf.mse)
bitmap(file='test2.png')
plot(forecast$pred, pch=19, type='b',main='ARIMA Extrapolation Forecast', ylab='Forecast and 95% CI', xlab='time',ylim=c(min(lb),max(ub)))
dum <- forecast$pred
dum[1:12] <- x[(nx+1):lx]
lines(dum, lty=1)
lines(ub,lty=3)
lines(lb,lty=3)
dev.off()
load(file='createtable')
a<-table.start()
a<-table.row.start(a)
a<-table.element(a,'Univariate ARIMA Extrapolation Forecast',9,TRUE)
a<-table.row.end(a)
a<-table.row.start(a)
a<-table.element(a,'time',1,header=TRUE)
a<-table.element(a,'Y[t]',1,header=TRUE)
a<-table.element(a,'F[t]',1,header=TRUE)
a<-table.element(a,'95% LB',1,header=TRUE)
a<-table.element(a,'95% UB',1,header=TRUE)
a<-table.element(a,'p-value
(H0: Y[t] = F[t])',1,header=TRUE)
a<-table.element(a,'P(F[t]>Y[t-1])',1,header=TRUE)
a<-table.element(a,'P(F[t]>Y[t-s])',1,header=TRUE)
mylab <- paste('P(F[t]>Y[',nx,sep='')
mylab <- paste(mylab,'])',sep='')
a<-table.element(a,mylab,1,header=TRUE)
a<-table.row.end(a)
for (i in (nx-par5):nx) {
a<-table.row.start(a)
a<-table.element(a,i,header=TRUE)
a<-table.element(a,x[i])
a<-table.element(a,'-')
a<-table.row.end(a)
}
for (i in 1:fx) {
a<-table.row.start(a)
a<-table.element(a,nx+i,header=TRUE)
a<-table.element(a,round(x[nx+i],4))
a<-table.element(a,round(forecast$pred[i],4))
a<-table.element(a,round(lb[i],4))
a<-table.element(a,round(ub[i],4))
a<-table.element(a,round((1-prob.pval[i]),4))
a<-table.element(a,round((1-prob.dec[i]),4))
a<-table.element(a,round((1-prob.sdec[i]),4))
a<-table.element(a,round((1-prob.ldec[i]),4))
a<-table.row.end(a)
}
a<-table.end(a)
table.save(a,file='mytable.tab')
a<-table.start()
a<-table.row.start(a)
a<-table.element(a,'Univariate ARIMA Extrapolation Forecast Performance',7,TRUE)
a<-table.row.end(a)
a<-table.row.start(a)
a<-table.element(a,'time',1,header=TRUE)
a<-table.element(a,'% S.E.',1,header=TRUE)
a<-table.element(a,'PE',1,header=TRUE)
a<-table.element(a,'MAPE',1,header=TRUE)
a<-table.element(a,'Sq.E',1,header=TRUE)
a<-table.element(a,'MSE',1,header=TRUE)
a<-table.element(a,'RMSE',1,header=TRUE)
a<-table.row.end(a)
for (i in 1:fx) {
a<-table.row.start(a)
a<-table.element(a,nx+i,header=TRUE)
a<-table.element(a,round(perc.se[i],4))
a<-table.element(a,round(perf.pe[i],4))
a<-table.element(a,round(perf.mape[i],4))
a<-table.element(a,round(perf.se[i],4))
a<-table.element(a,round(perf.mse[i],4))
a<-table.element(a,round(perf.rmse[i],4))
a<-table.row.end(a)
}
a<-table.end(a)
table.save(a,file='mytable1.tab')